Article Text

Abstract
Objectives Universities are exploring strategies to mitigate the spread of COVID-19 prior to reopening their campuses. National guidelines do not currently recommend testing students prior to campus arrival. However, the impact of presemester testing has not been studied.
Design Dynamic SARS-CoV-2 transmission models are used to explore the effects of three presemester testing interventions.
Interventions Testing of students 0, 1 and 2 times prior to campus arrival.
Primary outcomes Number of active infections and time until isolation bed capacity is reached.
Setting We set on-campus and off-campus populations to 7500 and 17 500 students, respectively. We assumed 2% prevalence of active cases at the semester start, and that one-third of infected students will be detected and isolated throughout the semester. Isolation bed capacity was set at 500. We varied disease transmission rates (R0=1.5, 2, 3, 4) to represent the effectiveness of mitigation strategies throughout the semester.
Results Without presemester screening, peak number of active infections ranged from 4114 under effective mitigation strategies (R0=1.5) to 10 481 under ineffective mitigation strategies (R0=4), and exhausted isolation bed capacity within 10 (R0=4) to 25 days (R0=1.5). Mandating at least one test prior to campus arrival delayed the timing and reduced the size of the peak, while delaying the time until isolation bed capacity was reached. Testing twice in conjunction with effective mitigation strategies (R0=1.5) was the only scenario that did not exhaust isolation bed capacity during the semester.
Conclusions Presemester screening is necessary to avert early and large surges of active COVID-19 infections. Therefore, we recommend testing within 1 week prior to and on campus return. While this strategy is sufficient for delaying the timing of the peak outbreak, presemester testing would need to be implemented in conjunction with effective mitigation strategies to significantly reduce outbreak size and preserve isolation bed capacity.
- health policy
- public health
- statistics & research methods
- infection control
This is an open access article distributed in accordance with the Creative Commons Attribution Non Commercial (CC BY-NC 4.0) license, which permits others to distribute, remix, adapt, build upon this work non-commercially, and license their derivative works on different terms, provided the original work is properly cited, appropriate credit is given, any changes made indicated, and the use is non-commercial. See: http://creativecommons.org/licenses/by-nc/4.0/.
Statistics from Altmetric.com
Strengths and limitations of this study
This modelling study informs universities about the impact of pre-semester testing on COVID-19 spread.
We evaluate the impact of presemester testing on the number of active COVID-19 cases at the semester start.
Using dynamic transmission models, we also evaluate the impact of presemester testing strategies on the number of active infections throughout the semester and on time until isolation bed capacity is reached.
Our model parameters are informed by the current literature on SARS-CoV-2 transmission dynamics.
A limitation of our study is that results are dependent on model input parameters. Therefore, we created a user-friendly web-based application to provide model projections on up-to-date parameters when they become available.
Introduction
Universities in the USA are currently exploring strategies to mitigate the spread of COVID-19 prior to reopening their campuses. Between dormitories, classrooms and nightlife, university campuses present an ideal environment for viral spread and are therefore at extreme risk of serving as a hotbed for a COVID-19 outbreak. This has been the recent experience of several universities in the USA.1 Many universities have widespread testing capabilities, contact tracing and reserved spaces to isolate detected cases, which are well-known strategies for controlling COVID-19 in the absence of a vaccine.2–5 Recent modelling studies found that widespread testing of the entire student population once per month was sufficient for detecting an outbreak of fewer than nine individuals,4 and small outbreaks could be contained with highly effective contact tracing and case isolation.5
However, these strategies may not be sufficient for curtailing a larger outbreak should one occur. This is primarily due to the number of daily high-density social events, especially during the first few weeks of the semester, that occur on and off campus.6–8 These events lead to a high number of close-encounter contacts per student and thus provides a perfect path for viral transmission. Because cases are not detected immediately, it will be virtually impossible to trace all close-encounter contacts of infected individuals. A recent study concluded that contact tracing and isolation are likely ineffective in controlling outbreaks if the number of initial cases is 40 or greater.5 Given the difficulties of timely contact tracing in the university setting, it is of utmost importance to limit the initial number of active cases at the start of the semester. One method of doing so is through student testing prior to campus return.
There are differing views as to whether universities should test all students for COVID-19 prior to campus arrival. While some public officials stress the need to test in order to contain the spread of the virus, others cite the costs and false negatives of tests as reasons to limit testing and isolation to symptomatic students on their return to campus.9 Currently, the Center for Disease Control and Prevention (CDC) does not overtly endorse, nor recommend against, testing the entire student population prior to campus arrival.10However, the impact of presemester testing strategies have not been previously studied.10
Our team was tasked with recommending strategies for baseline testing and isolation bed capacity to be used in moving a large university in the Southeastern USA towards reopening in Fall 2020 amidst the ongoing COVID-19 pandemic. We considered several testing strategies: (1) No screening of students prior to the fall semester, (2) requiring all students to present a negative test (via a nucleic acid amplification test, NAT) within 1 week of arrival and (3) requiring all students to present two negative NAT tests within 1 week of arrival on campus.
Methods
To guide and inform our recommendations, we implemented a two-population (on and off campus) dynamic transmission model11 of SARS-CoV-2 infection under each testing strategy to determine the number of active infections and the days until the maximum isolation bed occupancy is reached. The latter could be viewed as a potential ‘trigger’ that would initiate moving the university online, since a lack of isolation beds will force universities to allow infectious individuals to live among susceptible students. This would substantially increase the risk of disease transmission and would violate current CDC guidelines.12 The model includes the following compartments: S, E, I1, I2, H, R, where S is the number of susceptible individuals (ie, those who have not yet been infected), E is the number of individuals who are exposed but not yet infectious, I1 is the number of asymptomatic or undetected infected individuals, I2 is the number of symptomatic and detected infected individuals, H is the number of individuals requiring housing for isolation and R is the number of recovered individuals. Additional model detail is provided in online supplemental table 1.
Supplemental material
Table 1 presents the percentage of active cases at the beginning of the semester for each testing strategy for a population of N=25 000, assuming different levels of active infection rates in the student population. We assume an initial active infection rate of 2% for the transmission model. This is based on a sample of students moving into residence halls and campus apartments at the University of Iowa.13 We assume that 10%4 of students will have already had the disease and recovered by the start of the semester. For each testing strategy, the number of infected individuals on campus at the start of the semester is provided in the second row of table 1. In the models below, we also assume a student population of 25 000, with an on-campus population of 7500 and an off-campus population of 17 500. We specify the maximum occupancy of isolation beds to be 2% of the student population. For a university with a student population of 25 000, this is equivalent to 500 isolation beds. We assume that students remain in isolation for 11 days, which represents the median time until a negative NAT test.14 We assume that 50% of infections are symptomatic,15 but only two out of three symptomatic students will be detected and isolate. Thus, we implicitly assume that one-third of all infected students are detected and require an isolation bed.
Percentage (and expected number) of active cases under different initial active infection rates and testing strategies
We vary the level of R0 between 1.5, 2, 3 and 4 to represent the effectiveness of mitigation strategies throughout the semester. The lower values of R0 imply a reduced contact rate between students and reflect effective mitigation strategies, such as frequent testing, successful contact tracing and isolation of suspected and confirmed cases, enforcement of social distancing, mask mandates, etc. The CDC estimates R0 in the range of 2–4.16 Additional parameters for our model are based on the published literature and are provided in online supplemental table 2.4 13–21 We have developed a user-friendly application that allows the user to vary the parameters of this model. This application is available at the following website: https://rennertl.shinyapps.io/PresemesterTesting/. The R code generating this application is available as an online supplemental file.
Supplemental material
Supplemental material
Patient and public involvement
No patients or the public were involved in the development of research questions, study design, writing, interpretation or dissemination of the results.
Results
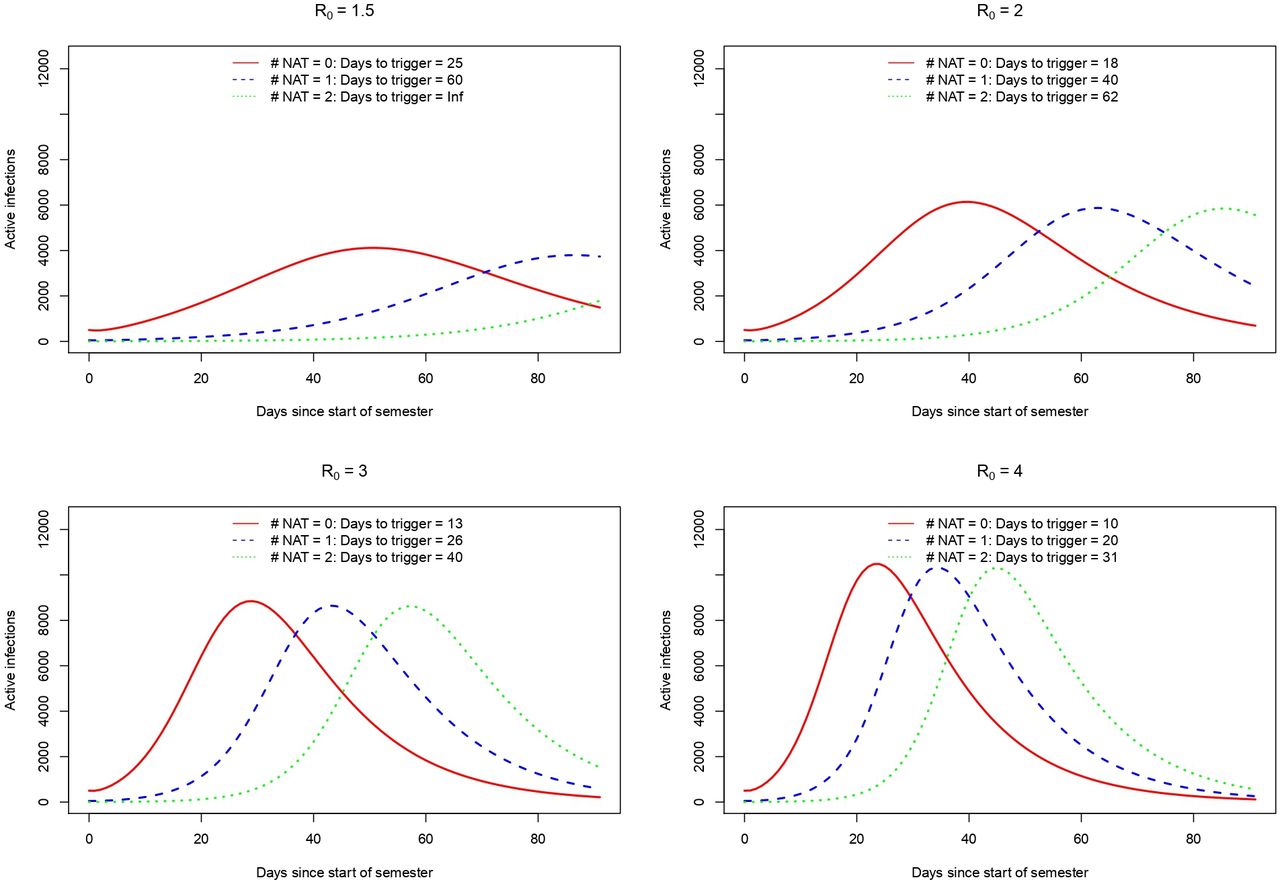
The results of the modelling study are presented in figure 1. If no presemester screening is mandated, the timing of the peak number of active infections occurs between 24 days (R0=4) and 50 days (R0=1.5). The size of the peak is substantial, ranging from 4114 active infections when effective mitigation strategies are implemented (R0=1.5) to 10 481 active infections for less effective strategies (R0=4). Furthermore, no presemester screening exhausts isolation bed capacity within 10 days (R0=4) to 25 days (R0=1.5).

Expected number of active infections over time under three presemester testing strategies: no NAT tests (solid red line), 1 NAT test (dashed blue line), 2 NAT tests (dotted green line). assuming one-third of infected students require an isolation bed, and an availability of 500 isolation beds. Days to trigger represents the time (days) until isolation bed capacity is reached. NAT, nucleic acid amplification test.
Requiring at least one NAT test within 1 week of campus arrival delays the timing of the peak number of active infections and the corresponding time until isolation bed occupancy is reached. The advantages of presemester screening are especially noteworthy when implemented in conjunction with effective mitigation strategies (as indicated by the lower values of R0). When one NAT test is mandated within 1 week of campus arrival, effective (R0=1.5) and less effective (R0=4) mitigation strategies delay the onset of the peak to 86 days and 34 days, respectively, and result in a peak size ranging from 3794 to 10 325 active infections. When two NAT tests are mandated, effective (R0=1.5) and less effective (R0=4) mitigation strategies delay the onset of the peak through the end of fall semester and 45 days, respectively, and result in peak size ranging from 1790 to 10 310 active infections.
However, unless university mitigation strategies are indeed effective, maximum isolation bed occupancy is reached quickly. If one out of three infections require isolation, then presemester screening alone will not maintain isolation bed occupancy below the maximum threshold in most settings. Presemester screening using one NAT test exhausts isolation bed capacity within 20 days (R0=4) to 60 days (R0=1.5). Presemester screening using two NAT tests maintains isolation bed capacity through the end of the semester if highly effective mitigation strategies are deployed (R0=1.5). For less effective mitigation strategies, capacity will be exceeded between 31 days (R0=4) and 62 days (R0=2).
Discussion
The results of our study demonstrate that testing all students prior to campus arrival minimises the number of active infections at the semester start, reduces the size of the peak outbreak, and delays both the time of the peak and the time until isolation bed capacity is reached. Detection of active cases prior to campus arrival is therefore essential to ensuring that a rapid spike of cases does not occur at the beginning of the semester; a failure to do so can result in bringing anywhere from hundreds to thousands of infectious cases onto campus. Limiting screening to symptomatic students may not be sufficient, as many students may be presymptomatic or asymptomatic, and can unknowingly facilitate disease spread. Ideally, given the biology of the virus and the operating characteristics of the various NAT tests available for COVID-19, we believe that each student should be tested twice to minimise the risk of false negatives.22Our team has specifically recommended that each student be tested (via NAT) within 1 week of campus return and on return to campus. We note that institutions may choose to implement alternative testing for SARS-CoV-2 as they become established.23 For example, saliva-based tests may provide a faster, cheaper and less invasive alternative to nasal swab testing, without compromising test sensitivity.24 However, even with presemester screening, highly effective mitigation strategies are needed to avoid a large surge in cases.
Given the recent surge of COVID-1925 and that vaccination will unlikely be available to students and institutional employees before 2021,26 implementation of prearrival testing will still be relevant for the Spring 2021 semester. Our recommendations for prearrival testing are indeed relevant for both future waves of the COVID-19 pandemic and future pandemics. Furthermore, prearrival testing is applicable to any institution (eg, schools, workforce, etc) returning individuals to high-density environments that are conducive to disease spread.
Strengths and limitations
Our study is the first to evaluate the impact of testing all students prior to their return to university campuses. A major strength of our study is that our models are guided by up-to-date disease transmission dynamics. However, information on these parameters may change with time, and may vary from institution to institution. We have, therefore, created a web application that allows the user to set the model parameters to reflect their institutional settings and/or to update parameters as more information becomes available (https://rennertl.shinyapps.io/PresemesterTesting/). The choices of these parameters may have a substantial impact on the timing and the size of the peak number of active infections. For example, longer infectious periods and a lower proportion of the population that is immune at the semester start correspond to earlier and larger peaks, while an increase in the time spent in isolation decreases the time until isolation bed capacity is reached. More robust data on these parameters and test sensitivity, disease prevalence at the onset of the semester, and the impact of mitigation strategies on disease spread would vastly improve these estimates by minimising uncertainty.
One limitation of our model is that it exclusively focuses on the student population, whereas the disease transmission could very well occur between a student and a faculty/staff member of the university, who is on average older and more at risk for severe outcomes from contracting COVID-19. An outbreak within the university community could also influence the disease transmission pattern among local residents and vice versa. Future variants of our model could incorporate interactions between students, university faculty/staff and local residents around the university campus.
There are also several logistical challenges to the proposed strategies discussed here. It remains unclear as to whether insurance providers will cover the costs of precautionary tests.27 Therefore, the financial burden may fall on the students or the university. In addition, single administration of a test could miss cases in the early stages of infection, as well as cases that occur in the days between administration of the test and campus arrival.10 For these reasons, a second NAT test has been recommended. However, this strategy amplifies the financial concerns and introduces additional logistical challenges. Universities may need to implement the second test on arrival on campus and thus need to ensure that proper resources are in place.10
Another logistical challenge is the turn around time of the diagnostic tests. It has been noted that test turnaround time could be more important than test sensitivity in controlling this pandemic,28 and if the turnaround time is too long, then the follow-up isolation, quarantine and contact tracing will be infeasible. There has been serious concern about the bottleneck with testing services and the associated wait time for test results.29 However, with a series of point-of-care tests now authorised by the Food and Drug Administration and the congressionally funded RADx-Advanced Technologies Platforms programme to support 24 hours test turnaround time,30 there is reason to anticipate that the testing bottleneck will be less of a serious challenge for American colleges and universities in the coming months of the pandemic.
Conclusion
Detection of SARS-CoV-2 prior to campus arrival is necessary to avoid a large outbreak of hundreds to thousands of active infections at the onset of the semester. This is achievable through presemester screening via COVID-19 testing of the entire student population prior to campus arrival. While intensive presemester testing will delay the time of the peak outbreak and the time until isolation bed capacity is reached, such testing must be implemented in conjunction with highly effective mitigation strategies throughout the semester in order to substantially reduce outbreak size and preserve isolation bed capacity.
Acknowledgments
We thank the reviewers for their valuable comments and suggestions.
Supplementary materials
Supplementary Data
This web only file has been produced by the BMJ Publishing Group from an electronic file supplied by the author(s) and has not been edited for content.
Footnotes
Contributors LR: conceptualisation, methodology, writing, review and editing; CAK: projecting administration, review and editing; LS: data acquisition and review; CM: conceptualisation, methodology, writing, review and editing.
Funding LR, CAK and LS acknowledge salary support from Clemson University for modelling work pertaining to reopening strategies (award number: 1502394).
Competing interests LR, CAK, and LS acknowledge salary support from Clemson University for modelling work pertaining to reopening strategies (award number: 1502394).
Patient consent for publication Not required.
Provenance and peer review Not commissioned; externally peer reviewed.
Data availability statement Data sharing not applicable as no datasets generated and/or analysed for this study. R code for dynamic transmission models is included as a supplemental file.
Supplemental material This content has been supplied by the author(s). It has not been vetted by BMJ Publishing Group Limited (BMJ) and may not have been peer-reviewed. Any opinions or recommendations discussed are solely those of the author(s) and are not endorsed by BMJ. BMJ disclaims all liability and responsibility arising from any reliance placed on the content. Where the content includes any translated material, BMJ does not warrant the accuracy and reliability of the translations (including but not limited to local regulations, clinical guidelines, terminology, drug names and drug dosages), and is not responsible for any error and/or omissions arising from translation and adaptation or otherwise.