Article Text

Abstract
Objective The aim in this study was to stratify maximum blood glucose levels to identify the the best cut-off value of glucose levels to predict mortality in acute coronary syndrome (ACS) patients, regardless of whether they had diabetes.
Design A retrospective cohort study.
Setting All clinical data were obtained from the ‘Medical Information Mart for Intensive Care III’ database.
Participants A total of 3078 patients with ACS were included in the study. We divided the patients into four levels based on their maximum blood glucose levels (glucosemax), then analysed the relationship between each group with mortality.
Results Among enrolled patients, 2780 and 298 were survivors and non-survivors, respectively. Blood glucose levels and mortality showed a ‘tick’ type relationship, with levels 3 and 4 found to be closely associated with increased hospital mortality (p<0.05), relative to level 1 (<6.1 mmol/L), used as the reference group. No significant association was observed in mortality between level 2 and level 1 (p=0.095). In addition, we found a gradual increase in OR for level 2 (OR: 2.42, 95% CI 0.86 to 6.80, p=0.095), level 3 (OR: 4.33, 95% CI 1.55 to 12.13, p=0.005) and level 4 (OR: 7.27, 95% CI 2.56 to 20.62, p<0.001), relative to level 1. Based on receiver operating characteristic curves, the optimal cut-off value for predicting mortality were 11.5 (area under curve (AUC)=0.724), 11.2 (AUC=0.729), 13.4 (AUC=0.638), 15.8 (AUC=0.717) and 11.3 mmol/L (AUC=0.764) in all ACS, acute myocardial infarction, unstable angina, diabetes and non-diabetes patients, respectively. The results of subgroup analysis suggested that in patients with significantly elevated blood glucose, the mortality of non-diabetes was higher than patients with diabetes (OR: 0.42, 95% CI 0.31 to 0.57, p<0.001).
Conclusion Overall, glucosemax ≥11.5 mmol/L had a significant association with increased mortality in patients with ACS. Non-diabetes ACS patients need a more robust blood glucose management strategy compared with diabetes counterparts.
- coronary heart disease
- adult cardiology
- myocardial infarction
This is an open access article distributed in accordance with the Creative Commons Attribution Non Commercial (CC BY-NC 4.0) license, which permits others to distribute, remix, adapt, build upon this work non-commercially, and license their derivative works on different terms, provided the original work is properly cited, appropriate credit is given, any changes made indicated, and the use is non-commercial. See: http://creativecommons.org/licenses/by-nc/4.0/.
Statistics from Altmetric.com
Strengths and limitations of this study
All data were extracted from a public open-access database.
Subgroup analysis based on the disease contribute to dissect the influencing factor.
The best cut-off value of blood glucose to predict mortality was identified to the disease subgroup.
The maximum blood glucose might be influenced by several factors that may cause a deviation in the conclusion.
Due to the retrospective design of the study, causality cannot be inferred from the results.
Introduction
Acute coronary syndrome (ACS) is mainly caused by coronary artery disease occlusion and can range from unstable angina (UA) to ST segment elevation myocardial infarction.1 Patients with ACS commonly exhibit hyperglycaemia, although the relationship between these conditions is complex. Numerous studies have demonstrated occurrence of hyperglycaemia in critically ill patients, irrespective of whether they have diabetes.2–4 A previous study, analysing patients with acute coronary heart disease, found that 58% of them exhibited impaired glucose regulation, compared with 51% in the stable patients.5 The adverse effects of hyperglycaemia in ACS have been widely studied.6–8 In addition, several studies have confirmed that hyperglycaemia is an independent factor for ACS prognosis, although the mechanism between elevated blood glucose levels and poor ACS prognosis remains unclear.9 10 For example, Foo et al11 stratified the relationship between blood glucose and cardiogenic death based on admission blood glucose levels but did not determine a blood glucose threshold for predicting hospital mortality. Furthermore, the optimal glucose cut-off value for predicting mortality in patients with ACS is also controversial, with some studies reporting a 2.2-fold increase in risk of shock when the admission blood glucose was higher than 11.5 mmol/L.12 For non-ST-segment elevation myocardial infarction patients, 8.2 mmol/L was previously shown to be the optimal admission glucose cut-off value for predicting outcomes.13 However, no study has reported the optimal cut-off value for maximum blood glucose to predict adverse outcomes, despite its potential in predicting prognosis.
The relationship between blood glucose levels and mortality in patients with ACS also remains unclear. Previous studies have shown that acute or stress hyperglycaemia may promote and exacerbate the outcomes of cell damage caused by myocardial ischaemia in patients with ACS.14 Furthermore, hyperglycaemia-induced oxidative stress may activate platelet-related signalling pathways, leading to platelet aggregation and formation of atherosclerotic plaque.15 Nevertheless, the evidence on maximum blood glucose levels and mortality remains to be validated. Our study sought to evaluate the potential for levels of blood glucose as an important prognostic factor for mortality in patients with ACS, regardless of whether they had diabetes. Specifically, maximum blood glucose levels were analysed in patients to ascertain the optimal cut-off value for predicting hospital mortality. We also performed subgroup analysis based on the type of ACS and whether patients had diabetes to identify the relationship between different disease states and mortality.
Material and methods
Data access
All patient data were downloaded from the Medical Information Mart for Intensive Care III database V.1.4.16 The database comprises comprehensive clinical information of inpatients at the Beth Israel Deaconess Medical Center (BIDMC) in Boston, Massachusetts from 1 June 2001 to 31 October 2012. The use of this database was approved by the BIDMC Institutional Review Board; therefore, we did not require an ethical approval statement and informed consent for this study. Since any researcher who has completed the ‘Protecting of Human Subjects’ training can access the database, our data extraction processes were performed by JQ, following completion of the National Institutes of Health online training course (certificate code: 32299459).
Study population
We first screened 3221 patients with ACS and included all patients admitted with ACS. We excluded 143 patients, due to repeated admissions and missing data, as well as pregnant women and patients younger than 18 years old. Finally, a total of 3078 patients, including 2011 patients with acute myocardial infarction (AMI) and 1067 patients with UA were enrolled in the study. Information extracted from the database included age, sex, comorbidities, medications used and laboratory tests performed on admission, Sequential Organ Failure Assessment (SOFA) score, detailed records of blood glucose during hospitalisation, hospital and intensive care unit (ICU) mortality, as well as hospital and ICU length of stay (LOS). The blood glucose of each patient was measured three to four times during hospitalisation. The first blood glucose at admission was defined as the initial blood glucose, and the maximum blood glucose was selected as the research object of this article. Initial and maximum serum glucose levels were denoted as glucose0 and glucosemax, respectively. Thereafter, max blood glucose was divided into the following groups based on clinical experience: level 1 (<6.1 mmol/L), level 2 (6.1–11.1 mmol/L), level 3 (11.1–16.6 mmol/L) and level 4 (≥16.6 mmol/L), with level 1 used as reference group.
Outcomes and definitions
The primary outcome was defined as hospital mortality, whereas other outcomes were defined as ICU mortality, hospital and ICU LOS, as well as acute kidney injury. Data for the first ICU stay alone was extracted, whereas acute kidney injury was defined as serum creatinine levels that were 1.5 times higher than the baseline.17
Statistical analysis
Statistical analyses were performed using Stata V.13.1 and SPSS V.23.0 software. Specifically, continuous variables were expressed as means±SD, with Student’s t-test, Wilcoxon rank-sum or Kruskal-Wallis tests used accordingly. However, categorical variables were presented as percentages, then comparisons made using the χ2 or Fisher’s exact tests. In addition, the lowess smoothing algorithm was used to show the rough relationship between blood glucose and mortality. Due to the large number of variables in this study, we first used univariate logistic regression for initial screening of influencing factors, then selected resulting variables with p<0.05 for multivariate logistic regression, with level 1 of the blood glucose used as the reference group. The forward likelihood method and p<0.05 were used to build the final regression model. In addition, receiver operating characteristic (ROC) curves were used to predict mortality during hospitalisation across different disease groups and also determine the cut-off value. Significance level was set at 0.05 level, and all analyses were two sided.
Patient and public involvement
No patient was involved in any part of this study.
Results
Among the 3078 patients with ACS included in the study, 2780 and 298 were survivors and non-survivors, respectively, with a hospital mortality of 9.8%. A summary of baseline characteristics for the study cohort is outlined in table 1. All demographic characteristics revealed significant differences between survivors and non-survivors, except in prior myocardial infarction, diabetes, chronic obstructive pulmonary disease and cerebral infarction. In addition, significantly lower (p<0.05) glucose0, glucosemax and glucosemin were recorded in survivors at 8.2±3.8, 10.9±5.0 and 5.1±1.4 mmol/L, respectively, than non-survivors who recorded 11.3±6.3, 15.6±7.5 and 6.0±3.6 mmol/L, respectively. We also divided patients with ACS into AMI group and UA group, and diabetes group and non-diabetes group, and analysed baseline characteristics of two groups, respectively (online supplemental tables 1 and 2). We found that the mortality of AMI was significantly higher than patients with UA, as well as the blood glucose levels (all p<0.001). However, although the blood glucose level of the diabetes group was significantly higher than non-diabetes group (p<0.001), there was no difference in mortality between two groups (p=0.528).
Supplemental material
Supplemental material
Baseline characteristics of demographics between survivors and non–survivors
Analysis of data from ACS patients with or without diabetes revealed a rough relationship between serum glucosemax and hospital mortality across different diseases (figure 1). Generally, the relationship was ‘tick’ shaped (figure 1A, B, D and E), except in the UA group (figure 1C). A summary of the relationship between glucosemax categories and end points is provided in table 2. Particularly, patients with elevated glucosemax levels had significantly higher rates of unadjusted hospital and ICU mortality (p<0.001). In addition, high glucosemax levels were associated with longer hospital and ICU LOS, as well as acute kidney injury (all p<0.001).

Association between maximum glucose levels and hospital mortality in groups of different diseases.
Unadjusted outcomes by maximum glucose categories in patients with ACS
Results from univariate and multivariate logistic regression analyses used to predict mortality are outlined in table 3. Summarily, the univariate logistic model revealed that age, male, AMI, hypertension, heart failure, hyperlipidaemia, atrial fibrillation, aspirin, ACE inhibitor (ACEI), β blocker, clopidogrel, diuretic, statin, insulin, oral hypoglycaemic agents, white cell count (WCC), haemoglobin, creatinine, SOFA score and glucosemax categories were all predictors of hospital mortality. After adjusting for covariates, multivariate logistic regression results showed that age, AMI, atrial fibrillation, ACEI, β blocker, statin, oral hypoglycaemic agents, WCC, SOFA scores and glucosemax were all independent predictors of hospital mortality. Analysis of the relationship between glucosemax categories and mortality revealed that level 3 and level 4 were both associated with increased hospital mortality (p<0.05), relative to level 1 (<6.1 mmol/L) set as the reference group. However, we found no significant difference in mortality between level 2 and level 1 (p=0.095). We also found a gradual increase in OR for level 2 (OR: 2.42, 95% CI 0.86 to 6.80, p=0.095), level 3 (OR: 4.33, 95% CI 1.55 to 12.13, p=0.005) and level 4 (OR: 7.27, 95% CI 2.56 to 20.62, p<0.001) relative to level 1.
Effects of variables on hospital mortality in univariate and multivariate logistic regression analysis in all patients with ACS
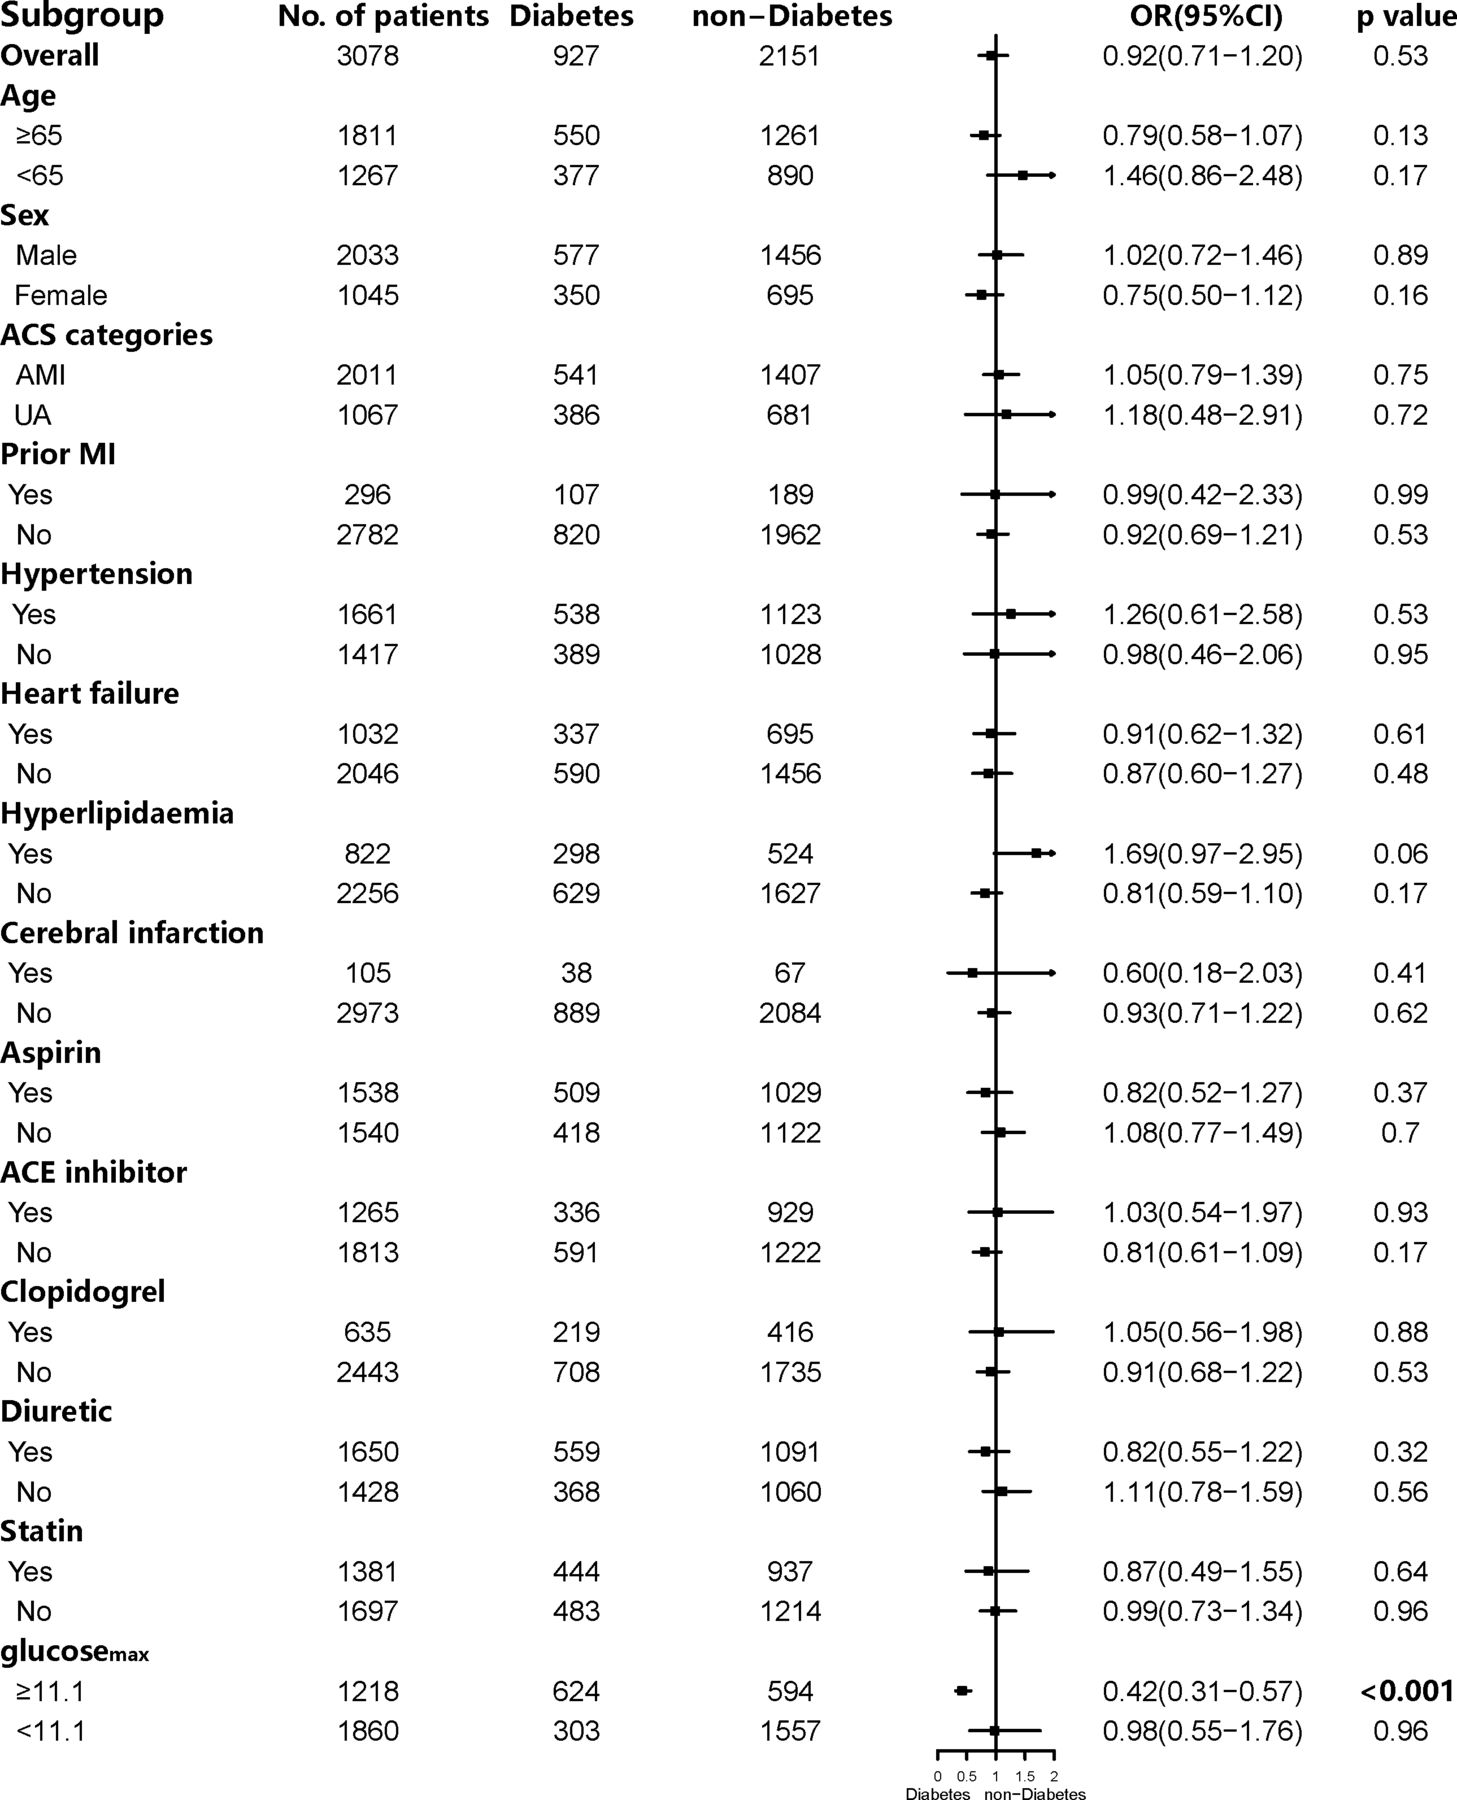
Finally, we used ROC curves to assess the predictive utility of glucosemax in hospital mortality and determine the optimal cut-off value. Results indicated that optimal cut-off values were 11.5 (area under curve (AUC)=0.724), 11.2 (AUC=0.729), 13.4 (AUC=0.638), 15.8 (AUC=0.717) and 11.3 mmol/L (AUC=0.764) for all ACS, AMI, UA, diabetes and non-diabetes patients, respectively (figure 2). To further identify the difference between diabetes and non-diabetes with mortality, we performed a subgroup analysis of the two groups (figure 3 and online supplemental table 3). Interestingly, we found that except for patients with significantly elevated blood glucose (≥11.1 mmol/L), subgroup analysis of diabetes and non-diabetes indicated other factors were not statistically significant with hospital mortality. Among patients with blood glucosemax levels ≥11.1 mmol/L, the mortality of non-diabetes patients was significantly higher than diabetes patients (OR: 0.42, 95% CI 0.31 to 0.57, p<0.001). However, in patients with blood glucosemax <11.1 mmol/L, there was no significant difference in mortality between the two groups (OR: 0.98, 95% CI 0.55 to 1.76, p=0.96).
Supplemental material

The glucosemax during hospitalisation level ROC curve for hospital mortality in groups of different diseases. AUC, area under curve; ROC, receiver operating characteristic.
Subgroup analysis of diabetes group and non-diabetes group. ACS, acute coronary syndrome; AMI, acute myocardial infarction; MI, myocardial infarction; UA, unstable angina.
Discussion
Results from our study revealed an association between maximum glucose levels and increased hospital mortality in patients with ACS, as evidenced by a ‘tick’-shaped relationship. In addition, we determined optimal cut-off values for the maximum blood glucose during hospitalisation that could contribute to predict hospital mortality across different disease groups. We also performed subgroup analysis of whether patients with ACS had diabetes to clarify the relationship with mortality. Previous studies have reported a gradual increase in mortality of ACS patients with increase in blood glucose.11 18 19 However, our findings indicated that hospital mortality first decreased, then increased with a gradual increase in blood glucose levels, except in patients with UA. This weakened trend could be due to the small number of patients in the UA group. When the blood glucose level fluctuates within a more normal range, the mortality of patients was relatively lowest. In the diabetic group, blood glucose levels corresponding to the death rate moved backward as a whole. However, when the blood glucose level was significantly increased (≥11.1 mmol/L), the mortality was positively correlated with the blood glucose levels. Glucose variability is important, and the elevated glucose (maximum glucose) may be one part of the glucose fluctuation. These findings are consistent with a previous study by Gerbaud et al20, which reported significant fluctuations of glucose was associated with cardiovascular outcomes.
The relationship between hyperglycaemia and adverse events in patients with ACS is not clear. For example, previous studies have shown that stress hyperglycaemia is produced through activation of the sympathetic nervous system and the hypothalamic–pituitary axis, leading to increased production of catecholamines and cortisol, as well as stimulating gluconeogenesis, glycogenolysis and lipolysis.21 22 Other studies have demonstrated that insulin-mediated reduction of blood glucose concentrations during ACS could reduce mortality.23 In addition, insulin treatment have been found to reduce inflammatory factors and coagulation media in plasma, thereby improving endothelial function and reducing the infarct size in patients with ACS.24 25 A large number of prospective studies analysing insulin in patients with ACS have reported varying degrees of benefit, although in the context of ACS, continuous insulin infusion is only recommended when blood glucose levels are higher than 10/11 mmol/L (180/200 mg/dL).26 27 In the current study, OR results indicated that insulin was a protective factor for hospital mortality in ACS, although this effect disappeared after adjusting for covariates, possibly due to a limited sample size.
Several studies have shown that patients with higher blood glucose levels exhibit increased 30-day and 1-year mortality, after multivariate adjustment of confounding factors, including age, sex, previous vascular events, hypertension, smoking status, Killip grade and atrial fibrillation, relative to those with a glucose concentration up to 6.1 mmol/L on admission.10 28 This trend was also observed in the current study. Results from the multivariate logistic regression analysis revealed that age, AMI (vs UA), atrial fibrillation, ACEI, β blocker, statin, oral hypoglycaemic agents, WCC, SOFA score and glucosemax categories were all independent factors for predicting hospital mortality in patients with ACS. However, we do not recommend the use of oral hypoglycaemic drugs for patients with ACS, since they might increase the risk of hypoglycaemia. Our findings also indicated a significant relationship between level 3 and level 4 with higher mortality, relative to level 1, whereas level 2 showed no statistically significant difference. This may be attributed to the symmetrical mortality corresponding to the blood glucose range in level 1 and level 2, which represented as first decreased then increase.
Furthermore, we evaluated the optimal cut-off values of serum glucosemax during hospitalisation in patients with ACS and used them to predict hospital mortality. However, we did not evaluate the prognostic effect of blood glucose on admission as reported in previous studies.29 To the best of our knowledge, this is the first study analysing glucosemax value in patients with ACS during hospitalisation and might provide a reference for the the upper limit of blood glucose control in future patients. Specifically, we divided patients with ACS into five groups according to disease, then compared AUC and cut-off values across each group. Results indicated that glucosemax in the non-diabetes group had the best predictive efficacy, with AUC and cut-off values of 0.754 and 11.3 mmol/L, respectively. These results indicated that even an increase in blood glucose of patients with ACS, without diabetes, was also an important indicator of increased mortality. The cut-off value was significantly higher in the diabetes (15.8 mmol/L) than non-diabetes group (11.3 mmol/L), suggesting a different management strategy of glucose for patients with and without diabetes. We also found that among patients whose blood glucosemax ≥11.1 mmol/L, the mortality of the non-diabetes group was significantly higher than the diabetes group. However, there was no significant difference in mortality between the two groups in patients with blood glucosemax <11.1 mmol/L. There are several interpretations for this condition. On the one hand, in this study, patients with diabetes were diagnosed based on their previous medical history when they were admitted to the hospital, and non-diabetes patients were also identified based on no previous history of diabetes. However, some non-diabetes patients may have a significant increase in blood glucose before admission, which was not known by patients. On the other hand, due to the stress state caused by ACS, patients without a history of diabetes might developed hyperglycaemia during hospitalisation, which resulted higher mortality in non-diabetes patients.
This study had some limitations. First, being a retrospective study, the independent link between hyperglycaemia and mortality may not necessarily equate to a causal relationship. Second, we only evaluated the relationship between maximum blood glucose and mortality during hospitalisation, which may cause a deviation in the conclusion. Third, it is possible that multiple factors may increase mortality. Lastly, maximum blood glucose levels may be affected by several factors, such as composition and duration of a meal and use or lack of hypoglycaemic drugs. These factors were not evaluated in the current study.
Conclusions
In summary, our findings indicated that mortality first decreased, then rose with increase in blood glucose levels. Patients with glucosemax ≥11.5 mmol/L exhibited a significant association with increased mortality in ACS. This association showed a ‘tick’-type relationship. Among patients with significantly elevated blood glucose, the mortality of non-diabetes patients was significantly higher than diabetes patients. Based on these findings, hospitalised blood glucose levels in patients with ACS may be an important tool for stratifying potential risk, hence could be used to guide development of treatment approaches. ACS patients without diabetes need a more robust blood glucose management strategy, relative to diabetic counterparts. However, further studies are needed to determine whether treatment or correction of hyperglycaemia may reduce mortality in patients with ACS.
References
Supplementary materials
Supplementary Data
This web only file has been produced by the BMJ Publishing Group from an electronic file supplied by the author(s) and has not been edited for content.
Footnotes
Contributors JQ and XL: responsible for data analysis and writing of the manuscript. LK and FC: responsible for data analysis. JQ: responsible for study data extraction. XL and JQ: statistician and responsible for data analysis. LC: responsible for data validation. All authors have read, revised and approved the final manuscript.
Funding This study was supported by the National Natural Science Foundation of China (Grant No. 81670403), Shanghai Science and Technology Committee (NO. 18411950300, 19XD1403300, and 19411963200).
Competing interests None declared.
Patient consent for publication Not required.
Ethics approval Laboratory for Computational Physiology at the Massachusetts Institute of Technology.
Provenance and peer review Not commissioned; externally peer reviewed.
Data availability statement Data may be obtained from a third party and are not publicly available. Full data set available from the corresponding author. However, reanalysis of the full data need to be approved by Medical Information Mart for Intensive Care III Institute.
Supplemental material This content has been supplied by the author(s). It has not been vetted by BMJ Publishing Group Limited (BMJ) and may not have been peer-reviewed. Any opinions or recommendations discussed are solely those of the author(s) and are not endorsed by BMJ. BMJ disclaims all liability and responsibility arising from any reliance placed on the content. Where the content includes any translated material, BMJ does not warrant the accuracy and reliability of the translations (including but not limited to local regulations, clinical guidelines, terminology, drug names and drug dosages), and is not responsible for any error and/or omissions arising from translation and adaptation or otherwise.