Article Text

Abstract
Objective To develop and validate a prediction model for predicting in-hospital mortality in patients with acute pancreatitis (AP).
Design A retrospective observational cohort study based on a large multicentre critical care database.
Setting All subject data were collected from the eICU Collaborative Research Database (eICU-CRD), which covers 200 859 intensive care unit admissions of 139 367 patients in 208 US hospitals between 2014 and 2015.
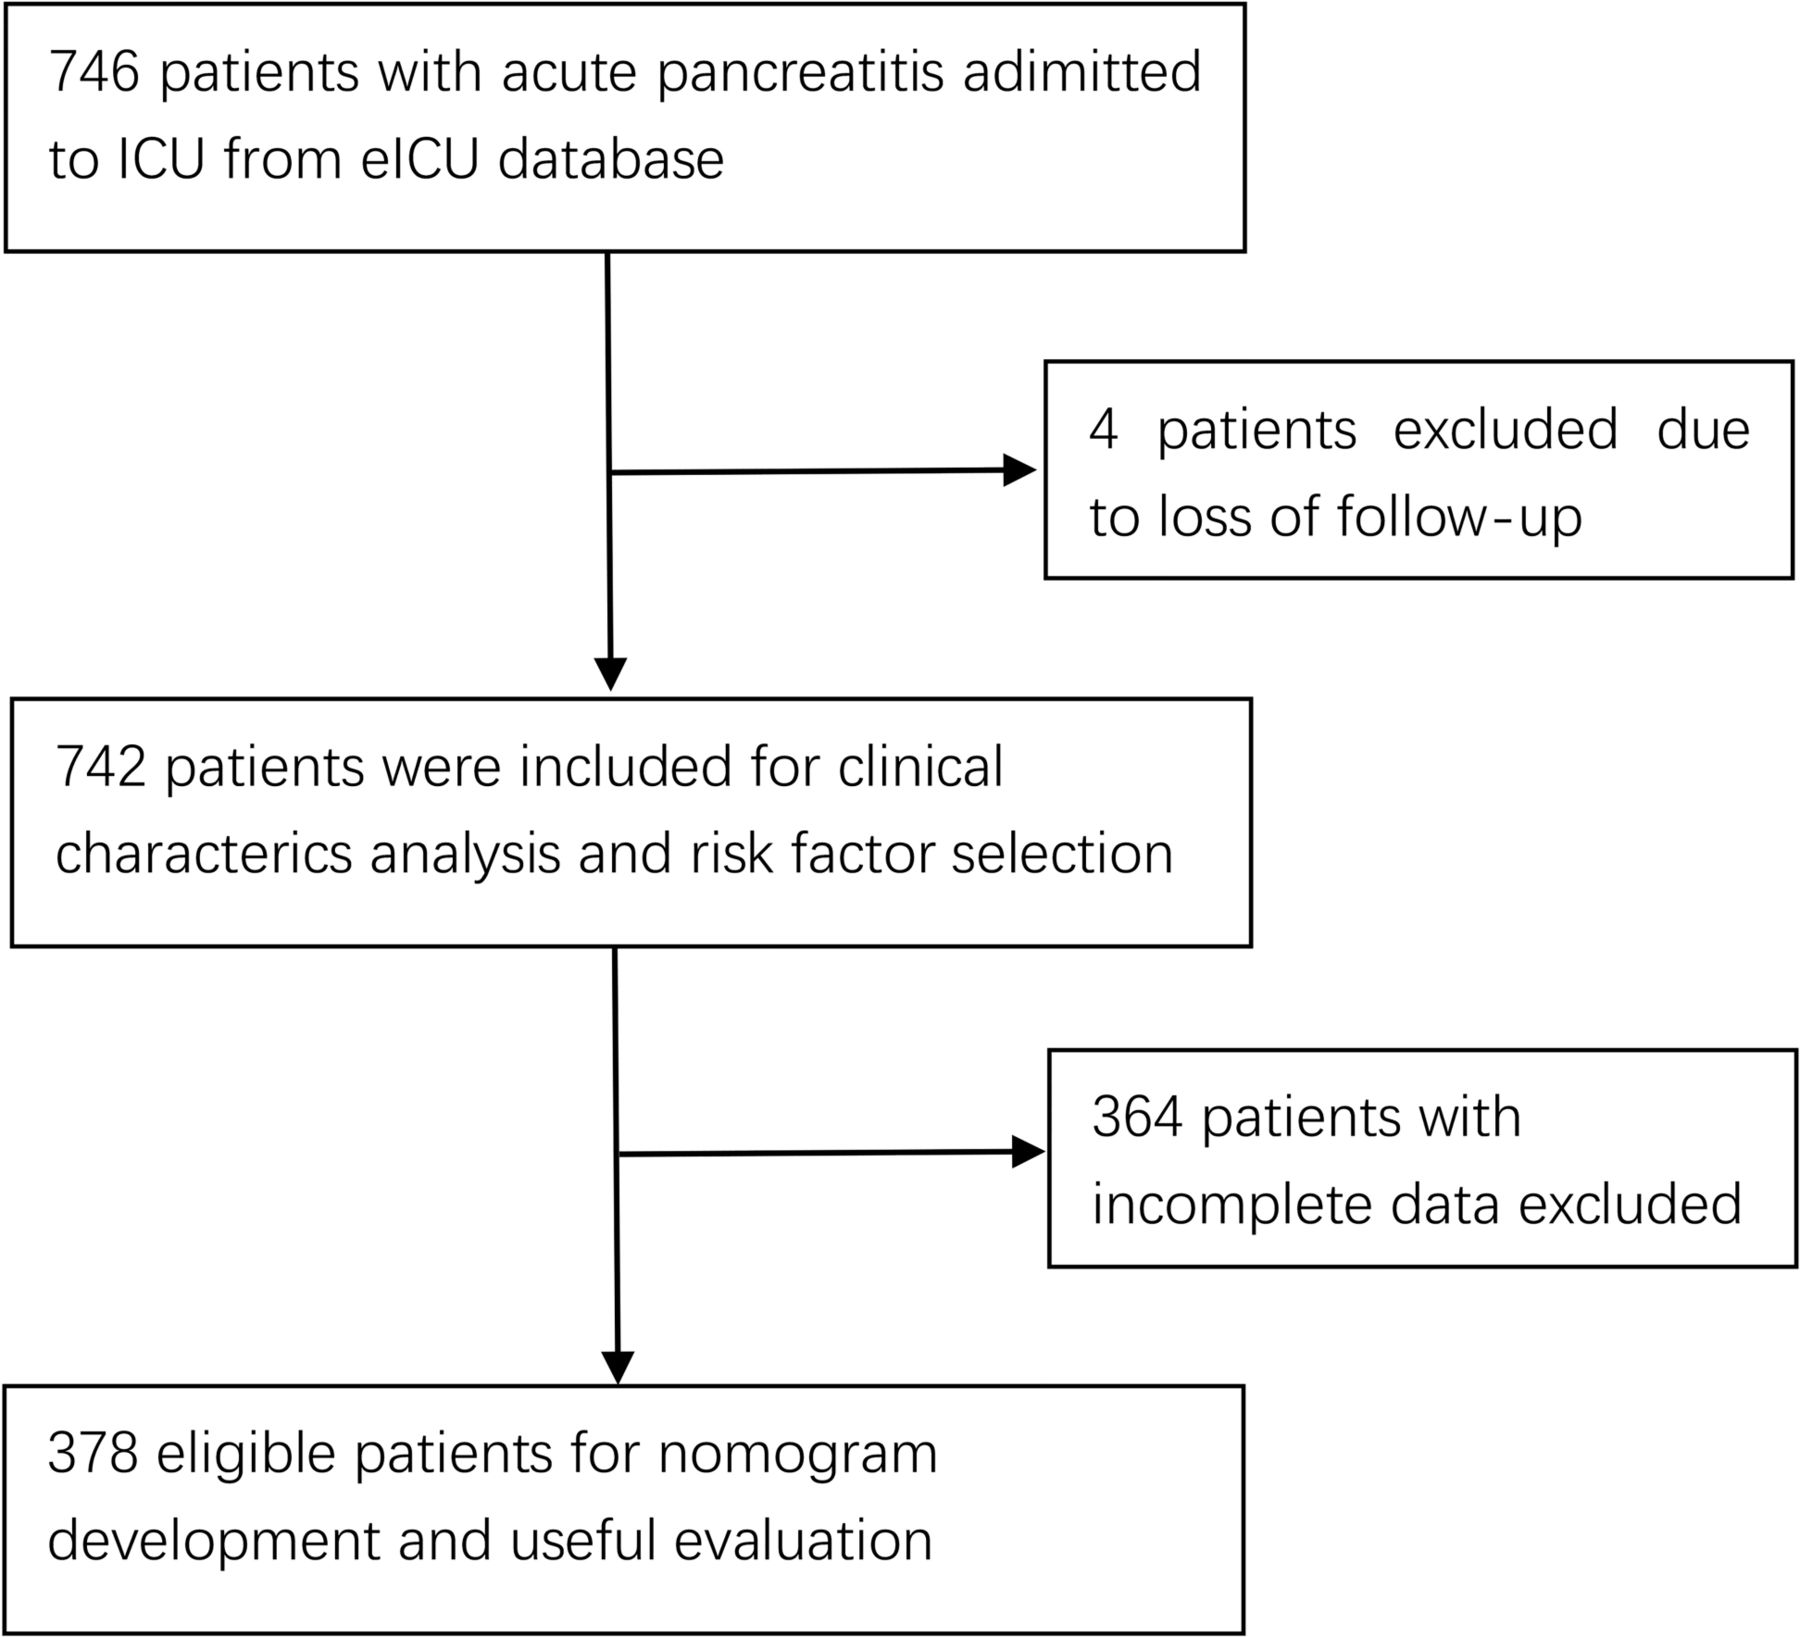
Participants A total of 746 patients with AP were drawn from eICU-CRD. Due to loss to follow-up (four patients) or incomplete data (364 patients), 378 patients were enrolled in the primary cohort to establish a nomogram model and to conduct internal validation.
Primary and secondary outcome measures The outcome of the prediction model was in-hospital mortality. All risk factors found significant in the univariate analysis were considered for multivariate analysis to adjust for confounding factors. Then a nomogram model was established. The performance of the nomogram model was evaluated by the concordance index (C-index) and the calibration plot. The nomogram model was internally validated using the bootstrap resampling method. The predictive accuracy of the nomogram model was compared with that of Acute Physiology, Age, and Chronic Health Evaluation (APACHE) IV. Decision curve analysis (DCA) was performed to evaluate and compare the potential net benefit using of different predictive models.
Results The overall in-hospital mortality rate is 4.447%. Age, BUN (blood urea nitrogen) and lactate (ABL) were the independent risk factors determined by multivariate analysis. The C-index of nomogram model ABL (0.896 (95% CI 0.825 to 0.967)) was similar to that of APACHE IV (p=0.086), showing a comparable discriminating power. Calibration plot demonstrated good agreement between the predicted and the actual in-hospital mortality. DCA showed that the nomogram model ABL was clinically useful.
Conclusions Nomogram model ABL, which used readily available data, exhibited high predictive value for predicting in-hospital mortality in AP.
- pancreatic disease
- adult intensive & critical care
- gastroenterology
This is an open access article distributed in accordance with the Creative Commons Attribution Non Commercial (CC BY-NC 4.0) license, which permits others to distribute, remix, adapt, build upon this work non-commercially, and license their derivative works on different terms, provided the original work is properly cited, appropriate credit is given, any changes made indicated, and the use is non-commercial. See: http://creativecommons.org/licenses/by-nc/4.0/.
Statistics from Altmetric.com
Strengths and limitations of this study
This is an original research to develop and internally validate a user-friendly prediction model using easily obtainable clinical and laboratory parameters.
The nomogram model ABL presents an excellent prognostic ability for predicting in-hospital mortality in patients with acute pancreatitis (AP).
The retrospective observational cohort study design could lead to certain types of bias (eg, confounding bias, selection bias).
The suitability of the model in larger population needs further external validation due to the small sample size and small number of events.
Background
Acute pancreatitis (AP) is a relatively common, but poorly understood, inflammatory disease of the exocrine pancreas. So far, the detailed pathogenesis of AP still remains unclear, and no specific and effective treatment has been proposed yet.1 The clinical manifestation and disease course of AP also vary dramatically from self-limiting simple oedema pancreatitis to severe acute necrotising pancreatitis characterised by systemic inflammatory response syndrome and multiple organ failure.2 With a mortality rate of less than 5%, the mild oedematous AP runs a benign course and recovers spontaneously without any sequelae in about 70%–80% of patients, while nearly 20%–30% of patients will develop severe necrotic pancreatitis with a high mortality rate up to 20%–30%.3–9
Two peaks of mortality have been noted in patients with severe AP. Early death usually occurs in the first 2 weeks owing to multiple organ dysfunction syndromes (MODS) caused by the production and release of diverse cytokines.9–11 Late death generally happens 2 weeks later as a result of peripancreatic necrosis, infection and secondary MODS.9 10 Studies found that patients in the high-risk group may benefit from closer monitoring, early aggressive fluid resuscitation, rational use of antibiotics and timely invasive strategies, such as endoscopic sphincterotomy and radiologic intervention.12 13 Once diagnosed as AP, early identification of high-risk patients is therefore essential to improve survival.
Since the first scoring system for AP severity was proposed in 1974, about 20 different predictive models have been developed.14 However, there are some practical problems that restrict wide clinical application of these predictive models. For instance, based on more than 10 parameters, Acute Physiology, Age, and Chronic Health Evaluation (APACHE) II is cumbersome and complex for rapid assessment within 24 hours after admission.15 16 Moreover, APACHE II is a generic scoring system for all critical patients, so some parameters may be irrelevant to the prognosis of AP.17 Developed as an easy-to-use risk stratification tool, the bedside index for severity in acute pancreatitis (BISAP) score outperforms other predictive models in specificity, but shows a suboptimal sensitivity in evaluating the severity of AP.18 19 Despite its high sensitivity, RANSON score is less operative because it takes at least 48 hours to be completed, resulting in a delay of triage and management.16 20 The CT severity index (CTSI) requires high-cost and radioactive CT scans, which might be unavailable for most patients at their first visit.16 21 In addition, pancreatic necrosis might be undetectable by an early CT scan within 24 hours.22 Even in the first 3–4 days, contrast-enhanced CT scan seems unreliable in estimating the extent of pancreatic necrosis.22 23
In view of the shortcomings of these currently available predictive models, there is consequently an urgent need for an easy-to-use and accurate prognostic tool for predicting in-hospital mortality in patients with AP. Therefore, we collected demographics, clinical factors, laboratory data from a freely available, multicentre database eICU-CRD and explored the risk factor for in-hospital mortality. Furthermore, we incorporated these independent prognostic factors and developed a nomogram model in patients with AP for better clinical guidance.
Patients and methods
Study design
We extracted subject data from eICU-CRD, a large multicentre critical care database. The database is publicly and freely accessible to researchers, according to data usage agreement by the review board of PhysioNet (our record ID: 33047414). The eICU-CRD covers 200 859 ICU admissions of 139 367 patients in 208 US hospitals between 2014 and 2015. All data were stored automatically and retrieved electronically through the Philips Healthcare eICU programme. It includes records of demographics, physiological indices from bedside monitors, diagnosis via International Classification of Diseases, 9th Edition, Clinical Modification (ICD-9-CM) codes, and other laboratory data obtained during routine medical care. All data were deidentified by the eICU programme and anonymous to researchers before analysis.24 As this research was a retrospective observational cohort study based on data from eICU-CRD, no ethical approval was required from our local ethics committee. This study was reported following the recommendations of the Transparent Reporting of a multivariable prediction model for Individual Prognosis or Diagnosis (TRIPOD) statement.25
Participants
The study population was drawn from eICU-CRD. According to the 2012 Atlanta Criteria, the diagnosis of AP can be made if two or more of the following criteria are present: (1) abdominal pain (acute and persistent epigastric pain usually radiating to the back); (2) serum amylase or lipase level being at least three times greater than the normal upper limit; (3) characteristic abdominal imaging findings of AP.26 The ICD-9-CM diagnostic code used for selecting patients with AP is 577.0.
Data retrieval
All subject data within the first 24 hours after admission were collected from eICU-CRD using the Structure Query Language. The physiological variables, including body temperature (BT), heart rate (HR), mean blood pressure (MBP) and respiratory rate (RR), were obtained from the table apacheApsVar. The baseline characteristics such as age, gender, weight, height, APACHE IV, Glasgow Coma Scale (GCS) score and the history of past illnesses were collected from the tables of patient, apachePatientResult and pastHistory. The laboratory indices, for instance, serum albumin, lactate, base excess (BE), total bilirubin, glucose, blood urea nitrogen (BUN), white cell count (WCC), haematocrit, platelet (PLT), calcium, lactic dehydrogenase (LDH), aspartate aminotransferase (AST), cholesterol, triglycerides, amylase, lipase and arterial oxygen pressure (PaO2) were extracted from the table lab.
Potential risk factors associated with in-hospital mortality were identified from previous predictive models,16 27 from literature or guidelines,7 14 28 29 and from consulting clinic medical experts. The decisions of their inclusion in the univariate logistic regression analysis were based on the following criteria that the potential risk factors: (1) were objective parameters, (2) were routinely measured in medical practice and (3) were completely recorded or missing randomly in the dataset. The worst value of each variable recorded during the first 24 hours after admission was used to analyse and establish the nomogram model.
Statistical analysis
Continuous variables, expressed as mean with SD or median with IQR, were analysed using the Student’s t-test (for data with normal distribution) or Mann-Whitney U test (for data without normal distribution). Categorical variables, expressed as absolute numbers (n) and proportions (%), were compared using the χ2 test or Fisher’s exact test. Univariate logistic regression analysis was performed to determine the possible correlation between in-hospital mortality and potential risk factors. All significant risk factors (p<0.1) in the univariate logistic regression analysis were eligible for inclusion in the multivariate logistic regression analysis to adjust for confounding factors. Based on the results of the multivariate logistic regression analysis, a nomogram was constructed. The performance of the nomogram model was assessed using its calibration and discrimination. Calibration describes the level of agreement between predicted and actual risks, and is usually evaluated by calibration plot and Hosmer-Lemeshow χ2 test.30 Discrimination refers to the ability of a model to distinguish high-risk and low-risk patients, and is generally evaluated by C-index or area under the receiver operator characteristic curve (AUROC).31 In order to address overfitting and quantify optimism, the predictive model was internally validated using bootstrap resampling. Optimism represents the difference between the apparent (unadjusted) model performance and bootstrap (bias) corrected estimated model performance. Internal validation involved refitting the model to a series of 1000 random samples drawn from the original dataset with replacement, and produced an overall C-index from all samples. This process adjusted the C-index for overoptimism which may arise when a model was validated with the same dataset used to build the model.32 Decision curve analysis (DCA) was performed to evaluate the clinical usefulness of the nomogram model by quantifying the net benefits under different threshold probabilities.
For all analyses, p value less than 0.05 was considered to be statistically significant. All statistical analyses were carried out on GraphPad Prism V.7 (GraphPad Prism, GraphPad Software, La Jolla, California, USA) and R V.3.6.1 (R Development Core Team). The packages of rms, Hmisc, pROC, stats, PredictABEL and rmda were involved in this process.
Results
Baseline characteristics and outcomes
A total of 746 patients with AP were extracted from the database, of whom 4 patients were excluded due to loss to follow-up, thus resulting in 742 evaluable patients included in our study. Thirty-three patients died during hospitalisation with in-hospital mortality rate of 4.447%. The demographic and clinical characteristics of all patients are listed in table 1.
Characteristics and outcomes of participants
Prognostic factors for in-hospital mortality
Univariate logistic regression analysis was performed for each potential risk factor. Age, GCS score, MBP, albumin, lactate, bilirubin, BUN, WCC, calcium, AST and comorbidities of chronic heart failure (CHF), COPD, hypertension were risk factors for in-hospital mortality determined by univariate logistic regression analysis (p<0.1). Thereafter, all these risk factors were entered simultaneously into the multivariable logistic regression analysis to control possible confounding factors. Finally, age, BUN and lactate (ABL) were proved to be independent risk factors for predicting in-hospital mortality (table 2). Due to incomplete data, 364 patients were excluded, leaving 378 evaluable patients included in the nomogram model ABL. The flow chart of the inclusion of eligible patients is shown in figure 1. The characteristic features of patients included and excluded from the development of the nomogram are demonstated in online supplemental table S. The diagnostic equation built on multivariate logistic regression analysis is as follows:
Supplemental material
Logit P=−10.3074 + 0.0831*Age +0.4032*Lactate +0.0201*BUN

Flow chart of patient selection. ICU, intensive care unit.
Univariate and multivariate logistic regression analysis with stepwise variable selection
Development of a nomogram predicting in-hospital mortality
Based on the multivariate logistic regression analysis, a nomogram was constructed by assigning a weighted point to each independent risk factor on the point scale (figure 2). A higher total point of all risk factors refers to a higher in-hospital mortality rate.

Nomogram for predicting in-hospital mortality in AP. To obtain nomogram predicted in-hospital mortality, locate the value of each independent risk factor at each axis, draw a vertical line to the ‘‘Point’’ axis to get the point for each risk factor, then sum all the points, locate the sum on the ‘‘Total Points’’ axis to get the predicted probability on ‘’Predicted in-hospital mortality’’ axis. AP, acute pancreatitis; BUN, blood urea nitrogen.
Performance of the nomogram model ABL
The discrimination and calibration, two basic characteristics of model validation, were tested to evaluate the performance of the nomogram model ABL.33 Model discrimination was assessed using the C-index that measures the ability to predict the outcomes. A higher C-index refers to a greater ability to discriminate the outcomes. The C-index of our nomogram model ABL was 0.896 (95% CI 0.825 to 0.967), showing a great discrimination ability. The receiver operating characteristic (ROC) curves of age, lactate, BUN and the nomogram model ABL for predicting in-hospital mortality were shown in figure 3A. By visual inspection of AUROC, nomogram model ABL showed better performance than any other individual risk factor. Model calibration was evaluated using the Hosmer-Lemeshow χ2 test and a calibration plot. The Hosmer-Lemeshow χ2 which measured the calibration was 7.201 (p=0.515), demonstrating that there was no significant difference from a perfect fit. The calibration plot was shown in figure 3B. Visual inspection of the calibration plot further indicated good agreement between the predicted and actual in-hospital mortality.

(A) ROC curves for the nomogram model ABL and individual risk factors for predicting in-hospital mortality. AUROC represents the discrimination ability of a predictive model. (B) Calibration plot comparing the actual and predicted in-hospital mortality. The x-axis indicates the deciles of predicted in-hospital mortality. Each bar in the graph stands for the actual and predicted in-hospital mortality. ROC, receiver operating characteristic; AUROC, area under the receiver operator characteristic curve.
Validation of the nomogram model ABL
The bootstrapping technique was employed to internally validate model performance.32 During internal validation (set seed 123), nomogram model ABL retained its excellent discrimination in the bootstrap samples, showing an optimism corrected C-index of 0.892 (95% CI 0.822 to 0.962). The calibration curve was used to assess the ability of a predictive model to obtain unbiased estimates of the outcome, and a perfectly calibrated predictive model would produce a curve on which the predicted and actual probabilities fall along a 45-degree diagonal line.34 The calibration curve of nomogram model ABL was very close to the 45-degree ideal line, showing good agreement between the predicted and actual in-hospital mortality (figure 4).

Calibration curve of nomogram model ABL. The x-axis represents the predicted in-hospital mortality calculated according to the model, while the y-axis exhibits the actual in-hospital mortality. The vertical lines show the frequency distribution of the predicted in-hospital mortality. The apparent calibration curve (dotted line) indicates the model performance in the original data, while the bias-corrected curve (solid line) represents the model performance after correction for optimism using 1000 bootstrapped resamples. Perfect prediction would fall on the 45-degree (dashed) reference line.
Comparison of predictive accuracy for in-hospital mortality between the nomogram model ABL and APACHE IV
Complete age, BUN, lactate and APACHE IV data were available for 334 patients, of whom 21 patients died in the hospital. The median APACHE IV was 50 in the survival group and 91 in the death group. The C-index was calculated to estimate the discrimination ability of APACHE IV (0.837 (95% CI 0.730 to 0.944)). There was no statistically significant difference between the C-index of the nomogram model ABL and that of APACHE IV (p=0.086), indicating the nomogram model ABL had a similar predictive accuracy with APACHE IV. The ROC curves for the nomogram model ABL and APACHE IV also demonstrated comparable discriminating power (figure 5A).

(A) ROC curves for the nomogram model ABL and APACHE IV. Visual comparison of ROC curves indicates the discrimination performance of the nomogram model ABL was comparable to that of APACHE IV. (B) Decision curve analysis for the nomogram model ABL and the APACHE IV. The y-axis measures the net benefit, and the x-axis shows the threshold probability. The horizontal black line along the x-axis represents the assumption that no patient will die in the hospital (ie, no patient should undergo close monitoring and aggressive treatment), whereas the solid grey line represents the assumption that all patients will die in the hospital (ie, all patients should undergo close monitoring and aggressive treatment). The red line indicates the nomogram model ABL and the blue line represents the APACHE IV. APACHE, Acute Physiology, Age, and Chronic Health Evaluation; ROC, receiver operating characteristic.
The integrated discrimination improvement index (IDI) is a method to quantify the incremental predictive value of new methods to existing predictive models.35 In this study, IDI was calculated to assess the improvement in risk stratification using different models. The IDI was 0.105 (95% CI −0.016 to 0.226), indicating no significant difference (p=0.088) in performance between the nomogram model ABL and APACHE IV.
The DCA can depict the overall net benefit of using predictive models compared with the treat-all-patients and treat-none scheme. Figure 5B shows the net benefit of using the nomogram model ABL and APACHE IV, with several overlaps, the net benefit of the nomogram model ABL was comparable to that of APACHE IV.
Discussion
AP is a heterogeneous digestive system disease. Most patients with AP will relieve spontaneously without any organ failure, while about 20% of cases will evolve into severe form, which is associated with MODS, sepsis and high mortality.6 Thus, it is imperative to identify patients who might develop severe AP and initiate more aggressive intervention.26 Through early identification and reasonable treatment, patients at high risk of mortality might be converted to low risk, which is the main goal of our model development.
Using demographic, clinical and conventional laboratory data from a large-scale publicly available ICU database, the following independent risk factors for predicting in-hospital mortality of AP were identified: age, BUN and lactate (ABL). These factors are consistent with the risk factors traditionally associated with in-hospital mortality. Except for age, other risk factors are modifiable by timely and aggressive treatment, which is particularly important for improving outcomes. Nomograms could provide predictive information tailored to the individual, by establishing a simple graphical representation of a complex statistical prediction model.34 Currently, nomograms are increasingly being used to improve clinical decision-making. In this study, we incorporated age, BUN and lactate into an easy-to-use and reliable nomogram model ABL. Our predictive model also generates an equation on a continuous scale rather than an arbitrary ‘cut-off’ for each parameter. The outstanding advantage of the nomogram model ABL is its simplicity and accuracy. There are only three parameters in the current model, which requires no extra calculations and is convenient for clinicians. In addition, all these parameters are objective and can be easily obtained following a general hospital admission. We calculated the C-index to quantify the discriminatory power of our model. A C-index of 1 represents perfect prediction accuracy, whereas a C-index of 0.5 indicates no better than random guesses. With a C-index of 0.896, the nomogram model ABL exhibited perfect model discrimination performance. The ROC curve also showed that the nomogram model ABL provide great model prediction accuracy. Internal validation via bootstrap resamples demonstrated an adjusted C-index of 0.892, which was in excellent agreement with the original data. Moreover, the calibration curve indicated a sufficient fit of predicted and actual in-hospital mortality. This user-friendly nomogram model ABL might be a valuable tool for clinical practice because it could provide a simple and accurate way to predict in-hospital mortality in patients with AP.
As is well known to all, age is an important and useful indicator of poor prognosis in various entities. Furthermore, many acknowledged predictive models have incorporated age for predicting the severity or mortality of AP in the field of clinical medicine.7 14 Our study also demonstrates that age is an independent risk factor for in-hospital mortality in patients with AP. With age incremented by 10 years, the risk for in-hospital mortality was increased by 6.776% in our study.
In this study, we found that hyperlactataemia (≥2 mmol/L) is very common in AP (50.131%). Lactate, a by-product of glycolysis under anaerobic conditions, is generally considered as a powerful indicator of ischaemia and hypoxia in body tissues. However, diseases with elevated plasma catecholamine, such as huge trauma or shock, can also lead to exaggerated glycolysis and increased lactate level.36–38 Hyperlactataemia in AP might be related to the above factors. Single plasma lactate level, especially that measured immediately after admission to the ICU or arrival at the emergency room, is regarded as a powerful predictor of subsequent multiorgan failure and mortality. In 1965, Peretz et al39 first described the relationship between plasma lactate level and mortality and revealed a death rate of 100% when the plasma lactate level is higher than 13.3 mmol/L. More recently, Nichol et al40 and Haas et al41 also found that the mortality rate of patients with a plasma lactate level greater than 10 mmol/L was up to 80%. Recent studies demonstrated that early lactate clearance and continuous dynamic monitoring of the plasma lactate level could serve as a useful prognostic factor and guide timely intervention of critically ill patients.41–46 In 2017, Valverde-López et al47 reported that elevated plasma lactate level was closely related to persistent multiorgan failure of patients with AP, lactate might become a useful biomarker for predicting poor clinical outcomes of AP on admission, especially for the prediction of mortality, lactate exhibited an excellent AUROC of 0.870. Moreover, lactate performed much better than C-reactive protein (CRP) in predicting ICU requirements and mortality.47 Our research demonstrated that the lactate level was strongly associated with in-hospital mortality of AP, with a great AUROC of 0.776. By multivariate logistic regression analysis, lactate has been proven to be an independent risk factor for predicting in-hospital mortality, which is consistent with previous studies.47
BUN as a useful predictor of in-hospital mortality is consistent with the current existing literature. Previous studies have shown that BUN on admission and BUN rise in the first 24 hours after admission can predict mortality of patients with AP.29 48–51 Many studies believe that increased BUN in AP is due to the loss of body fluid, the decrease of intravascular blood volume and the development of prerenal azotemia.48 50 If the hypovolaemic state cannot be corrected completely at early stage, the patients will suffer from further depletion of effective circulatory blood volume, from severe decrease in glomerular filtration fraction and eventually leading to prerenal insufficiency. If the disease progresses further, it may lead to multiple organ and system failure, which is the main cause of death.10 28 Therefore, many scoring systems used in clinical practice are based on the urea level (Ranson, Glasgow, POP, BISAP).7 52–54 The Hong Kong criterion is based on only two parameters: urea and glycaemia.55
In order to further evaluate the value of nomogram model ABL in clinical use, we compared its performance with the APACHE scoring system. APACHE II is one of the most powerful and widely used prognostic tool for all ICU patients to predict severity and mortality. Later this scoring system was extrapolated to AP, the study results showing perfect prognostic value.15 56 The APACHE II had been modified many times since its launch in 1985, and the latest version was the APACHE IV published in 2006.57 58 Involving about 52 different physiologic indices, APACHE IV accounts for hepatobiliary parameters, sedation status and multiple comorbidities simultaneously. Due to such wide range of physiologic variables, APACHE IV has a much better performance compared with APACHE II.59 60 In 2015, a study reported that an APACHE IV of 44 or higher would predict mortality in 100% of cases, and the AUROC for APACHE IV was 0.93.61 However, the main drawback of APACHE IV is that it relies on many variables that are not routinely collected during general hospital admission.7 Nevertheless, our nomogram model ABL could attain a comparable predictive accuracy of the more complex APACHE IV with fewer parameters in patients with AP.
An ideal predictive model should be reliable and easy-to-use at the early stage of the disease, using readily available data.62 The nomogram model ABL achieves many of these characteristics: it is generated from data within 24 hours after admission, using age and some easily obtainable, reliable and inexpensive clinical and laboratory parameters in a model, and is feasible in a user-friendly manner. Moreover, the nomogram model ABL presents an excellent prognostic ability for in-hospital mortality, which is comparable with that of APACHE IV.
Our study still has some limitations. First, this study included patients with AP from one database due to the small sample size and small number of events, the statistical power of this study was limited, which may caution us from generalising this nomogram model ABL to a larger population. And thus, further large-scale prospective trials are needed to verify the prognostic model. Second, although we tried to adjust confounding factors as much as possible by performing multivariate logistic regression analysis, residual confounding factors through unknown or unmeasured covariates might not be completely ruled out. Finally, the database that we used did not cover information on aetiology, initial or recurrent episodes of pancreatitis, duration of the disease, which might affect in-hospital mortality.
Conclusion
We propose a refined nomogram model ABL with age, easily obtainable clinical and biochemical parameters, the BUN and lactate. This nomogram model ABL shows excellent performance and allows clinical practitioners to perform early and quick risk-stratification and guide early management strategies for patients with AP.
References
Supplementary materials
Supplementary Data
This web only file has been produced by the BMJ Publishing Group from an electronic file supplied by the author(s) and has not been edited for content.
Footnotes
Contributors CL conceived the idea, extracted the data, performed the analysis and drafted the manuscript. GW and ZW helped to frame the idea of the study, interpret the results and revise the manuscript. QR helped to edit pictures and revised the manuscript. All authors read and approved the final manuscript.
Funding The authors have not declared a specific grant for this research from any funding agency in the public, commercial or not-for-profit sectors.
Competing interests None declared.
Patient consent for publication Not required.
Provenance and peer review Not commissioned; externally peer reviewed.
Data availability statement The data are available on the eICU-CRD website at https://eicu-crd.mit.edu/https://eicu-crd.mit.edu/.
Supplemental material This content has been supplied by the author(s). It has not been vetted by BMJ Publishing Group Limited (BMJ) and may not have been peer-reviewed. Any opinions or recommendations discussed are solely those of the author(s) and are not endorsed by BMJ. BMJ disclaims all liability and responsibility arising from any reliance placed on the content. Where the content includes any translated material, BMJ does not warrant the accuracy and reliability of the translations (including but not limited to local regulations, clinical guidelines, terminology, drug names and drug dosages), and is not responsible for any error and/or omissions arising from translation and adaptation or otherwise.