Article Text

Abstract
Objectives To identify the diagnostic accuracy of common imaging modalities, chest X-ray (CXR) and CT, for diagnosis of COVID-19 in the general emergency population in the UK and to find the association between imaging features and outcomes in these patients.
Design Retrospective analysis of electronic patient records.
Setting Tertiary academic health science centre and designated centre for high consequence infectious diseases in London, UK.
Participants 1198 patients who attended the emergency department with paired reverse transcriptase PCR (RT-PCR) swabs for SARS-CoV-2 and CXR between 16 March and 16 April 2020.
Main outcome measures Sensitivity and specificity of CXR and CT for diagnosis of COVID-19 using the British Society of Thoracic Imaging reporting templates. Reference standard was any RT-PCR positive naso-oropharyngeal swab within 30 days of attendance. ORs of CXR in association with vital signs, laboratory values and 30-day outcomes were calculated.
Results Sensitivity and specificity of CXR for COVID-19 diagnosis were 0.56 (95% CI 0.51 to 0.60) and 0.60 (95% CI 0.54 to 0.65), respectively. For CT scans, these were 0.85 (95% CI 0.79 to 0.90) and 0.50 (95% CI 0.41 to 0.60), respectively. This gave a statistically significant mean increase in sensitivity with CT of 29% (95% CI 19% to 38%, p<0.0001) compared with CXR. Specificity was not significantly different between the two modalities.
CXR findings were not statistically significantly or clinically meaningfully associated with vital signs, laboratory parameters or 30-day outcomes.
Conclusions Computed tomography has substantially improved diagnostic performance over CXR in COVID-19. CT should be considered in the initial assessment for suspected COVID-19 instead of CXR if capacity allows and balanced against radiation exposure risk.
- COVID-19
- Chest imaging
- accident & emergency medicine
- general medicine (see Internal Medicine)
- diagnostic radiology
This is an open access article distributed in accordance with the Creative Commons Attribution Non Commercial (CC BY-NC 4.0) license, which permits others to distribute, remix, adapt, build upon this work non-commercially, and license their derivative works on different terms, provided the original work is properly cited, appropriate credit is given, any changes made indicated, and the use is non-commercial. See: http://creativecommons.org/licenses/by-nc/4.0/.
Statistics from Altmetric.com
- COVID-19
- Chest imaging
- accident & emergency medicine
- general medicine (see Internal Medicine)
- diagnostic radiology
Strengths and limitations of this study
Large, appropriately powered, study population consisting of all patients attending the emergency department rather than those solely with confirmed COVID-19; this allowed assessment of specificity for the imaging modalities and applicability to the general population who may attend medical personnel with other complaints, but have underlying SARS-CoV-2 infection.
Comprehensive statistical analyses were conducted to address confounding in reporting of X-rays including propensity score matching and logistic regression to give a ‘doubly robust’ model.
Low amount of missing data and for secondary covariates only; multiple imputation was performed with a good fit, however, observed data would be preferable to imputed data.
Single centre, retrospective study; potential for inter-reporter and intercentre variability in reporting.
Large proportion of patients excluded due to not having a reverse transcriptase PCR swab, predominantly, those with imaging reported as negative; this may bias the results towards increased sensitivity and specificity.
Introduction
SARS-CoV-2 and its resulting disease, COVID-19, have propagated exponentially worldwide, with over 10 million cases in 188 countries at the time of writing.1 2
The gold standard for diagnosis of the virus is the detection of viral RNA through reverse transcriptase PCR (RT-PCR) of respiratory tract samples. However, this method has several limitations including (1) low sensitivity at 59%–71%;3 4 (2) relatively slow turnaround times ranging from a few hours to several days;5 (3) high expense; and (4) limited capacity for testing in many countries.
CT has been shown to be more sensitive than RT-PCR for diagnosis of COVID-19,3 4 while being significantly faster and cheaper. This comes with a large radiation dose and capacity is still lacking in many countries.
Plain film chest X-ray (CXR) is ubiquitous worldwide, with a 30–70 times lower dose of radiation6 and is commonly performed as an initial investigation in COVID-19.
Studies have so far only evaluated imaging in those with confirmed infection; it is, therefore, not possible to calculate the specificity of these modalities. In the context of the global pandemic, infection may be widespread in the community, often with subclinical infection.7 8 A reliable and rapid method to detect infection in the general population, who may present to medical personnel with other complaints, is needed.
Despite its extensive use, the specificity and sensitivity of CXR in the general emergency population for diagnosis of COVID-19 is unknown, nor how imaging features correlate with severity.
This study evaluated the performance of CXR in diagnosing COVID-19 in the emergency department (ED) of a tertiary care hospital.
Methods
This study was conducted at the Royal Free Hospital, London, UK, an academic health science centre and nationally designated centre for high consequence infectious diseases.9
All individuals attending the ED who had paired posterior–anterior chest radiographs and RT-PCR nasopharyngeal swabs for COVID-19 at the time of initial attendance between 16 March 2020 and 16 April 2020 were included.
All chest radiographs were reported by a consultant radiologist and rated on an ordinal scale for probability of COVID-19: alternative pathology identified, not COVID-19; clear chest, unlikely COVID-19; indeterminate findings for COVID-19; classical findings of COVID-19, based on the British Society of Thoracic Imaging’s (BSTI) reporting templates (table 1).10 These were reported prior to RT-PCR results being available.
Ordinal scale used in this study based on the British Society of Thoracic Imaging (BSTI) reporting template10

RT-PCR of swabs were performed in laboratories either at our centre or at a public health laboratory (PHE Collindale, UK), according to published national standard operating procedures .11 Subsequent RT-PCR swabs taken within 30 days of initial ED attendance were also included.
CT scans performed within 30 days of attendance were retrieved. These were also reported according to the BSTI template. CT pulmonary angiogram was performed in the ED if the D-dimer was >5000 to exclude pulmonary emboli (PE) as per the locally agreed protocol. Subsequent CT chest imaging (whether pulmonary angiogram, contrast or non-contrast) was performed on the basis of clinical suspicion.
Prospectively recorded data were extracted from the Cerner Millennium electronic patient record system (Cerner, Kansas City, Missouri, USA).
Primary outcome
The primary outcome is sensitivity and specificity of initial CXR, where it is reported as having classic COVID-19 features in the ED. This is compared with RT-PCR swab as the reference standard for diagnosis of COVID-19.
In the event of multiple RT-PCR swabs during one attendance, a single positive swab was taken as an overall positive test during one admission.
Secondary outcomes
In those patients who also had CT scans of the thorax, the diagnostic accuracy was compared with CXR, with RT-PCR again as the reference standard. Sensitivity and specificity of CXR when X-rays reported as indeterminate or atypical for COVID-19 were classed as positive was also calculated.
CXR findings were correlated with vital signs at attendance and blood results, including neutrophil counts, D-dimer and C reactive protein, which have been associated with poor prognosis in COVID-19.12 HRs for clinical outcomes including direct admission to the intensive treatment unit (ITU) from ED and 30-day mortality rates were also calculated for CXR reporting categories.
Statistical analysis
In the event of missing data, multiple imputation was conducted using a Predictive Mean Matching algorithm, via the MICE R package, as described previously.13 Briefly, this uses a linear regression model (or logistic regression model for categorical data) to find a random value based on already observed data, to replace missing fields.14 Variables without missing data fields were not modified. The number of imputed datasets was similar in number to the percentage of missing data, as suggested by White and colleagues.15 Balance diagnostics with density plots are available in online supplemental file 1, adequate balance was assessed via visual inspection of imputed distributions with respect to the original dataset.
Supplemental material
The propensity for a CXR being reported as positive or negative for COVID-19 was calculated for several plausible covariates that may influence image characteristics such as age, gender, ethnicity, pre-existing morbidities and the respiratory rate of the patient using a generalised linear model.16 X-ray positive and negative groups were then matched in each imputed dataset using the nearest neighbour algorithm, with a calliper of 0.2 of the propensity score SD, without replacement and in random sequential order to obtain a 1:1 match as described elsewhere.17
The balance of the match data was assessed quantitatively with mean differences of covariates in each of the X-ray groups before and after matching, with a difference of less than 0.1% considered a good match (online supplementary figures 1 and 2). Visual inspection of matches was also conducted to ensure balance (online supplementary figure 2-4).
After matching, outcome data were adjusted for covariates including age, gender, ethnicity and presence of comorbidities, as well as C reactive protein, D-dimer, troponin and vital signs. This was achieved by generalised linear regression for continuous outcome data, binomial logistic regression for binary categorical outcomes or ordinal logistic regression in the case of CXR where it is the outcome variable.
These regression models were run on each imputed dataset and outcomes were pooled together across each imputed dataset according to Rubin’s rules18 to give an overall estimate.
Diagnostic accuracy statistics
CXRs reported as classical for COVID-19 as per the BSTI guidelines were considered a positive test in the primary analysis. In a secondary analysis, X-rays reported as ‘Indeterminate’ or ‘Atypical’ for COVID-19 were also considered positive. All other reports were classified as a negative test. These were compared with nasopharyngeal aspirate RT-PCR results, which were taken as the gold standard for diagnosis of COVID-19. Where more than one swab was taken during the study period (up to 30 days after initial attendance), a single positive result was taken as a positive result for calculation of diagnostic accuracy statistics.
Sensitivity, specificity, predictive values and diagnostic accuracy were calculated using the propensity-matched data after imputation and pooled across imputed datasets with 95% CIs. Apparent and true prevalence based on this dataset are also given for interpretation of the predictive values.
Chest CTs were also reported according to the BSTI guidelines as with X-ray. Diagnostic statistics were calculated on raw, unmatched and non-imputed data (due to a low volume of data for imputation and matching) in the same manner as X-ray. Mean differences and 95% CIs between CT and X-ray for each of the diagnostic statistics are given, with a p value calculated from the CIs.
Agreement between the modalities was assessed on the unmatched dataset, in the sample where CT, CXR and RT-PCR were all available using Cohen’s (for two group agreement) and Fleiss’ kappa (when all three are compared).
Data presentation
Descriptive statistics are given as means and SD for normally distributed data and as medians and IQRs for non-normally distributed data, before and after matching and multiple imputation (for the latter, these statistics are pooled across imputations).
Association of explanatory variables with SARS-CoV-2 and CXR findings are given as ORs in univariate and multivariate configurations.
Data were considered statistically significant if p<0.05. Given the large number of analyses in this paper, data are separately highlighted if p<0.001 as a secondary threshold to address the potential for false positives with multiple testing.
Analyses were conducted using R V.4.0.0 (R Foundation for Statistical Computing, Vienna, Austria) and code for the analyses is given in online supplemental file 2.
Supplemental material
Sample size calculation
In this study, the lower CI for sensitivity of CXR as reported by Wong et al19 (56%) was used as an estimate of likely sensitivity for COVID-19 . A power of 80% at an alpha of 0.05 was used to calculate the sample size for sensitivity and specificity of 56%. This gave an estimated sample size of 165 in each of the COVID-19 negative and positive groups by RT-PCR (total of 330).
Reporting guidelines
This study is reported according to the STARD guidelines20 for diagnostic accuracy studies.
Patient and public involvement
Patients and the public were not involved in the design, conduct or dissemination of this study.
Results
A total of 1198 eligible patients with both CXR and RT-PCR were identified in the study period (figure 1). Their characteristics, stratified by positivity for SARS-CoV-2 infection by RT-PCR, are summarised in table 2. This showed that those with confirmed SARS-CoV-2 infection were more likely to be male, older (mean age 66.2 vs 62.7), have lower saturations, higher respiratory rates, while being more likely to be admitted and die within 30 days. There was a significant association with X-ray images and SARS-CoV-2 at baseline, with 59.6% having classic imaging features of COVID-19 in those with positive swabs versus 39.1% in those with negative swabs. There was 8.6% missing data overall in the dataset when variables with >50% missing data were removed and 15 imputations were performed on these remaining variables only.

Inclusion and exclusion of patients during study period with test results. RT-PCR, reverse transcriptase PCR.
Baseline characteristics of dataset stratified by overall SARS-CoV-2 RT-PCR status, including subsequent swabs during the study period
After multiple imputation for missing data and pooled propensity score matching for plausible covariates that may affect CXR reporting, there were 430 patients in each of the X-ray positive and X-ray negative groups, for a total of 860 patients. Adequate balance was achieved for relevant covariates with a mean difference of <0.1 between groups (online supplemental file 1, table 2).
CT was performed in 302 patients with paired RT-PCR during the same time period, with a median serial interval of 4.5 days (IQR 0–17) after the initial attendance in ED, and of these, 30.1% were within 1 day of attendance.
Diagnostic accuracy
The pooled sensitivity and specificity of CXR was 0.56 (95% CI 0.51 to 0.60) and 0.60 (95% CI 0.54 to 0.65), respectively (table 3). This gave an overall diagnostic accuracy of 0.57 (95% CI 0.54 to 0.61) for CXR.
Diagnostic accuracy metrics for CXR and CT chest with RT-PCR for SARS-CoV-2, as the reference standard
In comparison, sensitivity and specificity for CT was 0.85 (95% CI 0.79 to 0.90) and 0.50 (95% CI 0.41 to 0.60), respectively. This gave a statistically significant mean increase in sensitivity with CT compared with CXR by 29% (95% CI 19% to 38%, p<0.0001). Specificity was not significantly different between the two modalities. Diagnostic accuracy and negative predictive values were also significantly increased with CT at 0.15 and 0.22, respectively, while the negative likelihood ratio was significantly decreased at −0.44. This shows that the post-test odds of being negative for SARS-CoV-2 by RT-PCR with a negative CT is significantly lower.
Taking X-rays reported as indeterminate as positive increased the sensitivity of CXR to 0.80 (95% CI 0.77 to 0.84), however, specificity was reduced to 0.40 (95% CI 0.35 to 0.46). When CT scans reported as indeterminate are also considered positive, the sensitivity of CT increased to 0.93 (95% CI 0.89 to 0.96), while mean specificity reduced to 0.37 (95% CI 0.28 to 0.47), although this was not statistically different from when indeterminate CTs are considered negative. Sensitivity of CT remained significantly higher than CXR (when indeterminates are considered positive for both) by 0.13 (95% CI 0.05 to 0.19, p<0.001), but specificity was not significantly different between the two.
When comparing only the unimputed, unmatched subset of data where CT, RT-PCR and CXR were all performed (n=287), the agreement between CT and CXR was poor (Cohen’s kappa 0.406). Agreement between all three modalities was also poor (Fleiss’ kappa 0.361).
Association of CXR with markers of severity and outcomes
Association of covariates with RT-PCR results is shown in table 4 and figure 2. Those who tested positive for SARS-CoV-2 by RT-PCR were significantly more likely to have a classical X-ray (OR 1.79 95% CI 1.25 to 2.56, p<0.002) as would be expected by the diagnostic accuracy statistics (table 4). When the CXR report is considered as an ordered scale, worsening grades of report were associated more strongly with RT-PCR positivity, with a 1.94 times increase in odds for each grade.

Forest plot of ORs of variables associated with reverse transcriptase PCR positivity for SARS-CoV-2 following multiple imputation, propensity score matching and binomial logistic regression. *Significant difference at the <0.05 level; **significant difference at the <0.001 level. ED, emergency department; ITU, intensive treatment unit.
Association of covariates with RT-PCR status for SARS-CoV-2, following propensity score matching and binomial logistic regression
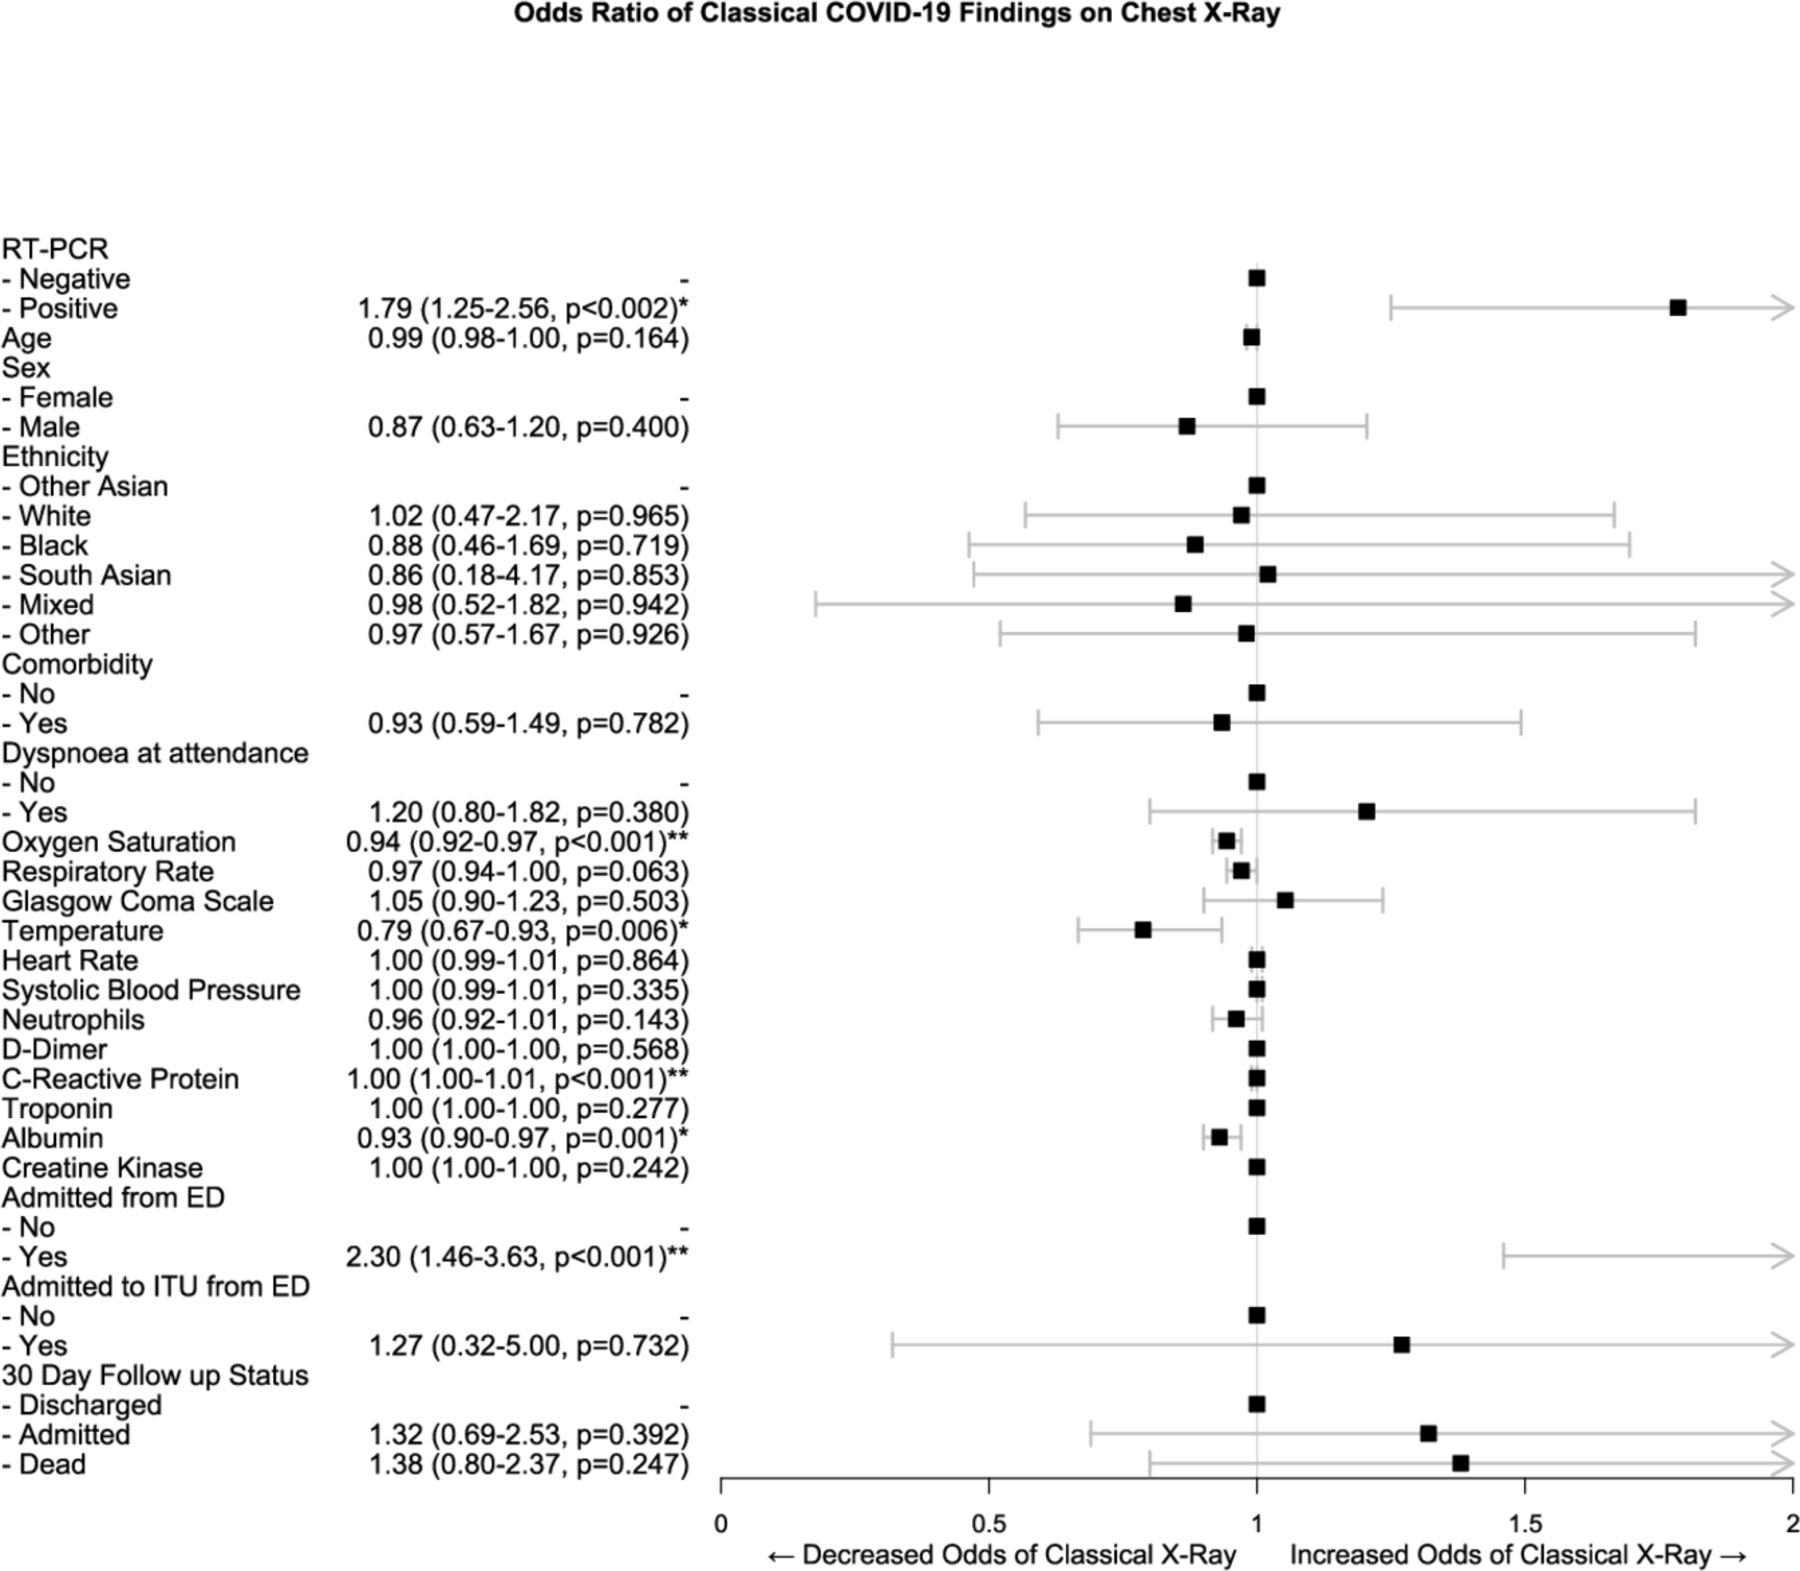
Positive CXRs for COVID-19 were significantly associated with lower oxygen saturations (OR 0.94 95% CI 0.92 to 0.97, p<0.001) and temperatures (2.30 95% CI 1.46 to 3.63, p<0.001) in the ED following propensity score matching and multivariate regression (table 5 and figure 3).

Forest plot of ORs of variables associated with classical chest X-ray features COVID-19 following propensity score matching and binomial logistic regression. *Significant difference at the <0.05 level; **significant difference at the <0.001 level. ED, emergency department; ITU, intensive treatment unit; RT-PCR, reverse transcriptase PCR.
Association of covariates with CXR report following propensity score matching and either binomial or ordinal logistic regression
They also had higher rates of admission to a general ward from the ED (OR 2.30 95% CI 1.46 to 3.63, p<0.001) but no significant association with 30-day outcomes. There was a statistically significant increase in C reactive protein with a positive X-ray; however, this is unlikely to be clinically meaningful due to the minimal association (OR 1.00 95% CI 1.00 to 1.01).
Discussion
This study is the first to report the diagnostic accuracy of CXR and CT in the general emergency population during the COVID-19 pandemic.
We show that CXR has poor sensitivity and specificity for diagnosis of COVID-19, while CT has 29% higher sensitivity. Many international radiological guidelines advise against CT scanning for the initial assessment of COVID-1921–23 or where there are equivocal CXRs, while in other countries CT scanning is performed as a routine first-line investigation. Our results suggest that CT should be considered in the initial assessment of COVID-19 and that CXR findings poorly correlate with CT findings in this setting. We also show that indeterminate and non-classical features of COVID-19 significantly increase the sensitivity of these imaging modalities, without a significant decrease in specificity. Further, we demonstrate the limited prognostic value of CXR in COVID-19.
These findings mirror what has previously been reported in the literature on individuals with confirmed COVID-19. Wong et al19 showed a sensitivity of 59% for initial X-ray in confirmed COVID-19 infection, similarly initial case series in China also reported a sensitivity of 59.1%.12
A recent press article from Italy reported a much higher sensitivity of 89% for CXR in a smaller general emergency population (n=535) without confirmed COVID-19 at attendance.24 However, this used telephone follow-up for clinical symptoms of COVID-19 as a reference standard in individuals with an initial negative RT-PCR swab and appeared to classify any abnormal X-ray as positive, which may inflate this figure. When indeterminate CXRs are counted as positive in this study, the sensitivity would be in line with these Italian data. In the USA, a study of patients attending an urgent care centre with confirmed COVID-19 showed a much lower sensitivity at 41.7% for CXR where any abnormality was found on the images.25 In this study, 97 out of 636 reports were reclassified from ‘possible pneumonia’ to ‘normal’ on a second reading from a radiologist, highlighting the importance of inter-rater agreement and possibly explaining this low estimate.
CT has been reported in previous studies as being up to 98% sensitive for the diagnosis of COVID-19 in confirmed patients, when RT-PCR is used as the reference standard in confirmed patients.3 4 These studies used any potential features of COVID-19 (eg, ground glass opacification, crazy paving) as a positive scan, regardless of spatial distribution or features more characteristic of alternate pathology, unlike the BSTI guidelines used in this study. When we classified indeterminate CTs as positive like these latter studies, our estimates match their sensitivity values.
Consequently, a much lower specificity of 25% was found with initial RT-PCR in the previous literature; however, it is reported that 10 out of 15 (67%) of these negatives subsequently tested positive. This would give an adjusted specificity of 75%, considering subsequent swabs as a reference standard, which, combined with the wider CIs in these smaller studies, would bring estimates in line with the specificity in this paper. More recent meta-analyses have placed the pooled sensitivity of CT in populations with confirmed COVID-19 only, at 89.76% (95% CI 84.42% to 93.84%),26 in line with the estimates identified here.
There is limited coverage in the literature on association of X-ray findings with clinical and laboratory parameters and outcomes in the COVID-19 pandemic. This study demonstrates that classic appearances of COVID-19 were associated with initial lower saturations and lower temperature. Volume opacification of the lung fields was not quantified as a surrogate of severity; however, the use of the BSTI grading templates does this somewhat. When the X-ray report is considered as a graded scale from low likelihood of COVID-19 and severity to high likelihood and severity of disease, there was no significant difference in association with vital signs or laboratory parameters compared with when the X-ray report is merely considered as a binary positive and negative outcome for COVID-19.
Borghesi and colleagues have devised an X-ray grading system, the Brixia score, for severity in admitted patients with confirmed SARS-CoV-2 infection.27 They further found a significant increase in the severity of CXR by this scoring system in those who were discharged versus those who died.28 29
Here, there were no relevant associations between CXR and laboratory values. This analysis also found no association with positive X-rays and 30-day outcomes after multivariate analyses, unlike Borghese et al. This is also in contrast to Guan et al who found higher rates of ITU admission and death in those with positive imaging findings. However, these studies analysed only those with confirmed SARS-CoV-2 infection. The divergence observed in this study may be due to classifying those with ‘Alternate pathology/Indeterminate’ or ‘CVXC3/CVXC2’ as per the BSTI templates, negative for COVID-19 in these analyses. Other studies classified X-rays with any abnormality as a positive for COVID-19. These alternate distributions may still be reflective of underlying COVID-19 and we show significantly higher sensitivity for both CT and CXR when these are classed as positive. It may be that correlating indeterminate X-rays (in addition to classical images) with vitals, laboratory markers and 30-day outcomes would yield significant associations. However this may be unlikely, Xu and Zhang et al found that those with classical bilateral and diffuse involvement in upper and lower lobes had more severe disease than those without.30 31
There were a total of 70 confirmed PE in our dataset out of 114 CT pulmonary angiograms (61.0%, 5.84% of all patients attending) performed in the ED. The incidence of venous thromboembolism is reported as ranging from 20% to 30% in admitted confirmed SARS-CoV-2 positive patients.32 Although we have not focused on this cohort of patients in this paper for the sake of brevity and simplicity, this high incidence represents a further advantage for CT over CXR.
CT, even with the absence of contrast, has been shown to have strong accuracy in the diagnosis of PE and many imaging features correlate with the presence of PE. Sensitivities of non-contrast CT for diagnosis of PE have been reported at 96.9% and specificity at 71.9%.33 34
We therefore see the advantages of CT scanning in COVID-19 as threefold over other diagnostic techniques: (1) the rapid turnaround; (2) increased sensitivity; and (3) the possibility to identify PE in COVID-19, which are a significant burden in this group.
This must be balanced against the excess radiation exposure with CT. Radiation from CT and its association with carcinogenesis is difficult to quantify and no definitive epidemiological studies have confirmed excess risk of cancer.35 Modern CT scanners and software reconstruction techniques continue to minimise radiation exposure and many ways of shielding parts of the body from radiation also exist. Nevertheless, the excess risk of lifetime cancer is estimated at 1 per 5000 CT examinations.36
Strengths and limitations
This study is the largest conducted on imaging during the COVID-19 pandemic and one of the only studies conducted in the general population during the pandemic rather than only in confirmed patients. This enables greater applicability to the clinical setting where the diagnosis is uncertain, in addition to being able to calculate specificity, which is not possible in most studies. This study was planned to be powered to detect a sensitivity and specificity of 56% for CXR and greatly exceeded the sample size necessary for this.
Comprehensive statistical analyses were conducted to account for confounders in both factors influencing reporting of CXR and in factors affecting outcomes. The data were collected from prospectively maintained electronic records; however, the retrieval took place retrospectively with its inherent disadvantages. We were not able to collect data on several relevant covariates such as specific comorbidities or markers of severity such as lymphocytes. Furthermore, there was a significant amount of missing data that required multiple imputation to replace, although the fit of these imputed data was good, actual, observed data would be ideal.
Inter-rater reliability of imaging reports was not analysed in this paper and there was the potential for individual radiologists to have greater or lesser accuracy in the diagnosis of COVID-19.The literature has so far suggested a strong degree of agreement between radiologists in reporting of COVID-19 images.28
The single centre nature of this study further limits generalisability and the potential for interhospital disagreement in imaging, in addition to inter-rater disagreement.
Finally, the median time for patients to receive a CT scan was 4.5 days following initial attendance to ED. Thus, the scans may not have been directly comparable to the initial CXR, both because of the progression of disease and because the SARS-CoV-2 status may have been confirmed at this point, biassing the reporting of these scans.
Future research
Although this study used RT-PCR of nasopharyngeal swabs as a reference standard, newer methods exist for diagnosis of the disease. Serological assays for antibodies against SARS-CoV-2 are increasingly available and may represent a better gold standard in diagnosis for future research.37 RT-PCR is limited by swabbing technique for nasopharyngeal samples and the fact that the virus is more avid in the lower respiratory tract.38 However, many patients may not seroconvert prior to death, limiting this test to survivors only.
Point-of-care lung ultrasound is a new technique for diagnosis of COVID-19 which may mitigate many of the issues noted with the modalities discussed so far. It has no radiation, is fast, cheap and may be able to detect lower respiratory tract disease unlike nasopharyngeal swab.
However, there is limited evidence beyond small case series on its diagnostic accuracy.39–41 Further, like other ultrasound techniques, accuracy will likely be operator dependent42 and experience will need to be built up for robust results in evaluating suspected COVID-19.
Finally, much research has been conducted in the use of artificial intelligence techniques to correctly diagnose COVID-19 based on imaging.43–45 These techniques would obviate capacity limitations in reporting imaging as well as eliminate inter-reporter variability. However, as with any supervised machine learning technique, large, generalisable datasets, with correctly preclassified positive and negative cases (which in turn will depend on a truly accurate reference standard), are needed.46
Conclusion
CXR has poor sensitivity and specificity in diagnosing COVID-19 in the general population during the pandemic. CT scanning has demonstrated excellent sensitivity and should strongly be considered during the pandemic in the initial assessment of COVID-19. This needs to be balanced against the risk of excess radiation with CT, where capacity allows.
Acknowledgments
We would like to thank Scott Wilson from the Royal Free Hospital’s clinical practice group analytics department for retrieving the data from the hospital’s data warehouse. We would like to thank Dr Federico Ricciardi of the Department of Statistical Science and PRIMENT Clinical Trials Unit at University College London for reviewing the statistical methods in this study.
References
Supplementary materials
Supplementary Data
This web only file has been produced by the BMJ Publishing Group from an electronic file supplied by the author(s) and has not been edited for content.
Supplementary Data
This web only file has been produced by the BMJ Publishing Group from an electronic file supplied by the author(s) and has not been edited for content.
Footnotes
Correction notice This article has been corrected since it was first published. Counclusion section of abstract has been corrected.
Funding The authors have not declared a specific grant for this research from any funding agency in the public, commercial or not-for-profit sectors.
Competing interests None declared.
Patient consent for publication Not required.
Ethics approval This study was registered with the local institutional review board as a service evaluation using anonymised data only. No formal ethics committee review was required.
Provenance and peer review Not commissioned; externally peer reviewed.
Data availability statement Anonymised data is available on reasonable request from the corresponding author. Analysis scripts are attached as a supplementary file.
Supplemental material This content has been supplied by the author(s). It has not been vetted by BMJ Publishing Group Limited (BMJ) and may not have been peer-reviewed. Any opinions or recommendations discussed are solely those of the author(s) and are not endorsed by BMJ. BMJ disclaims all liability and responsibility arising from any reliance placed on the content. Where the content includes any translated material, BMJ does not warrant the accuracy and reliability of the translations (including but not limited to local regulations, clinical guidelines, terminology, drug names and drug dosages), and is not responsible for any error and/or omissions arising from translation and adaptation or otherwise.