Article Text

Abstract
Objectives This study aims to investigate the relationship between daily weather and transmission rate of SARS-CoV-2, and to develop a generalised model for future prediction of the COVID-19 spreading rate for a certain area with meteorological factors.
Design A retrospective, qualitative study.
Methods and analysis We collected 382 596 records of weather data with four meteorological factors, namely, average temperature, relative humidity, wind speed, and air visibility, and 15 192 records of epidemic data with daily new confirmed case counts (1 587 209 confirmed cases in total) in nearly 500 areas worldwide from 20 January 2020 to 9 April 2020. Epidemic data were modelled against weather data to find a model that could best predict the future outbreak.
Results Significant correlation of the daily new confirmed case count with the weather 3 to 7 days ago were found. SARS-CoV-2 is easy to spread under weather conditions of average temperature at 5 to 15°C, relative humidity at 70% to 80%, wind speed at 1.5 to 4.5 m/s and air visibility less than 10 statute miles. A short-term model with these four meteorological variables was derived to predict the daily increase in COVID-19 cases; and a long-term model using temperature to predict the pandemic in the next week to month was derived. Taken China as a discovery dataset, it was well validated with worldwide data. According to this model, there are five viral transmission patterns, ‘restricted’, ‘controlled’, ‘natural’, ‘tropical’ and ‘southern’. This model’s prediction performance correlates with actual observations best (over 0.9 correlation coefficient) under natural spread mode of SARS-CoV-2 when there is not much human interference such as epidemic control.
Conclusions This model can be used for prediction of the future outbreak, and illustrating the effect of epidemic control for a certain area.
- epidemiology
- epidemiology
- public health
- infection control
- COVID-19
This is an open access article distributed in accordance with the Creative Commons Attribution Non Commercial (CC BY-NC 4.0) license, which permits others to distribute, remix, adapt, build upon this work non-commercially, and license their derivative works on different terms, provided the original work is properly cited, appropriate credit is given, any changes made indicated, and the use is non-commercial. See: http://creativecommons.org/licenses/by-nc/4.0/.
Statistics from Altmetric.com
Strengths and limitations of this study
This study investigates the role of daily weather in COVID-19 spread systematically with a comprehensive set of four meteorological factors.
This research collected a huge amount of data, covering nearly 500 areas worldwide in a long timescale.
The current study proposes mathematical models integrating meteorological information for predicting COVID-19 case counts in the future.
The influence of weather on virus spread could be confounded by a dozen of manual interventions, such as population mobility and disinfection measures, leading to inaccurate modelling.
The prediction model (especially the long-term model) might be unsuitable and inaccurate for areas with hot weather.
Introduction
The COVID-19 pandemic caused by SARS-CoV-2 has spread all over the world and has unprecedented great social and economical impact worldwide.1 2 It exhibits high human-to-human transmissibility compared with other coronavirus such as SARS.3 It would be crucial to predict the future trend of COVID-19 outbreak ahead, in order to make proper prevention and control strategies accordingly in time.
Besides population mobility and human-to-human contact, meteorological conditions have been suggested to be involved in the transmission of droplet-mediated viral diseases.4 5 As droplets carrying the coronavirus can travel in gaseous clouds as far as 8 meters and stay suspended in the air for hours,5 the suspending time and viability of the coronavirus outside body would be largely affected by the environment. Wind speed could affect the suspending time of droplets. Visibility and humidity reflect the amount of particles in the air, determining the coronavirus payload. Temperature affects virus’s viability in the environment. As SARS-CoV-2 is enveloped, it might be more vulnerable to adverse conditions like high temperature.
The impact of weather on epidemiology has been mentioned in human’s history. The ancient Chinese had a theory called ‘Five Movement and Six Weather’ to study climate change and its relationship with human health. Currently, there are a few studies on preprint servers discussing the relationship of temperature and humidity with the pandemic, but none is systematical investigation or proposes a validated practical model for prediction.6–10
Herein, this study intends to investigate the relationship between meteorological factors and epidemic transmission rate on a world scale. Four meteorological variables, that is, average temperature, relative humidity, wind speed and air visibility, were collected as well as the confirmed case counts daily for 81 days from 20 January 2020 to 9 April 2020 for nearly 500 areas around the world, including over 400 Chinese cities and areas, 18 Italian provinces and 13 other countries. Five time point’s delay of virus infection from exposure were considered and compared with each other to determine the most reasonable time point’s delay. A multivariate polynomial regression model with meteorological factors as a ‘weather coefficient’ of the existing confirmed case count was established in a discovery Chinese dataset, and then validated by worldwide data. Five transmission modes, indicating different levels of epidemic control, were revealed by this model. In this view, this model can not only predict future outbreak, but also be used to evaluate the effect of epidemic prevention measures for a certain area.
Materials and methods
Epidemiological data
Epidemiological data were collected from the WHO,11 European Centre for Disease Control and Prevention, and DXY-COVID-19-Data.12 The daily new confirmed case counts were collected from 20 January 2020 to 9 April 2020. Incidence data were obtained for 428 Chinese cities and districts, 18 Italian provinces and 13 other countries, namely, USA, UK, Germany, France, Spain, Iran, Korea, Japan, Australia, South Africa, India, Thailand, and Singapore. Considering the potential confounding effect, only Chinese cities with no less than 50 cumulative confirmed cases in 1 month and without official reports of large imported cases (42 cities in total) were taken as a discovery dataset, while those for Italian provinces and all the other nations were taken as replication datasets (online supplemental materials).
Supplemental material
Weather data
Four meteorological variables were chosen, namely, air temperature, relative humidity, wind speed and air visibility. Temperature could affect virus viability in the environment. Wind speed could affect the suspending time of virus-attached particles. Relative humidity reflects the amount of droplets in the air. Visibility is influenced by the amount of particles such as dust and air pollutants. These two parameters both affect the amount of mediator for the virus to stay in the air. Therefore, temperature, dew point, wind speed and visibility were collected, and relative humidity was calculated accordingly (online supplemental materials). We obtained hourly values of meteorological observations and geographical factors (latitude and elevation) from the Integrated Surface Database of USA National Centers for Environmental Information.13 Daily data were calculated by averaging the hourly data for each variable in each day.
Statistical modelling
The number of daily new confirmed cases was taken as a dependent variable. Four meteorological variables, namely, average temperature, wind speed, visibility and relative humidity, and the existing confirmed case count were taken as independent variables. Considering that there is a latency stage from the day getting infected to the day being confirmed, a time delay of the day COVID-19 was confirmed from the day weather data were collected needs to be taken into consideration. As it is reported that the latency period for COVID-19 is 3 to 7 days on average and 14 days at most, five time point’s delay of virus infection were taken into consideration, that is, weather data and existing confirmed cases count data were collected on the day, 3 days before, 7 days before, 3 to 7 days before and 14 days before collecting the new confirmed case count data.
To investigate whether the influence of meteorological factors is linear or quadric, both linear and non-linear modelling were performed under different relationship assumptions to compare model fitness statistics. Each meteorological variable was fitted into a bunch of single-factor models (either generalised linear model or polynomial model) through non-linear least squares (NLS) modelling using the Wuhan data set with a 3 to 7 day’s delay of infection. The relationship between each meteorological variable and confirmed new case count (linear or quadric) was identified based on model fitness (log-likelihood, Akaike information criterion, Bayesian information criterion, and so on) and common knowledge of droplet-mediated viral diseases.
Second, the proper time delay from weather exposure to COVID-19 confirmation was investigated in the Wuhan dataset through Loess regression interpolation and NLS modelling with the previously identified relationship for each meteorological variable. The most possible time delay identified was taken for subsequent analyses.
To investigate the degree of contribution to the COVID-19 case count for each meteorological factor, Spearman’s correlation test (a non-parametric method that measures the strength and direction of associations) was first adopted, with the Wuhan dataset under the assumption of previously defined time delay. Nevertheless, here we assumed monotonic correlations between COVID-19 case count and meteorological variables, while we could not exclude the possibility that the real relationship was not monotonic, which might impede the accuracy of correlation analysis. Then, we performed single-factor NLS regression modelling for each meteorological variable in the discovery dataset under the assumption of previously determined relationship and predefined time delay, to determine the exact coefficients accompanied with each meteorological factor and to find out the most suitable environmental condition for SARS-CoV-2.
Then, two final prediction models (short-term model and long-term model) were developed using the discovery data set with the previously determined coefficients. The prediction model supposed that all the meteorological variables, with their specific coefficients determined by single-factor modelling, were added together to compose a weather coefficient. The new confirmed case count on the confirmation day is calculated by multiplying the weather coefficient with the existing confirmed case count on the exposure day (the time delay between confirmation day and exposure day is determined in previous analysis), and then multiplying by a constant coefficient. The short-term model took all four variables, while the long-term model only considered temperature as it is easy to be forecasted. There was a constant coefficient for the total equation. Its exact value was determined by model fitting in the discovery dataset. The influence of geographical factors, that is, latitude and elevation, was investigated with all datasets covering the world’s top cities and areas. The correlation of existing confirmed case count with newly confirmed case count was also investigated. Basic statistics and modelling was conducted in R V.3.5.1 (https://cran.r-project.org/).
Model validation and application
The best fitted model was validated in the replication datasets (Italian city-level data and other nation-level data) by correlating the observed actual epidemiological data with the predicted values from the model in the datasets. We used these fitted models to calculate a predicted value for case count for each studied site, and then compared this predicted value with the real observed case count by calculating a Spearman’s correlation coefficient ρ between them.
Patient and public involvement
No specific patients were included in the current study. Epidemiological data were downloaded from online open-source databases. The public were not involved in the planning and design of the study.
Results
The Weather’s influence on SARS-CoV-2 transmission displays 3 to 7 days’ time delay
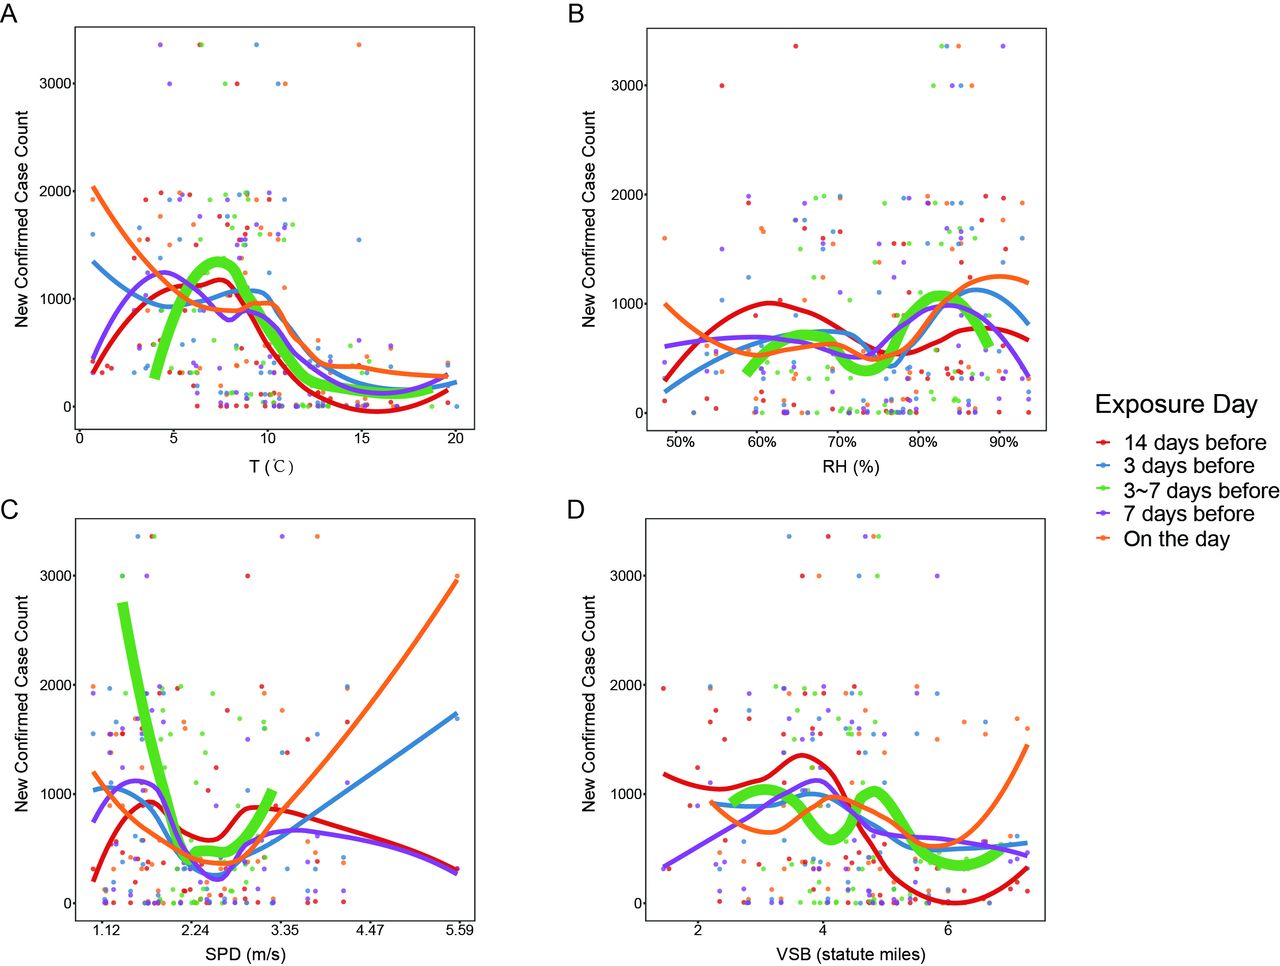
The ranges of average temperature, relative humidity, wind speed and visibility in the replication datasets were similar to those in the discovery dataset. Non-linear modelling with Wuhan dataset under the assumption of 3 to 7 days’ delay of confirmation from exposure suggested that the effect of temperature and wind speed is better depicted as quadric (online supplemental table S1), which was also supported by Loess regression interpolation (figure 1). The mode for relative humidity and visibility was hard to be determined, as statistics supported both relationships (online supplemental table S1). Considering the common knowledge of coronavirus transmission and the trend showed by Loess regression interpolation, relative humidity exerted its impact in a quadric trend, while visibility exerted its impact in a linear trend (figure 1, online supplemental results).

Loess regression interpolation of confirmed new case count to the four meteorological variables, (A) average temperature (T) in °C, (B) relative humidity (RH) in %, (C) wind speed (SPD) in metre per second (m/s), (D) visibility (VSB) in statute miles, for Wuhan city. Five time point’s delay of confirmation from viral infection are displayed together in one figure, namely, exposure on the day, 3 days before, 7 days before, 3 to 7 days before and 14 days before.
Furthermore, investigation of the time delay effect in the Wuhan dataset showed that the number of confirmed new cases was best correlated with air temperature 3 to 7 days ago, relative humidity and visibility 7 days ago and wind speed on the exposure day (online supplemental table S2). By comprehensive consideration of all four meteorological variables and the differences between statistics values, the weather 3 to 7 days ago, as well as weather 1 week ago, could well predict COVID-19 outbreak. It coincided with the latency period of 3 to 7 days for SARS-CoV-2, that is, exposure of environmental virus might exhibit its effect after 3 to 7 days.
Contribution of single meteorological factor to the outbreak
In the Wuhan dataset, the new case count was significantly positively correlated with temperature (Spearman’s correlation ρ=0.69, p<0.001) and visibility (ρ=0.43, p=0.04), and negatively correlated with wind speed (ρ=−0.45, p=0.03) and relative humidity (ρ=−0.33, p=0.12) 3 to 7 days ago. It suggested that temperature was correlated with the outbreak best, followed by wind speed, visibility and relative humidity. A model only with temperature as a parameter could already explain 45% of the variance in the epidemic data (p=4×10⁻⁴), while wind speed and visibility could explain over 25% of the variance. According to the fitted single-factor models (temperature, relative humidity and wind speed were fitted into quadratic models; and visibility was fitted into a linear model, see online supplemental results for details), SARS-CoV-2 transmission reaches a peak when mean temperature is 6.18°C (figure 2A), relative humidity is 78.47% (figure 2B) and wind speed is 1.88 metre per second (m/s) (figure 2C); and its transmission rate decreases with the increase of visibility (figure 2D). The effects of geographical factors such as latitude and elevation, and the pure influence from the number of existing cases were further investigated in the worldwide datasets (online supplemental figure S1), illustrating that COVID-19 mainly outbreaks at latitude 30° to 50° (online supplemental figure S1A) and elevation <500 metre (online supplemental figure S1B). New confirmed case count was positively correlated with the existing confirmed case count (online supplemental figure S1C).

Scatterplots of confirmed new case counts to the four meteorological variables, (A) average temperature (T) in °C, (B) relative humidity (RH) in %, (C) wind speed (SPD) in metre per second (m/s) (D) visibility (VSB) in statute miles, for all the studied datasets. Quadric regression for T, RH and SPD, and linear regression for VSB are illustrated for each dataset. Interpolation curves with 95% CIs are shown in shadow. The discovery dataset includes the major outbreak Chinese cities, while the replication datasets included provincial data in Italy, and national data around the world (except China).
Short-term prediction model
We further derived a full model combined with all four meteorological variables and fitted this model with the discovery dataset (online supplemental results). The best-fitted short-term model was as follows:

where T is temperature in °C, RH is relative humidity in percentage (defined as over 15%), SPD is wind speed in m/s, VSB is visibility in statute miles, α is a site-specific constant, with a default of 0.001. All parameters take the means of values 3 to 7 days before the day new case count is evaluated.
In this model, all the four meteorological variables are added together in their proper forms to compose a ‘weather coefficient’ (the equation in brackets), which affects the transmission rate of SARS-CoV-2, and thus influences the number of people that catch infection from the existing cases, which then determines the new case count 3 to 7 days later. There is a multiplicative constant coefficient α in the equation, which seems site-related. This constant coefficient could adjust the strength of the ‘weather coefficient’ on disease transmission. When we substitute replication datasets into this short-term model with the multiplicative constant coefficient α originally determined by the discovery data set (which was 0.00048), an obvious underestimation of predicted values against real ones was observed although the predicted values correlated with the real ones very well. We supposed it was due to site-specific difference in the multiplicative constant coefficient α since the discovery dataset was all Chinese areas where the pandemic had been controlled early. Thus, we further re-fitted this composed model with all datasets to determine a more accurate value of the multiplicative constant coefficient α, which was 0.001 then. In practical application, we need to first plot the observed case count versus the predicted one with a default α value 0.001, and then examine the extent of underestimation or overestimation, to finally determine a proper multiplicative constant coefficient α to adjust the impact size of ‘weather coefficient’ for a certain site.
Substitute data from the past 2 months, a good prediction performance was obtained for this short-term model, with the predicted values significantly correlated to the observed ones for most areas (figure 3). However, only the existing confirmed case count data could not predict the new case count 3 to 7 days later as well as the weather-combined model did (online supplemental table S3).

The observed daily new case counts versus the predicted values by the short-term model (A to E) and the long-term model (F) are illustrated for all the studied areas. The plots exhibit five prediction–observation correlation patterns, indicating five viral transmission modes: (A) the ‘restricted’ pattern including the Chinese top affected cities excluding Wuhan; (B) the ‘controlled’ pattern including early outbreak areas, namely, Iran, Italy, Japan, Korea, and Chinese Wuhan city; (C) the ‘natural’ pattern including late outbreak European and American countries, namely, France, Germany, Spain, UK and USA; (D) the ‘tropical’ pattern including tropical countries, namely, India, Singapore and Thailand; (E) the ‘southern’ pattern including countries in the southern hemisphere, namely, Australia and South Africa. Each dot represents 1 day. Loess regression (A, B and E) and linear regression (C and D) interpolation curves are illustrated for each area, with 95% CIs showing in shadow. The black solid line represents that the observed values are equal to the predicted ones, and dots closer to this line mean better prediction performance.
Different modes of viral transmission illustrated by the model
The observed versus predicted data exhibited different correlation patterns for different areas, meaning different viral transmission modes, which may indicate the effect of epidemic control for certain area.
The outbreak in Chinese top-affected cities was not very well predicted and obviously overestimated by this model with the default multiplicative constant coefficient α (ρ=0.11, p<0.001; figure 3A). It might be due to the reason that most Chinese cities took actions quickly after the outbreak in Wuhan was reported, thus, these cities were under strict epidemic control at the beginning of the pandemic. This viral transmission mode suggested by the not well correlated prediction pattern is called ‘restricted’.
For Chinese Wuhan city and some early outbreak countries (Japan, Korea, Iran, and Italy), the predicted outbreak was well correlated with the actual observations at the beginning when the existing confirmed cases were not in very large numbers, but the prediction deviated from the observation as the confirmed cases increased, in detail, there’s large overestimation of prediction (ρWuhan = 0.69, ρItaly = 0.87, ρJapan = 0.80, ρIran = 0.86, p<0.001, and ρKorea = 0.43, p=0.002; figure 3B). It is of notice that the dramatic deviation of predictions for Wuhan occurred after 15 February 2020, the day when shelter hospitals had been put into use for 7 days (the average latency period for COVID-19). Therefore, the deviated prediction pattern indicates that the outbreak prevention and control taken in these areas is effective (so-called ‘controlled’ mode). The number of cases had been decreased by 72% for Wuhan, over 95% for Korea, Japan, and Italy, and 37% for Iran at most due to epidemic control (defined as the largest gap between prediction and observation).
For most European and American countries, the predicted outbreak was linearly correlated with the observed data very well (ρFrance = 0.96, ρUSA = 0.93, ρUK = 0.83, ρSpain = 0.97 and ρGermany = 0.94, p<0.001; figure 3C), suggesting a natural viral transmission mode without much man-made epidemic prevention measures. Estimation of daily new case counts by this short-term model performed very well for European countries, while this model underestimated the outbreak in the USA.
Although the weather is not suitable for virus in tropical areas, the virus transmitted in natural mode, manifested as good linear correlation between the prediction and the observation (ρIndia = 0.94, ρSingapore = 0.66, p<0.001, and ρThailand = 0.56, p=0.001; figure 3D), with just relatively small daily new case counts compared with temperate regions.
Countries in the southern hemisphere displayed similar pattern as the ‘controlled’ with large overestimation by the model when the confirmed case increased, leading to not good prediction performance (ρAustralia = 0.79, p<0.001 and ρSouth Africa = 0.34, p=0.08; figure 3E). It might be due to the effect of epidemic prevention measures and hot summer weather in these countries.
Long-term simplified model
Long-term prediction depends on weather forecast, which generally reports only average temperature. As temperature 14 days ago could predict COVID-19 outbreak as well as temperature in a short time delay (e.g., 3 to 7 days ago), we again performed single-factor regression modelling in the discovery dataset, taking temperature 14 days ago as an input, assuming a quadric function (online supplemental results). This simplified model with average temperature as a weather factor was derived as follows:

where T is temperature in °C, β is a site-related multiplicative constant coefficient, with a default of 0.006. All parameters take values 14 days before the day new case count is evaluated.
With the model, the prediction performance was still good (ρ=0.66 in the replication datasets, p<0.001; figure 3F). The long-term simplified prediction model also showed five prediction-observation correlation patterns (figure 3F), indicating different modes of viral transmission, for the studied areas. This model could directly predict the newly emerging cases 14 days later, and could be used to predict COVID-19 outbreak in the future month by summing up the daily new case count and combining weather forecast (usually available for the future 15 days).
Discussion
This research discovers non-linear dose-response relationship for meteorological factors, in consistency with previous studies.7 Predictions of COVID-19 outbreak scale by the models were well correlated with the observations around the world, suggesting the importance of weather in SARS-CoV-2 transmission. Previous studies have implied the spread of many respiratory infectious diseases, such as influenza, is dependent on temperature and relative humidity.4 Recent published papers on preprint servers have reported roles of temperature and absolute humidity in the COVID-19 transmission, but their conclusions are diverse.6–10 In contrast to the findings by Cai10 this study suggests significant impact of mean temperature on the daily new case count, indicating a need for sufficient time delay between exposure and confirmation for weather to exhibit its effect. In contrary to other two studies,6 7 this research suggests that there is a relatively not wide temperature and humidity ranges for the pandemic. There is an optimal temperature for SARS-CoV-2 at 6.18°C, which is colder than that suggested by Bu et al9 but in consistency with the estimation by Wang et al7; and most areas with large spread locate in the humidity range of 60% to 90%, more humid than Bu et al suggested.9 It is of notice that different from other viral respiratory diseases such as influenza,14 15 high relative humidity is better for SARS-CoV-2 to spread, suggesting that a sufficient amount of droplets in the air to support the suspension of SARS-CoV-2 is more important for its spread than the adverse effect of dry air on the human immune system. Different from other studies,16 this study also finds significant involvement of wind speed, in a quadric manner, indicating that mild wind might be more suitable for the virus to suspend in the air. In addition, the current study discovers that visibility is significantly negatively correlated with new case count and plays a more important role in viral spread than humidity did (by comparing Spearman’s correlation coefficient). As visibility reflects the amount of particles (e.g, dust and air pollutants) in the air while humidity reflects the amount of water in the air, it may indicates that SARS-CoV-2 is more likely to cling to solid particles than droplets. New case count decreases rapidly when visibility is high than 13 statute miles, indicating that caution should be taken if visibility drops below 10 statute miles.
In the prediction model, there is a multiplicative constant coefficient which determines strength of the weather coefficient on epidemic transmission. It seems site-specific, as adjusting it could make prediction for one site closer to observation. This constant might reflect the influence of a couple of site-specific confounding factors, such as epidemic control measures, sun radiation and population density. Various degrees of isolation for various areas around the world lead to different degrees of weather effect. When evaluating the prediction performance by the short-term model and the long-term model, they both exhibit different prediction–observation correlation patterns (figure 3), suggesting that changes in degree of epidemic control and isolation policy would lead to deviation from the original prediction and thus different prediction–observation correlation patterns. Therefore, by plotting the predicted versus observed new case counts and adjusting the multiplicative constant coefficient (α and β), it would be easy to evaluate the effect of epidemic prevention measures. It is of notice that the observed case count dropped dramatically from predictions for Wuhan 7 days after their shelter hospitals were put in use, suggesting the importance and necessity of building shelter hospitals for strict isolation rather than just home isolation. With the use of shelter hospitals and very strict isolation measures, the outbreak in one area could be reduced by 52 to 99% compared with natural transmission. Another thing worth attention is that although the weather in tropical areas like India is not suitable for virus survival and transmission, SARS-CoV-2 still keeps on spreading in a linear fashion in these areas, but just with low growth rate of the outbreak. Therefore, these tropical areas should still be on the alert against future outbreak of COVID-19.
Although those cases with travel history to China or indicated by the WHO as ‘imported case only’ were excluded in this study to make the worldwide data most likely local transmission, it was difficult to separate the imported cases from local transmission very well in practice. It might explain the not excellent correlation of predictions with observations. Furthermore, the relationship of weather and COVID-19 could be complex, since the human immune system has an innate seasonal rhythm, and the immune system could also be affected by weather vice versa. For example, dry air would reduce the amount of mucus on the airway mucosa, and thus increases the probability of viral invasion, while wet air would provide droplets for virus to adhere.
There are several limitations of this study. First of all, this prediction model (especially the long-term model) might be more suitable and accurate for temperate areas in spring, autumn, and winter, as the models were derived using Chinese datasets, mainly in the first 3 months of 2020. The prediction became inaccurate and even improper under hot weather (i.e., the predicted values of long-term model become negative when air temperature is higher than 28°C), which might explain the obviously bad prediction performance for countries in the southern hemisphere and tropical areas. One explanation for the inaccurate prediction in areas with high temperature was that SARS-CoV-2 transmission in these areas was mainly not influenced by weather, but in another direct transmission way, such as face-to-face contact or spread in gathering crowd. Second, it seems that the prediction performance drops with the increase in new case count, suggesting that the prediction model might become inaccurate and not suitable for very large new case count. This could be due to (1) the influence of weather on COVID-19 spread might weaken when the number of cases increases, while other factors such as social distance become more important at a later stage; (2) there were less data points with large new case count, which might lead to larger variance. Third, the short-term prediction model must use all four meteorological factors, while these factors are not always available for any one certain area. Fourth, this study included various areas covering a long period into modelling, thus, there were a bunch of variable confounding factors, such as population mobility and disinfection measures, which were not controlled and thus could impede model accuracy. Fifth, as we could only obtain country-level epidemiological data, the corresponding meteorological data were obtained for their capital cities, leading to not exact pairing of epidemiological data and meteorological data. Sixth, there is a general lack of data and cases in the current study, since we only collected data covering two and a half months while the pandemic has persisted over 9 months up to now.
Conclusion
In summary, this study has found significant correlations between the COVID-19 outbreak and meteorological parameters. It proposes a comprehensive model for predicting COVID-19 outbreak, composed of a short-term version and a long-term version. The short-term version uses the combination of four meteorological factors as a ‘weather coefficient’ of the existing confirmed case count in the past week and can be used to predict outbreak in the future 3 days; the short-term version uses average temperature one week ago as a ‘weather coefficient’ and can predict the outbreak in the future 1 month if combined with weather forecast. This model is easy to use for predicting the COVID-19 outbreak for a certain area, by substituting weather data in the recent past and obtaining an estimate of case count for the future couple of days or month. This model will be very helpful for local governments to make timely policies on epidemic control, for instance, the allocation of medical equipments such as ventilators and medical resources such as hospitals, beds and healthcare workers, according to the prediction.
Acknowledgments
We thank Dr Zhisheng Huang for advice on data collecting and processing, Dr Siyuan Tan for technical support on analysis, Dr Yonggao Chen for mathematical support on modelling, Dr Zhongfa Yang for advice on manuscript revision.
Supplementary materials
Supplementary Data
This web only file has been produced by the BMJ Publishing Group from an electronic file supplied by the author(s) and has not been edited for content.
Footnotes
Contributors BC, YZ and XZ designed and interpreted the reported analyses and results; HL, XY, YH, BZ and MX participated in the acquisition of data; BC analysed the data, drafted and revised the manuscript; HL and XZ revised the manuscript; YZ and FT provided technical support; XZ supervised the research and revised the manuscript.
Funding The Priority Academic Program Development of Jiangsu Higher Education Institutions – the third period (NO. 035062002003c), the National Natural Science Foundation of China (NO. 82001206), the development program of Jiangsu Provincial Hospital of Chinese Medicine (NO. Y19066).
Competing interests None declared.
Patient consent for publication Not required.
Provenance and peer review Not commissioned; externally peer reviewed.
Data availability statement Data are available in a public, open access repository. Data are available upon reasonable request. Weather data and epidemiological data is all obtained from public databases. Detailed modelling results are available upon request by emailing to Biqing Chen, bq_chen@qq.com.
Supplemental material This content has been supplied by the author(s). It has not been vetted by BMJ Publishing Group Limited (BMJ) and may not have been peer-reviewed. Any opinions or recommendations discussed are solely those of the author(s) and are not endorsed by BMJ. BMJ disclaims all liability and responsibility arising from any reliance placed on the content. Where the content includes any translated material, BMJ does not warrant the accuracy and reliability of the translations (including but not limited to local regulations, clinical guidelines, terminology, drug names and drug dosages), and is not responsible for any error and/or omissions arising from translation and adaptation or otherwise.