Article Text

Abstract
Objective The human gut microbiota plays important roles in human health but is also known to be highly diverse between populations from different regions. Yet most studies inadequately account for this regional diversity in their analyses. This study examines the extent to which geographical variation can act as a confounding variable for studies that associate the microbiota with human phenotypic variation.
Design Population-based study.
Setting China.
Participants 2164 participants from 15 province-level divisions in China.
Primary and secondary outcome measures We analysed the impact of geographic location on associations between the human gut microbiota and 72 host factors representing a wide variety of environmental-level, household-level and individual-level factors.
Results While the gut microbiota varied across a wide range of host factors including urbanisation, occupation and dietary variables, the geographic region (province/megacity) of the participants explained the largest proportion of the variance (17.9%). The estimated effect sizes for other host factors varied substantially by region with little evidence of a reproducible signal across different areas as measured by permutational multivariate analysis of variance and random forest models.
Conclusions Our results suggest that geographic variation is an essential factor that should be explicitly considered when generalising microbiota-based models to host phenotype across different populations.
- Gut microbiota
- geographic differences
- microbiota-host associations
- machine learning
This is an open access article distributed in accordance with the Creative Commons Attribution Non Commercial (CC BY-NC 4.0) license, which permits others to distribute, remix, adapt, build upon this work non-commercially, and license their derivative works on different terms, provided the original work is properly cited, appropriate credit is given, any changes made indicated, and the use is non-commercial. See: http://creativecommons.org/licenses/by-nc/4.0/.
Statistics from Altmetric.com
Strengths and limitations of this study
This is one of the largest studies surveying geographical variation in relation to gut microbiota within a single country.
We analysed 72 host factors, including biomarkers, diet, physical activity and lifestyle and environmental data.
We focused on the Chinese population, which may show different patterns of geographical variation than western cohorts.
Introduction
The human gut microbiota plays important roles in human health with demonstrated associations with many diseases including obesity, diabetes, inflammatory bowel disease, cardiovascular disease and cancer.1–6 However, the associated microbiota patterns are not always consistent across studies, especially studies from different countries.7 For example, some US-based studies reported that obesity was associated with higher abundance of Firmicutes and lower abundance of Bacteroidetes in gut microbiota,4 8 but such patterns have not generally been reproducible.9–12 The reasons for such discrepancies across studies remain poorly understood. In this manuscript, we explore the hypothesis that geographic regions directly impact the reproducibility of microbiota patterns with host phenotypes.
Geography has been shown to be one of the strongest explanatory factors of human gut microbiota variation13–15 and regional variation has been shown to relate to how the microbiota contributes to disease. For example, He et al found that the estimated effect size of the association between geographic location with the gut microbiota was higher than that of metabolic diseases within a single province in China, and that metabolic disease models built on gut microbiota composition from one region failed to predict disease in other regions.16 Another study from Europe and India also found that the geographical location was the most influential factor on microbiota variation, with a much larger association with community composition than the difference between healthy and inflammatory bowel disease subpopulations.14 Both studies suggested that geography is an essential factor that cannot be neglected when linking gut microbiota and diseases.
The China Health and Nutrition Survey (CHNS) is a population-based cohort that includes 2164 participants from 15 geographic locations across China, including 12 provinces and 3 megacities (autonomous cities with populations of more than 20 million people) and provides a wide range of data, including sociodemographic and environmental data, biomarkers derived from fasting blood, as well as highly detailed diet, physical activity and lifestyle data. The CHNS offers an opportunity to examine within-country regional differences in gut microbiota. In contrast, previous microbial studies13 14 have compared highly urbanised countries to rural areas in less developed countries on different continents and across diverse ethnic populations. By contrast, the CHNS includes a large diversity in geographic areas within a single country across a gradient of variation in urbanisation and economic status. Using this unique CHNS data, we initially examined one-way (univariate) associations between the human gut microbiota with geographic region (measured as province or megacity) as well as a variety of individual-level, household-level and environment-level factors. We found that geographical region has substantially more pronounced associations with microbial community composition than any other host factor. While we found a substantial number of associations of other host factors with the microbiota, none of these associations appeared robustly reproducible across provinces. These results demonstrate the difficulty of generalising associations of the microbiota across wide geographical regions and suggest that geographical region should be explicitly considered when designing epidemiological studies of the microbiota.
Methods
Cohort description
We used data from the China CHNS, a prospective household-based study across 12 provinces of China (Heilongjiang, Liaoning, Jiangsu, Shandong, Henan, Hubei, Hunan, Guangxi, Guizhou, Zhejiang, Yunnan and Shaanxi) and 3 megacities (Beijing, Shanghai and Chongqing). The CHNS was designed to provide representation of rural and urban areas varying substantially in geography, economic development, public resources and health indicators and is the only large-scale, longitudinal study of its kind in China17. A stratified, multistage, clustered sampling design was used to select the sample within each province/megacity. More detailed survey procedures can be found elsewhere.17 Microbiota samples were collected in 2015 as well as data on host factors and diet that were used to test for associations. The CHNS metadata have been widely published17 18 and the description can be found in online supplementary information.
Supplemental material
Metadata description
Geographic region was measured as the province or megacity where samples were collected (online supplemental figure S1). We used a validated community-level, multidimensional 12-component urbanisation index19 derived from household and community surveys (eg, sanitation, transportation, housing infrastructure, social services) to define low and high urbanisation. We used a range of dietary measures derived from three consecutive 24 hours dietary recalls and household food inventory using a Chinese food composition table20; the method for energy intake was validated by doubly labelled water (r2 men: 0.56, women: 0.60).21 Total physical activity was estimated from self-reported 7-day recalls of occupational, transportation, domestic and leisure activities to define low, medium and high activity level. Fasting blood was collected via venipuncture from which cardiometabolic biomarkers were assayed (eg, diabetes, inflammatory, dyslipidaemia markers). Blood pressure, anthropometry and bioelectrical impedance data were collected according to standardised protocols. Other sociodemographic (eg, income, assets, education) and lifestyle behaviours (eg, tobacco and alcohol use) were collected via self-report.
Sample collection and sequencing
Faecal samples were collected from adult participants aged 18–80 years of age who received adequate training and instructions regarding the collection process prior to stool collection with one sample per participant. All samples were immediately frozen at −20°C after collection, transported through a cold chain to the central laboratory within 24–48 hours and stored in −20°C freezers until being processed at the central sequencing facility. For sequencing analysis, 2164 faecal samples were randomly selected from participants who did not have a bowel disorder or diarrhoea and did not take antibiotics recently or specific bacteria products in the last 4 weeks.
Bacterial DNA was extracted by a bead-beating procedure with TIANGEN DNA extraction kits (TIANGEN Biotech, Beijing, China), according to the manufacturer’s recommendations. The DNA concentration of each sample was adjusted to 50 ng/µL for 16s ribosomal RNA (rRNA) genes. To characterise the taxonomic profile of the gut microbiota, primers 515F/806R (5′-GTGCCAGCMGCCGCGGTAA-3′/5′-GGACTACHVGGGTWTCTAAT-3′) were used to amplify the V4 region of 16s rRNA gene with a 6-bp barcode unique to each sample. The PCR products were combined in equimolar ratios. A TruSeq DNA PCR-Free Library Preparation Kit (Illumina, California, USA) was used for library construction and libraries were sequenced using the Illumina HiSeq PE-250 platform. Samples were randomised for sequencing so that batches of sequence data were not related to specific province/megacity.
The sequencing generated 149 948 266 reads, approximately 69 292 reads per sample. All samples passed quality control. The raw sequencing reads were processed with the Quantitative Insights Into Microbial Ecology (QIIME) pipeline.22 The forward and reverse reads were merged with fastq-join and filtered with a minimum quality score of 20. As a result, 96.9% sequences passed quality filtering. Totally 62 859 operational taxonomic units (OTUs) were respectively picked with open-reference method based on a threshold of 0.97 and 15 152 chimeric OTUs were detected with ChimeraSlayer23 and removed. SILVA databases (Release 128) were used as references for assigning taxonomy. The resulting tables of taxonomic abundances were respectively rarefied to 12 500 sequences per sample to correct the different sequencing depth. Results under a normalisation based on simple proportions24 were essentially identical (data not shown). We decided to use rarefaction for correcting different sequencing depth in the main manuscript, because it has been argued that rarefying is less vulnerable to the influence of library size in principal coordinates analysis (PCoA) ordinations and permutational multivariate analysis of variance (PERMANOVA) analyses.25
Statistical analysis
Bray-Curtis distances between samples were calculated using genera abundance and visualised with PCoA. PERMANOVA was used to test for associations and estimate the percentage of variation in the human gut microbiota explained by each individual host factor including geographic region, demographic information, lifestyle, diet and the health of subjects, with separate models run for each host factor (online supplemental table S1A). We also compared our results in China with an American cohort, using data from the American Gut Project (AGP),26–28 which we analysed through the same pipeline. A list of host factors and their statistical tests are provided in online supplemental table S1B. All p values were adjusted with the Benjamini-Hochberg method to adjust for multiple comparisons and significance was assessed with a threshold of False Discovery Rate (FDR) less than 0.05. A description of AGP subjects is provided in online supplemental table S1C and additional details on the specific host factors for the AGP can be found elsewhere.26 28 We also examined the geographic variation of each individual taxa using Analysis of Compositions of Microbiomes with Bias Correction (ANCOM-BC) with the parameters as the author recommended, and taxa with presence <10% were excluded.29
In addition, due to the large differences in microbial community by region, for each of the 71 non-region-related host factors, we ran a two-way PERMANOVA model with terms for the host factor, province/megacity and interaction between the host factor and province/megacity. Significance for the interaction terms here was defined as an FDR value less than 0.1. To further examine and estimate these differences between provinces/megacities, we also built 15 univariate PERMANOVA models for each host factor, with one for each province or megacity. Any participant missing specific host factor data were excluded from analysis of that specific host factor.
As a compliment to the PERMANOVA models, we used a random forest approach (with Python package ‘scikit-learn’) to test the reproducibility of models across regions. We first tested the performance of microbiota-based random forest models for factors other than province/megacity. For the other 71 host factors collected, 7 had more than 90% missing observations for at least one geographic region and were therefore excluded from the random forest models. To test the strength of the associations within each province and across provinces/megacities, we built random forest models for each of these 64 host factors and assessed the model performance of predicting the host factors using true positive rates for categorical factors and relative root mean square error for continuous variables. Additional details of the random forest models are found in online supplemental information.
Patient and public involvement
Participants in this study gave informed consent for participation. However, the participant and public were not involved in the design or conduct of the study.
Results
Study cohorts
The China CHNS is an ongoing international collaboration designed to track how the health and diet of Chinese society has been impacted by large-scale societal change associated with recent urbanisation and economic growth.17 As part of this survey, we defined a cohort that included 2164 subjects from 15 provinces/megacities with 849 urban and 1315 rural residents (table 1). We used next-generation sequencing to capture gut microbial profiles via faecal samples (see the Methods section). This generated 16s rRNA gene sequences with an average sequencing depth of 69 292 sequences per subject.
Characteristics* of CHNS microbiota study participants
Geographic variation is the major factor driving microbiota variance
To compare the strength of host factors in association with the gut microbiota, in an initial analysis, we examined the associations between the gut microbiota and host factors in this study with a separate univariate PERMANOVA test for each host factor. Using PCoA ordination based on Bray-Curtis dissimilarity, the 15 provinces/megacities showed profound separation in the microbial community, with the 95% CI of each region clearly separated (figure 1A). A similar PCoA visualisation that showed strong separation by province was produced by weighted UniFrac (data not shown) indicating that choice of dissimilarity metric did not drive these differences.

The geographic variation of human gut microbiota in our CHNS cohort and the AGP. (A) PCoA ordinations of microbial composition in the CHNS cohort coloured by provinces/megacities. Ellipses indicate 95% confidence limits. (B) The estimated effect sizes of major host factors driving microbial variation in the CHNS cohort as measured by R2 in PERMANOVA tests. (C) The PCoA ordinations of microbial composition in the AGP cohort coloured by states. Ellipses indicate 95% confidence limits. (D) The estimated effect sizes of major factors driving microbial variation in the AGP cohort as measured by R2 in PERMANOVA tests. AGP,American Gut project; CHNS, China Health andNutrition Survey; PCoA, principal coordinates analysis; PERMANOVA, permutational multivariate analysis of variance.
With a false discovery rate of 0.05, 62 host factors variables were significantly associated with the gut microbiota, with R2 ranging from 17.9% to 0.075% (online supplemental table S1A). Province/megacity explained 17.9% of the overall variance, which is by far the strongest explanatory factor in the univariate models among all the host factors collected (figure 1B). In contrast, each of other host factors explained less than 1% of the variance with the strongest associations observed for occupation (0.96%), community availability of toilets (0.87%), government urban/rural status (according to National Bureau of Statistics of China) (0.59%), percentage of calories from animal source (0.58%) and percentage of fat from animal source (0.51%). Compared with the CHNS cohort, a PERMANOVA test on the AGP showed much less separation of the microbial community by state (figure 1C), with the participants’ states explaining 5.01% of the variance seen across 1282 subjects (figure 1D). Other significant covariates in the AGP included race, antibiotic history and age (figure 1D and online supplemental table S1B). It is a natural hypothesis that regions of China that are further apart in geographic distance would have a more distinct microbiota. Therefore, we next tested whether geographical distance was associated with microbial variation. However, the Bray-Curtis dissimilarity matrix was not significantly correlated with distances between province capitals or megacity centres (Mantel test, p=0.169).
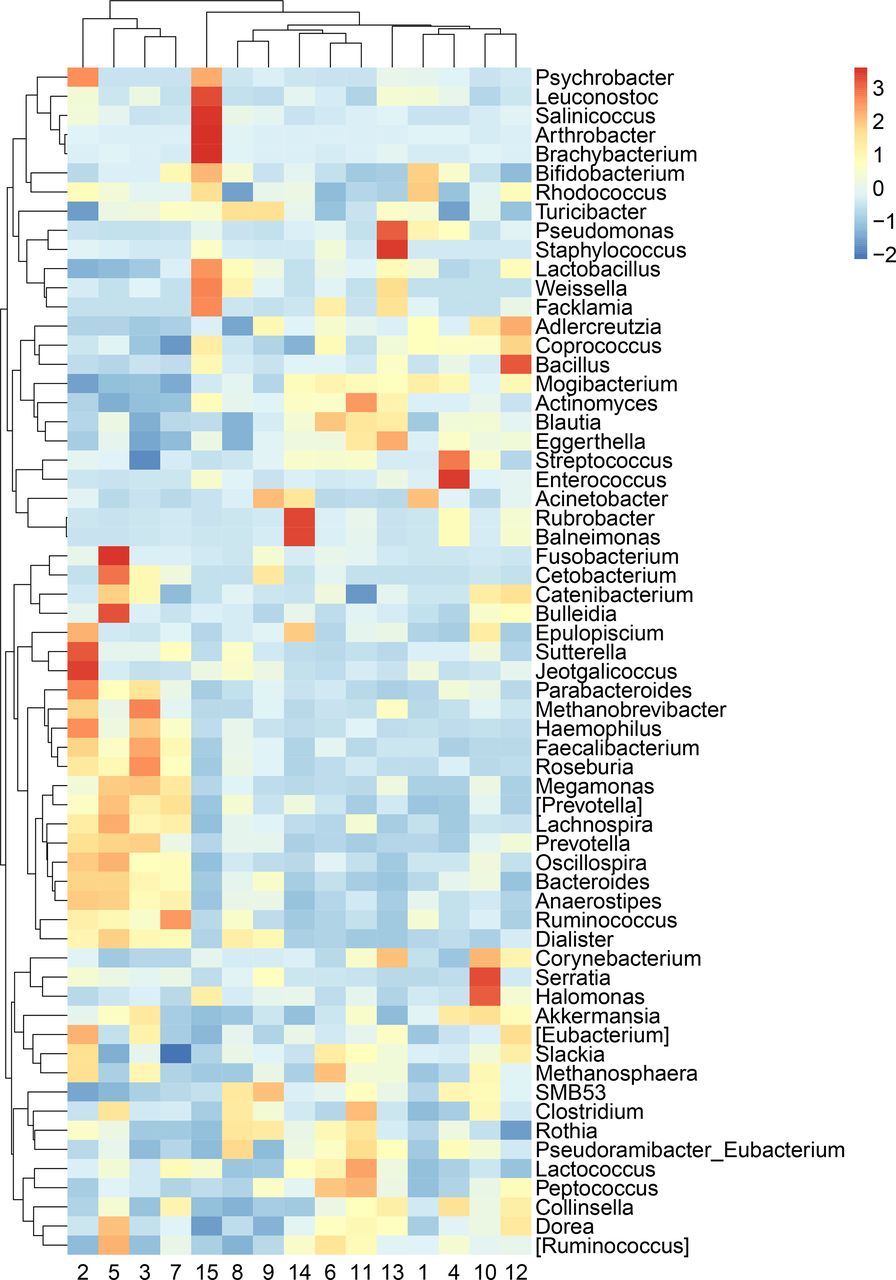
While PERMANOVA tests hypotheses at the community level, it does not provide information about individual taxa. Due to the large differences, we observed in microbial community composition by province/megacity (figure 1a and b), we evaluated differences by province/megacity for each taxon with ANCOM-BC with province/megacity as the only term. At all taxonomic levels from phyla to genus, there were numerous taxa with statistically significant associations with province/megacity (online supplemental table S2A-e). Thus, it is likely that the regional variation we observed is at the broad community level instead of being driven by a small set of individual microorganisms. It is also possible, however, that challenges related to the relative abundance nature of sequencing data make it difficult to reliably identify potential indicator species. When examining the abundance of each taxa within each province, we found that the 15 provinces/megacities showed distinct patterns in taxonomic profiles at all five taxonomic levels, from phylum to genus (figure 2 and online supplemental table S2-5). These large differences emphasise that each province/megacity may have its own gut microbiota ‘fingerprint’ that have presumably formed in response to geographic and cultural differences.

Significant variation of the genera compositions across provinces/megacities analysed with Analysis of Compositions of Microbiomes with Bias Correction (ANCOM-BC). Keys indicate z-scores of the relative abundance of genera. Only genera with relative abundance >0.01% are shown in the figure. The legend for region numbers is shown in figure 1. The ANCOM-BC outputs are shown in online supplemental table S2.
Geographic variation interacts with a broad category of host factors
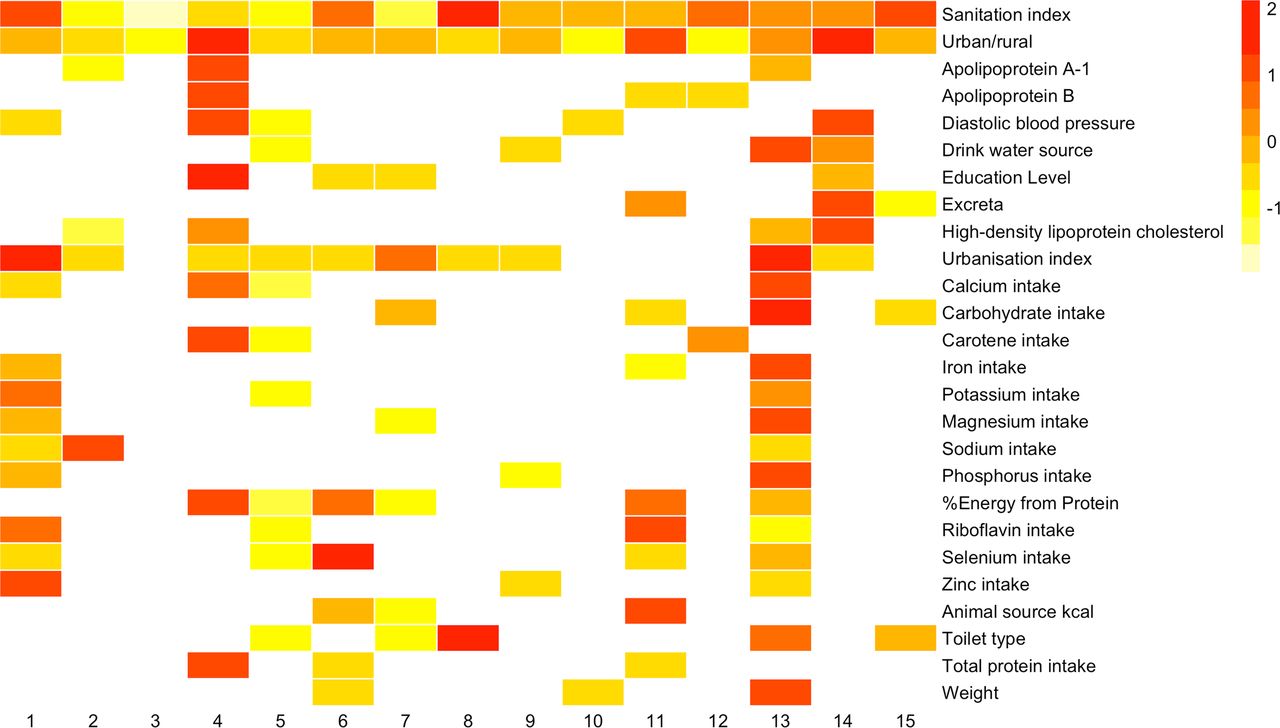
Because geographical region had by far the largest association with microbial community composition, we next built a series of 71 expanded two-way PERMANOVA models for each host factor with terms for the host factor (eg, age, BMI, occupation) as well as a term for province/megacity and an interaction term between the host factor and province/megacity. In these expanded PERMANOVA models, 62 showed heterogeneity (ie, were significant at a 10% FDR threshold for the interaction term) with regards to province/megacity (online supplemental table S3). This large number of significant interactions with province/megacity suggests that each province/megacity tended to have unique associations between host factor categories and the microbiota. As we would expect based on the above analysis, there were large differences in the strength of the associations of host factors in different regions as revealed by one-way PERMANOVA models built for each province (online supplemental table S4 and figure 3). For example, community-level urbanisation index explained 36% of the microbiota variance in Beijing but only 3.2% in Liaoning. The host factors in this cohort were generally well balanced between regions (online supplemental table S5), but we cannot rule out the influence of the regional extent of host factors on their associations with the microbiota.

Variation of estimated effect sizes (R2) of the associations between major host factors and microbial composition in different provinces/megacities. To scale these values for visualisation, for each host factor (rows) PERMANOVA R2 values were z-transformed (to yield the number of SD from the mean) as shown by the key (insert) with no colour indicating an adjusted p-value (FDR)>0.1. Only factors significant in more than two provinces are shown in the figure. The legend for region numbers is shown in figure 1. PERMANOVA, permutational multivariate analysis of variance.
Geographic variation limits the generalisability of models built on the gut microbiota
In order to further explore differences between provinces, we next built a series of random forest models. When building separate models within each province (see the section Methods), we found that 34 of 64 host factors showed significantly improved performance when compared with a control in which the outcome labels (host factors) were shuffled (leftmost two plots in each panel in figure 4). These results demonstrate detectable associations between host factors and the gut microbiota within each province/megacity in our dataset. Binary urbanisation status, sanitation index and continuous urbanisation index were among the factors predicted with the highest accuracy rates (online supplemental table S6A and B).

Within-region and cross-region performance of random forest models predicting host factors from microbial composition. The top panel shows the performance of random forest classification of categorical factors with y axes as true positive rates (TPR). The rest of the panels show the performance of random forest regression of continuous factors with y axes as relative root mean square error (rRMSE). The leftmost plots in each panel are within-region models with training and testing data from the same region. The second to left plots are the same models with randomly shuffled factor categories as outcome labels. The third from left plots are cross-region models (between) with training data from one province/megacity and testing data from each of the other 14 regions. The rightmost plots are the same cross-region models with the host factors randomly shuffled as outcome labels. The TPRs and rRMSEs of models were compared with t-tests, and their means, SD and statistics are shown in online supplemental table S6.
We next tested across provinces/megacities by building models in each province/megacity and using those models to predict results in the other province/megacities. These predictions across provinces/megacities were not significantly better than control models in which the outcomes were randomised (rightmost two plots in each panel in figure 4). The lack of distinguishable difference between models with shuffled and unshuffled data confirms that the associations we observed within each province/megacity were not broadly reproducible across regions.
Discussion
There is increasing evidence that geographic location is strongly associated with human gut microbiota variation.13 14 16 However, this evidence has largely come from comparisons across countries and continents at varying levels of urbanisation, including populations of different ancestral backgrounds. The large area and relative homogeneity of racial composition make China an ideal place to study geographic, cultural, sociodemographic and environmental variation while minimising confounding by race. The sampling of 15 provinces/megacities and well-characterised CHNS data allowed examination of geographic interactions with a variety of individual-level, household-level and community-level factors to test for cross-region consistency of microbiota-factor associations. Using these unique data, we found associations of microbial community composition with host factors within each province/megacity but little evidence of reproducible associations across regions.
In our dataset, geographic location was the strongest explanatory factor for microbial variation, with the 15 provinces/megacities capturing 17.9% of overall gut microbiota variation, while all the other individual-level, household-level and community-level factors each explained less than 1% of the variation. This is consistent with the previous findings suggesting that geography is one of the strongest factors associated with gut microbial variation.14 16 The much higher estimated effect size observed for province/megacity compared with other factors suggests that geographic variance was comparatively more important than dietary (eg, calorie intake, macronutrients composition) or other individual-level lifestyle behaviours (eg, physical activity), or community-level factors (eg, urbanisation, sanitation, access to infrastructure).
The much stronger effect size of region compared with urbanisation in our study (figure 1a,b) suggests that microbial variation may relate more to sociocultural traditions and lifestyles (eg, dietary traditions, lifestyle behaviours) and regional habitats (eg, local food production, soil composition and climate) rather than urbanisation. This is further confirmed by the distinct clustering observed for the microbiota in the three megacities sampled (Beijing, Shanghai and Chongqing) (figure 1A). Chongqing showed a higher dissimilarity to other regions, but the regional effect remained significant even when Chongqing was excluded from the analysis (data not shown).
Our Chinese dataset showed stronger associations between regions and microbial variation than in our comparative analysis using data from the AGP, which showed a lower estimated effect size of US state in relation to microbial variation (5.01%). This could be associated with the higher regional variability of diet, lifestyle and other cultural aspects as well as economy in China compared with the USA. However, these two datasets were different in many systematic factors including sampling strategies and sequencing designs and that may explain some of the differences observed between the two studies. For example, the number of subjects in each geographic region is more heterogeneous in the AGP than in our cohort. In addition, the AGP is a citizen-science initiative, which may have had more variation in sample handling than in our study. It is true, however, that China is in a different stage of urbanisation relative to the USA, and the greater diversity of culture and environments across provinces in China may explain why province is a stronger explanatory factor in our dataset than state is in the AGP. Future studies that process samples from China and America under a common pipeline would provide clarity as to whether differences in sampling or differences in culture explain differences between our study and the AGB.
Our study suggests that the distinct provincial microbial structures may respond differently to diet, lifestyle and other host factors. For example, some genera that consist of lineages known to produce short‐chain fatty acids (SCFAs) varied significantly across provinces/megacities including Blautia, Bacteroidetes, Roseburia and Faecalibacterium (figure 2 and online supplemental table S2).30 SCFAs are not only important for gut health but can also enter the systemic circulation and affect metabolic activities including glucose homeostasis and insulin sensitivity,31 and they are also thought to play important roles in suppressing inflammation, fat accumulation and colonic diseases.32–34 The regional variations in these genera that we observed suggest that subpopulations from different geographic locations may have variable levels of susceptibility to certain diseases. Furthermore, the poor consistency of cross-region associations between microbial variation and host factors suggest that this regional influence may modify the effects of individual-level, household-level and community-level factors on the structure of the gut microbiota. Our study was limited to 16s rRNA gene data, and shotgun metagenome data may provide a more detailed look of the regional variation of gut microbiota. Although this is one of the largest cohorts surveying the geographic variation of gut microbiota, it is possible that the statistical power is not sufficient for some of host factors in individual regions. The p value adjustment for multiple hypotheses may lead to conservative estimates of the associations between microbiota and host factors because of the number of factors included. Future studies using the cultural and geographical diversity in China will generate a better understanding of the underlying mechanisms of regional microbial patterns and how they interact with other factors to drive health outcomes
Conclusion
Our study suggests that geographic region in China may be a major factor underlying gut microbiota variation and that health outcomes linked to the microbiota are likely different in different regions of China. Future studies of microbial variation will be strengthened by explicitly using geographic variation to compare how different gut microbiota create different phenotypes in non-Western populations.
Acknowledgments
The authors thank the National Institute for Nutrition and Health, Chinese Center for Disease Control and Prevention, the Carolina Population Center. We also wish to thank Ms. Frances Dancy Burton for administrative assistance, Ms. Guifeng Jin for database assistance, Ms. Denise Ammons for graphics support and research assistance, and all the people involved in the China Health and Nutrition Survey.
References
Supplementary materials
Supplementary Data
This web only file has been produced by the BMJ Publishing Group from an electronic file supplied by the author(s) and has not been edited for content.
Footnotes
Twitter @ShanSun74281216, @P_Gordon_Larsen
AF, PG-L and BZ contributed equally.
Contributors PG-L, BZ, AF contributed to the conception and design of the work. HW, JZ, CS, ZW and SD contributed to the collection and preparation of data. SS, MCBT, AGH, WS, MS and FF contributed to the analysis and interpretation of the data. SS, AF, MCBT, AGH and PG-L drafted the manuscript, HW, WS, JZ, CS, ZW, SD, MS, FF and BZ contributed to revision of the manuscript. All authors have read and approved the final manuscript.
Funding We are grateful to research grant funding from the National Institute of Health (NIH), National Institute of Diabetes and Digestive and Kidney Diseases (NIDDK) for R01DK104371. We are also grateful to the Eunice Kennedy Shriver National Institute of Child Health and Human Development (NICHD) for R01HD30880 and the NIH Fogarty grant D43TW009077 for financial support for the CHNS data collection and analysis files from 1989 to 2015 and future surveys. We are also grateful for funding from the NICHD to Carolina Population Center at the University of North Carolina at Chapel Hill (NIH grant P2CHD050924). MCBT was funded by the Genetic Epidemiology of Heart, Lung, and Blood (HLB) Traits Training Grant (GenHLB, T32HL129982) from the National Heart, Lung, and Blood Institute (NHLBI).
Map disclaimer The depiction of boundaries on this map does not imply the expression of any opinion whatsoever on the part of BMJ (or any member of its group) concerning the legal status of any country, territory, jurisdiction or area or of its authorities. This map is provided without any warranty of any kind, either express or implied.
Competing interests None declared.
Patient consent for publication Not required.
Ethics approval The study met the standards for the ethical treatment of participants and was approved by the Institutional Review Boards of the University of North Carolina at Chapel Hill and the National Institute of Health and Nutrition, Chinese Center for Disease Control and Prevention.
Provenance and peer review Not commissioned; externally peer reviewed.
Data availability statement Data are available upon reasonable request.
Supplemental material This content has been supplied by the author(s). It has not been vetted by BMJ Publishing Group Limited (BMJ) and may not have been peer-reviewed. Any opinions or recommendations discussed are solely those of the author(s) and are not endorsed by BMJ. BMJ disclaims all liability and responsibility arising from any reliance placed on the content. Where the content includes any translated material, BMJ does not warrant the accuracy and reliability of the translations (including but not limited to local regulations, clinical guidelines, terminology, drug names and drug dosages), and is not responsible for any error and/or omissions arising from translation and adaptation or otherwise.