Article Text

Abstract
Objectives To explore the time trend and geographical distribution of childhood leukaemia incidence over the territory of the Italian region of Sardinia.
Setting All hospitals departments, diagnostic centres and social security agencies in Sardinia were regularly screened in 1974–2003 to identify, register and review the diagnoses of incident cases of haematological malignancies (HM).
Participants The whole child population aged 0–14 resident in Sardinia.
Primary and secondary outcome measures Incidence and time trend of childhood HM and childhood acute lymphoblastic leukaemia (ALL) over the study period, and use of Bayesian methods to plot the probability of areas with excess incidence on the regional map.
Results Overall, 675 HM cases, including 378 ALL cases, occurred among children aged 0–14 years resident in Sardinia in 1974–2003, with an incidence rate of 6.97×10⁻⁵ (95% CI 6.47 to 7.51) and 3.85×10⁻⁵ (95% CI 3.48 to 4.26), respectively. Incidence of HM and ALL showed an upward trend along the study period especially among females. Three communes out of the 356 existing in 1974, namely Ittiri, Villa San Pietro and Carbonia, stand out as areas with excess incidence of HM and ALL in particular and another, Carloforte, for ALL only.
Conclusions Our results might serve as convincing arguments for extending the coverage of routine cancer registration over the whole Sardinian population, while prompting further research on the genetic and environmental determinants in the areas at risk.
- leukaemia
- public health
- paediatric oncology
- epidemiology
This is an open access article distributed in accordance with the Creative Commons Attribution Non Commercial (CC BY-NC 4.0) license, which permits others to distribute, remix, adapt, build upon this work non-commercially, and license their derivative works on different terms, provided the original work is properly cited, appropriate credit is given, any changes made indicated, and the use is non-commercial. See: http://creativecommons.org/licenses/by-nc/4.0/.
Statistics from Altmetric.com
Strengths and limitations of this study
We explored time trends of childhood haemolymphatic malignancies in Sardinia, Italy over 30 years using a regional registry.
Bayesian statistics allowed us to describe the geographical pattern of childhood haemolymphatic malignancies in Sardinia.
The causes of the observed increasing incidence and clustering of childhood acute lymphoblastic leukaemia are still unknown.
Introduction
Childhood leukaemia is known to manifest itself in time/space clusters, which has led to speculations whether chance or specific aetiological agents might be responsible.1 In the past decades, several clusters of childhood leukaemia occurred in different areas of the island of Sardinia, Italy2 3 (Stazi A, personal communication), raising public concern about a possible association with environmental factors or parental exposures. Although, in one instance, it was possible to reject a direct connection with parental exposures,4 an analysis of incidence by age groups and time windows allowed to hypothesise that environmental factors might have indeed generated the observed time/space concentration of cases.5 What the nature of such environmental factors would be, however, was never clarified.
The region of Sardinia is the second largest Mediterranean island, and it is well known for the genetic peculiarities of its population, resulting from millennia of isolation and pressure from malaria.6 While important research projects have addressed the genetic bases of the concentration of male centenarians in specific areas,7 and the high prevalence of neurological diseases, such as multiple sclerosis, among the Sardinian population,8 we are not aware of investigations aiming to identify the varying prevalence of gene polymorphisms implicated in childhood haematological malignancies (HM) in general, and acute lymphoblastic leukaemia (ALL) in particular, over the island. The geographical distribution of the cases can provide clues in this regard.
A cancer registry was active from the 1990s only in northern Sardinia, covering approximately one-third of the regional population. Therefore, from the very beginning of the ‘A. Businco’ Oncology Hospital in 1974 in Cagliari, the capital and major urban centre in Sardinia, the chief oncohaematologist registered and updated all cases of oncohaematology malignancies incident in the regional territory up to 2003, with the collaboration of all the clinical, surgical and pathology departments, social security agencies and health authorities, as described elsewhere.9 The validity and completeness of this database were previously assessed by comparison with mortality and hospitalisation data.10 We used this database to explore time trend and geographical distribution of childhood leukaemia over the territory of Sardinia, Italy.
Material and methods
A detailed description of the database of haemolymphatic malignancies we used in this study can be found elsewhere.9 Briefly, it includes 14 744 incident cases of any haematological cancer, in both genders, and at any age over in the Italian region of Sardinia in 1974–2003. For the purposes of this analysis, we selected the 675 cases occurring among children up to age 14, the cut-off for paediatric age in Italy. For each case, we considered the commune of residence at the time of the diagnosis. Such information was missing for 24/675 cases (3.6%), which, therefore, did not contribute to the analysis of the spatial distribution of the probability of occurrence of the disease.
The resident population of each commune by gender and age groups was available from the 1971, 1981, 1991 and 2001 population censuses. To estimate the resident population in the intercensal years, we extended each census data 4 years onwards and 5 years backwards. The standardised annual incidence rate of all HM, and ALL among the resident child population was calculated along the study period using the person-years of the total regional population for each gender, and age group (0–4, 5–14 years) as the standard. Annual incidence rates were plotted by year, and the Pearson’s correlation coefficient was calculated based on the equation describing the linear regression.
To explore the geographical distributions of HM and ALL, the most common cancer among children under the age of 14, we have used a Bayesian approach to characterise the incidence in each commune, the term used in some European countries to indicate the smallest local administrative unit, that is, town, city or village, which has its own council and governs a territory. The map of the territorial borders of the 356 individual communes existing in 1974 over the region of Sardinia is available online (https:\\umap.geonue.com/en/map/confini-e-dati-statistici-dei-comuni-ditalia_297#8/40.102/8.973). Another 21 were created along the 30 years of follow-up by separation from the original administrative unit, which we kept considering as one for consistency with the initial map. The objective is to identify those communes for which there is a high probability that the incidence rate is higher than average. We interpret this to be the communes for which the incidence probability exceeds some critical value determined from data for the region.
The Bayesian approach11 combines information about the incidence gathered from across the whole regional territory with specific data for individual communes. The key equation is
 [1]
[1]
where P(η|d,I) refers to the posterior probability distribution of the cancer incidence rate η for an individual commune, hereafter referred to as incidence probability, that is, the probability associated with each value of η, after the data d for the commune has been combined with data from the whole regional territory.  is the prior information about the standardised incidence rate, η, of childhood cancer given the background information, I, and is based solely on the regional data.
  is the likelihood function, that is, the probability of getting the measured data d for the commune if we assume that the value of η is true. The term
  does not depend on η; it ensures that the integral of the posterior probability over all possible values of η equals one, that is, that
  is a properly defined probability density function.
The prior summarises what is known about the standardised incidence rate, η, considering solely the regional data. In the definition, the following information is used:
The incidence probability is a number in the interval between 0 and 1.
The condition is rare, implying a low value for the incidence probability.
It is acceptable to use data from the whole island when analysing data at the individual commune level.
A few communes might have incidence probabilities higher than the rest of the island for genetic or geographical factors.
This information is summarised with a β distribution, where the mean is the same as the mean for the whole island, and the mode is half of the mean value. The exact shape of the prior probability density function changes with the age and gender subgroup being considered. The prior for an example can be seen in figure 1; in this particular case, the mean is at 5.8 and the mode is at 2.9. Incident rates above 25 have an approximate probability of 0.

Plot of the prior probability distribution of the haematological malignancies in Sardinia, Italy, the likelihood function, and the posterior probability of a commune taken as an example. There is not a vertical scale to stress the relevance of the shape of the curve. The likelihood function has been rescaled. The thin vertical line indicates the critical value, and it shows that a substantial portion of the posterior probability curve lies beyond it.
Whether an individual child succumbs or not to the disease in a given year is a binomial process. Therefore, the number of cases observed k, in a population of size n, measured in child-years, is best described by a binomial distribution, which, since  , we can approximate with the Poisson distribution, which is
 [2]
[2]
where  is the expected number of cases in a population of size n. Given the number of cases and the population size in each commune, it is possible to calculate the probability of the observed number of cases for all values of η. In figure 1 is the likelihood function for an example commune, which is a function of the incidence probability η. The mode is at 6.9 and there is a wide range of possible incidence rates, 0–35, which are consistent with the observed number of cases.
The posterior probability combines the prior knowledge with the information that can be obtained from the data via the likelihood function, according to Bayes rule, as shown in equation 1. Figure 1 shows the result. This analysis was repeated for the gender and age subgroups within each commune.
If we carry out the same type of analysis for the whole region, the posteriors are almost indistinguishable for any reasonable choice of prior. So, we used a uniform prior to generate the posterior function. Different priors at commune and regional levels are used because different information is available at the two levels. At the commune level, we can use information that was derived at regional level. We then defined the critical value as the value such that the probability that the incidence rate for the region is less than the critical value is 0.999, that is,

where D is the data for the whole region. The data sets d referred to earlier are for the communes and are not identical to the equivalent data D for the region. The choice of 0.999 is arbitrary, but the subsequent analysis is not sensitive to the value chosen. In figure 1, this value is marked by the thin vertical line. The critical values, as calculated at regional level, are given in table 1.
Critical values  calculated using regional data for haemolymphatic cancer among children of age 0–14 in Sardinia, Italy in 1974–2003, by age and gender
We can now calculate the probability for the hypothesis  , that the incidence rate in a commune is higher than the critical incident rate for the whole region

For example in figure 1 the probability of  is very small, as is true of most of the communes. This shows for the commune in the example, the probability that the incidence rate exceeds the critical rate is less than 0.01.
The calculation of the probability of exceeding the relevant critical incidence rate for all childhood haemolymphatic malignancies and childhood acute leukaemia for each commune was carried out using bespoke python code. To allow simpler coding and calculations the critical rates for each group based on the regional data are calculated first, followed by the processing of the commune data. The results are plotted in the regional map (figure 2) using the following colour scales: white <0.17, pale grey 0.17–0.50, medium grey 0.51–0.75, dark grey 0.76–0.95, black >0.95.

Map of 1974–2003 childhood haemolymphatic cancer incidence in Sardinia, Italy. P values of exceeding the threshold incidence rate are presented by commune with the following colour scales: white <0.17, pale grey 0.17–0.5, medium grey 0.5–0.75, dark grey 0.75–0.95, black >0.95. (A) All haemolymphatic cancer; (B) acute lymphoblastic leukaemia.
Patient and public Involvement
No patient or public was involved.
Results
Table 2 shows that the most prevalent diagnosis was acute lymphatic leukaemia (ALL), representing more than 55% of the total cases, 58.1% among females and 53.0% among males. Non-Hodgkin lymphoma followed (18.9%), with a higher prevalence among males (20.6%) in respect to females (16.1%). Hodgkin lymphoma also occurred more frequently among male cases (12.4%) than female cases (9.3%); acute myeloid leukaemia accounted for about 10% of cases in either gender; other lymphoproliferative and myeloproliferative disorders were rarely represented.
Incident cases of haemolymphatic cancer among children of age 0–14 in Sardinia, Italy in 1974–2003, by histology and gender
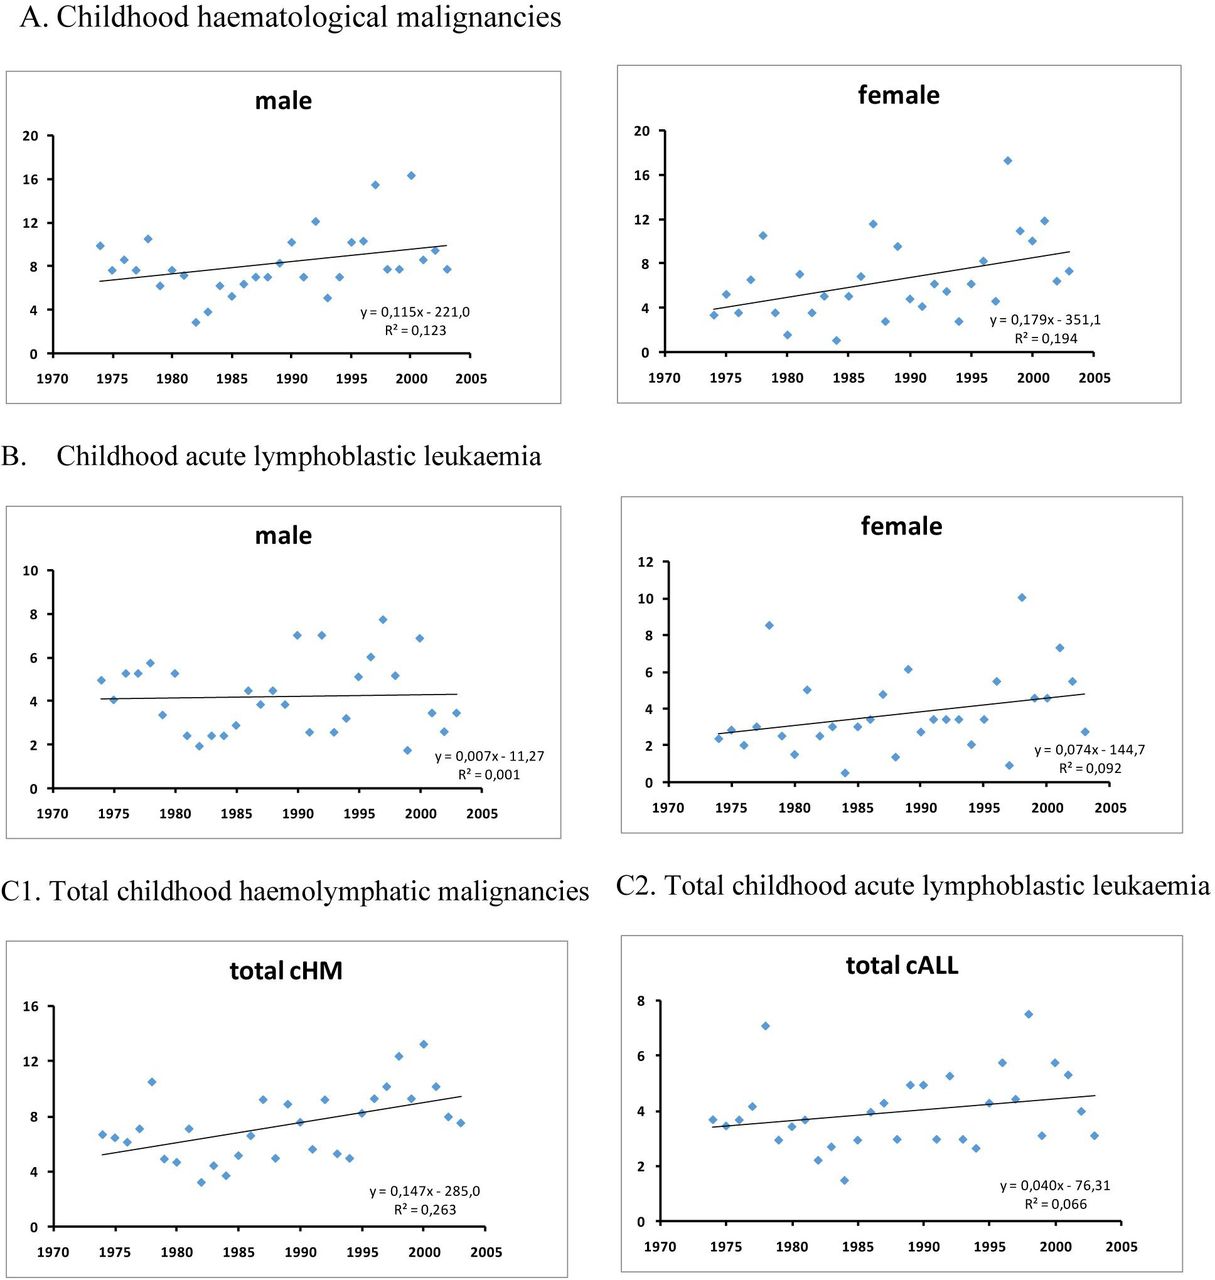
Over the 30 years of observation, the annual age-standardised incidence rate of childhood haemolymphatic cancer was 6.97×10⁻⁵ (95% CI 6.47 to 7.51), 7.93 (95% CI 7.19 to 8.75) among males and 5.96 (95% CI 5.30 to 6.69) among females, with a male/ female ratio of 1.41. The 378 childhood ALL cases corresponded to an overall incidence rate of 3.85×10⁻⁵ (95% CI 3.48 to 4.26), 4.14 (95% CI 3.62 to 4.75) among males and 3.55 (95% CI 3.05 to 4.12) among females, with a male to female ratio of 1:24.
Graphs in figure 3 show the trend of HM and all over the 30-year period, by gender. Incidence of HM increased by 0.12×10⁻⁵ per year on average along the study period (p=0.004). The increasing trend was observed particularly among females (0.18×10⁻⁵ per year, p=0.015). ALL incidence did not increase in the overall population and among males (p=0.868, and p=0.171, respectively), but it did show an increase among females aged 5–14 (0.09×10⁻⁵ per year, p=0.039).

1974–2003 annual incidence rate of total childhood haematological malignancies (cHM) and acute lymphoblastic leukaemia (cALL) in Sardinia, Italy, by gender (A, B) and overall (C1, C2).
Figure 2 maps the probability that the incidence rate of HM and ALL in each commune is above the critical rate, overall and by age, and gender. Three stand out with a probability around or above 95%; these are Carbonia (23 cases, p=0.945), Ittiri (11 cases, p=0.980) and Villa San Pietro (5 cases, p=0.963). Several other communes have a probability ranging 75%–94%, based on three or more cases. On the map, these seem scattered over the regional territory, with no tendency to cluster in specific areas.
The same three communes standing out for HM, also showed a probability above 95% that the incidence of ALL was above the critical rate. Such probability was 0.976 for Carbonia (based on 18 cases), 0.983 for Ittiri (based on 9 cases) and 0.973 for Villa San Pietro (based on 5 cases,). For ALL, a probability above 95% was also observed for Carloforte (0.952, based on six cases). Another six showed a probability between 75% and 94%. Again, these were scattered all over the regional territory, and did not show a tendency to cluster in specific areas.
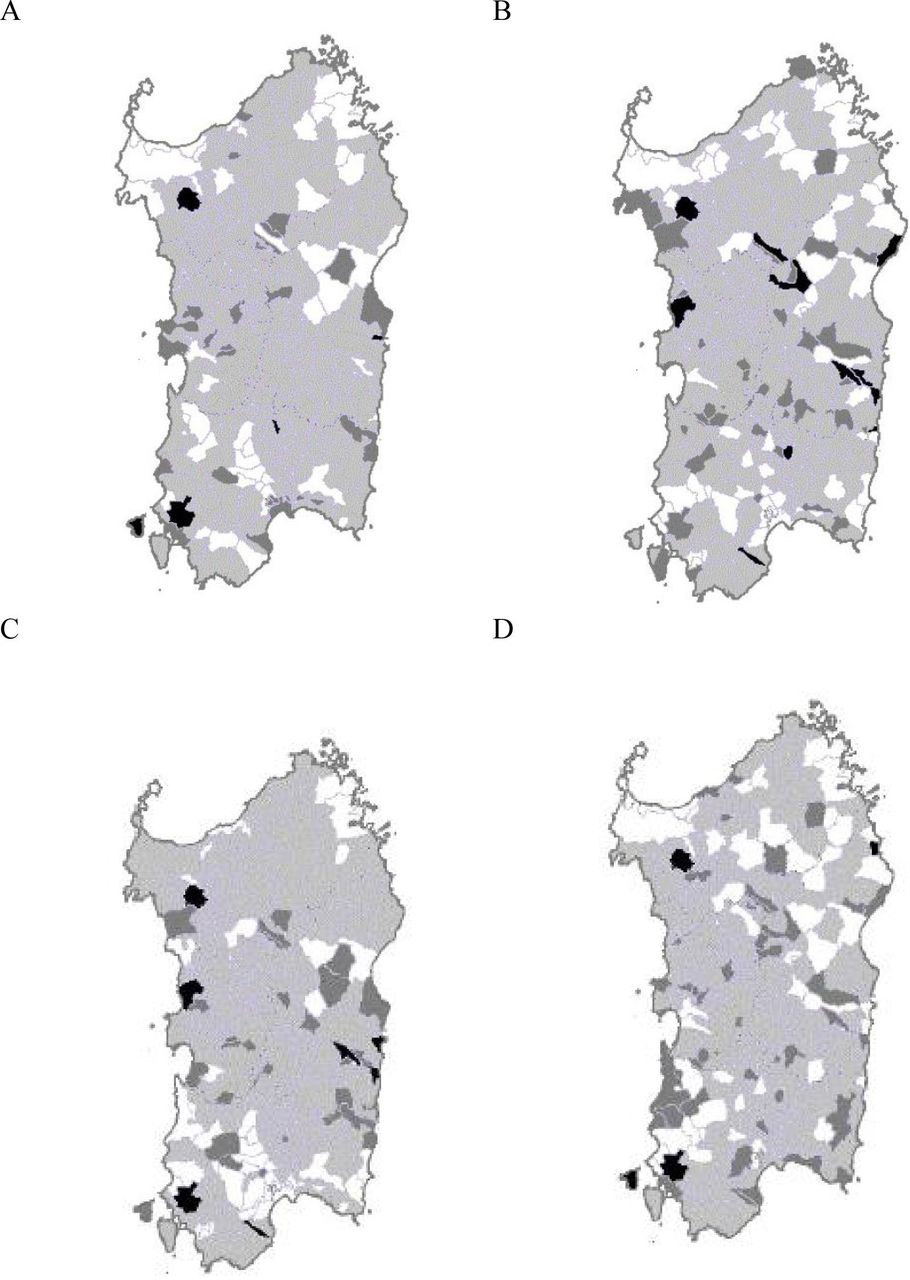
Figure 4 shows the ALL map by age group (0–4 and 5–14 years) and by gender. We explored the distribution of the cases by age groups in the hypothesis that cases occurring at age 5–14 would be less likely related to in utero events in respect to postnatal exposures. One commune only, Ittiri, stands out in both genders and both age groups; communes showing a high probability of an increase in ALL occurrence were more numerous at age 5–14 in respect to age 0–4, and in females in respect to males.

Geographical distribution of the 1974–2003 probability of childhood acute lymphoblastic leukaemia incidence above the threshold by commune in Sardinia, Italy. (A) 0–4 years (M+F); (B) 5–14 years (M+F); (C) females (age 0–14); (D) males (age 0–14).
Discussion
Our results show that the incidence of childhood cancer of the haemolymphopoietic system, and particularly ALL, increased in the Italian region of Sardinia among females; among male children we observed and upward time trend of all haemolymphatic malignancies, while that of ALL was weaker and not significant. The slope of the regression line was apparently steeper for cases occurring between age 5 and 14, which would point out to a postnatal exposure, or to internal migration effects. Apart from chance, we do not have a clear explanation for the gender-specific excesses we observed in several communes.
The excess ALL incidence in Carbonia, Ittiri and Villa San Pietro had been the object of specific cluster analyses,3–5 or published2 and unpublished (Stazi A. personal communication) descriptive reports. In this paper, we detected an ALL excess also in Carloforte. As for the other communes, with probabilities ranging 75%–94%, the chances of a false positive finding appear too large to express a conclusion with the same level of confidence. All these appear to be far apart from each other. One is located in proximity to a large petrochemical plant, but benzene emissions in the surroundings have been reported to be lower than emissions from urban traffic.12 Another is located in south western Sardinia, at a distance of 12 km from a major industrial settlement, which emissions, including mainly lead, cadmium, fluoride, and dust were pointed at as plausible causes of the local ALL cluster in the 1980s. However, a detailed analyses of the cases did not find a relationship with paternal exposures, or specific environmental exposures,4 although the peculiar concentration of cases in specific age groups by birth cohort suggested that some unidentified environmental factors, whether physical, chemical or biological, were most likely to have contributed.5 We are not aware of other environmental factors that might have generated the observed excesses in the other communes. None of them is located nearby the military area which had been the object of unsubstantiated claims of generating hazardous emissions in the surrounding area.10 Uncertainty persists on what environmental factors might play a causative role in ALL, apart from infections in the first year of life.13 14
Other possible explanations include polymorphisms of genes implicated in the pathways leading to childhood leukaemia. Most genetic susceptibility studies have focused on immune function, response to infection, one-carbon metabolism, membrane transport, xenobiotic phase I and phase II metabolism of environmental carcinogens, reactive oxygen species deactivation and DNA repair enzymes.15 Genome Wide Association Studies of B-cell precursor ALL have suggested a polygenic susceptibility to ALL with significant associations with specific loci at chromosomes 7, 9, 10, 12, and 14, and more recently at chromosomes 2 and 8.16
However, although Sardinia is well known for the genetic peculiarities of its population,6 we are not aware of genetic investigations aiming to identify the varying prevalence of gene polymorphisms implicated in ALL. While this might explain excesses located in isolated villages, it would not account for the excess observed in Carbonia. This town was ex novo built in 1936–1938 to host the coal miner families coming from all over Italy to work in the local coal mines. Herd immunity has been called as responsible of ALL clusters in the so called ‘new towns’13; however, around five decades had passed between Carbonia foundation and the occurrence of the ALL cluster. Also, the population living in the small island of Carloforte has different ethnic origin than the population of mainland Sardinia, originating from Genovese prisoners who moved there from the Tunisian site of Tabarka in 1738. It is unclear whether this might be related to the excess incidence of ALL observed in Carloforte.
One possible alternative explanation of the clustering of ALL cases in specific areas and within specific time frames might be the special ability of the local family physician/s in detecting the disease, and in referring the sick children to the haematology departments. Such ability might have increased along the study period, generating a spurious increasing trend,9 and might also have spuriously generated the geographical differences we observed. However, we observed an increasing trend mainly in females, while we would have expected a spurious increasing trend to clearly show up in both genders, unless the diagnostic ability differed by gender, which seems unlikely. Post-diagnosis relocation of the families seems also unlikely to have occurred, as the excesses occurred mainly in small towns and villages, and not in the major urban areas where the hospitals with the specialist oncohaematology units are located.
Concern in interpreting our results might be raised because of the wide range in population size between communes, from less than 100 to more than 150 000, which would be reflected by the childhood population at risk. To minimise the number of false positive findings related to random variations in the observation of a small number of events, we first set at p<0.001 the critical value in the prior probability distribution of the standardised incidence rate with reference to the prior expectation. Then, in each commune, we considered the posterior probability of exceeding that critical value.
An advantage of our study is that the diagnoses were all reviewed by the same expert haematologist (GB), thus preventing bias due to the varying diagnostic ability by time and geographical area, and minimising and spreading equally the probability of misdiagnosis over the whole region and along the study period.
Along the period covered by our follow-up study, a cancer registry was active only in northern Sardinia, covering two local health units and approximately 30% of the regional population. A second cancer registry started operating in 2006, 3 years after the end of recruiting incident childhood HM cases for the data base we herein analysed, covering two local health units in the central-eastern area of the region and extending the coverage to 43% of the regional population.17 Therefore, a study such as the one we conducted would not have been possible if not by collecting and reviewing personally the incident cases, with the support of the clinical departments and health authorities over the whole region. Possible reasons for the delay in extending the coverage also to the rest of the region have been discussed10; plans to create a regional cancer registry covering 100% of the regional population started about 15 years ago, and they might be implemented in the near future.
Conclusion
This is the first report describing time trends over 30 years and the geographic pattern of haemolymphatic malignancies in Sardinia, a special region for studying the interaction between gene polymorphisms and environmental factors. Our results will hopefully prompt further research, and might serve as convincing arguments for extending the coverage of cancer registration over the whole Sardinian population, and for distributing the necessary paediatric haematology resources to better match the local needs.
References
Footnotes
Funding The authors have not declared a specific grant for this research from any funding agency in the public, commercial or not-for-profit sectors.
Map disclaimer The depiction of boundaries on this map does not imply the expression of any opinion whatsoever on the part of BMJ (or any member of its group) concerning the legal status of any country, territory, jurisdiction or area or of its authorities. This map is provided without any warranty of any kind, either express or implied.
Competing interests None declared.
Patient consent for publication Obtained.
Ethics approval The Ethics Committee of the Cagliari University Hospital approved the use of these data for the purposes of scientific publication (Protocol No. PG 2019/18070, 18 December 2019).
Provenance and peer review Not commissioned; externally peer reviewed.
Data availability statement Data are available on reasonable request. Data are preserved in the archives of the department of Medical Sciences and Public Health of the Cagliari University in aggregated form, and they are publicly available as such. Please contact PC (pcocco@unica.it) for any request.