Article Text

Abstract
Objectives Composite diagnostic criteria alone are likely to create and introduce biases into diagnoses that subsequently have poor relationships with input symptoms. This study aims to understand the relationships between the diagnoses and the input symptoms, as well as the magnitudes of biases created by diagnostic criteria and introduced into the diagnoses of mental illnesses with large disease burdens (major depressive episodes, dysthymic disorder, and manic episodes).
Settings General psychiatric care.
Participants Without real-world data available to the public, 100 000 subjects were simulated and the input symptoms were assigned based on the assumed prevalence rates (0.05, 0.1, 0.3, 0.5 and 0.7) and correlations between symptoms (0, 0.1, 0.4, 0.7 and 0.9). The input symptoms were extracted from the diagnostic criteria. The diagnostic criteria were transformed into mathematical equations to demonstrate the sources of biases and convert the input symptoms into diagnoses.
Primary and secondary outcomes The relationships between the input symptoms and diagnoses were interpreted using forward stepwise linear regressions. Biases due to data censoring or categorisation introduced into the intermediate variables, and the three diagnoses were measured.
Results The prevalence rates of the diagnoses were lower than those of the input symptoms and proportional to the assumed prevalence rates and the correlations between the input symptoms. Certain input or bias variables consistently explained the diagnoses better than the others. Except for 0 correlations and 0.7 prevalence rates of the input symptoms for the diagnosis of dysthymic disorder, the input symptoms could not fully explain the diagnoses.
Conclusions There are biases created due to composite diagnostic criteria and introduced into the diagnoses. The design of the diagnostic criteria determines the prevalence of the diagnoses and the relationships between the input symptoms, the diagnoses, and the biases. The importance of the input symptoms has been distorted largely by the diagnostic criteria.
- frailty
- bias
- forward-stepwise regression
- the health and retirement study
- index mining
This is an open access article distributed in accordance with the Creative Commons Attribution Non Commercial (CC BY-NC 4.0) license, which permits others to distribute, remix, adapt, build upon this work non-commercially, and license their derivative works on different terms, provided the original work is properly cited, appropriate credit is given, any changes made indicated, and the use is non-commercial. See: http://creativecommons.org/licenses/by-nc/4.0/.
Statistics from Altmetric.com
Strengths and limitations of this study
The prevalence of three mental illnesses was determined by the prevalence of the input symptoms and modified by the diagnostic criteria and correlations between the input variables in simulated populations.
Biases due to data censoring or categorisation were created by the diagnostic criteria and introduced into the intermediate variables and the three diagnoses of mental illnesses in simulated populations.
The diagnostic criteria modified the importance of the input symptoms; certain input symptoms or bias variables were weighted more than expected in simulated populations.
The design of diagnostic criteria influenced the diagnosis prevalence. With the same input symptom prevalence, dysthymic disorder was the most prevalent among three illnesses. Major depressive episodes were the least prevalent.
This study is based on simulated data and needs to be verified with real-world data.
Background
The diagnoses of several mental illnesses in patients are often made based on a variety of criteria. These criteria often involve symptoms reported by the patients.1–3 For example, the diagnosis of major depressive disorder defined in the Diagnostic and Statistical Manual of Mental Disorders, 4th Edition, Text Revision (DSM-IV-TR) requires at least one major depressive episode.1 2 For each major depressive episode, the major criteria are ‘depressive mood and/or loss of interest or pleasure in life activities for at least 2 weeks’.1 2 In addition to the major criteria, the patients need to report at least five of the nine symptoms that ‘cause clinically significant impairment in social, work or other important areas of functioning almost every day,’ including insomnia or hypersomnia and fatigue or loss of interest.1 2 In other words, patients need to meet both the major and minor criteria before being diagnosed with a major depressive episode.
Historically this symptom-based diagnostic approach developed by Feighner et al has been widely accepted.4 5 Since then, mental illnesses can be diagnosed through different sets of criteria. This approach is important because clinicians become capable of screening important symptoms before diagnosing and treating patients accordingly. In fact, these criteria can also be seen as composite measures that use multiple measures to capture disorders that may not be quantified with single variables.6 7 Recent studies on composite measures have found composite diagnostic criteria problematic because biases can be introduced while aggregating information from input variables.7 The biases emerge while the sums of input variables are censored or while input variables are transformed inadequately.7 8 In other words, biases can be created when there is information in the composite measures that is not explained by and unrelated to the input variables.7 For example, categorising continuous variables considers individuals in the same group homogenous and disregards the heterogeneity between individuals in the same categories.7 Such practices induce biases and decrease measurement precision.7 8
Currently, there is no extensive review on the existence of these biases created by composite measures or medical diagnoses, and only selected diagnoses have been studied for such biases. These biases have been proven vital to another symptom-based composite measure, the diagnosis of frailty, a condition that often occurs in the elderly and is significantly associated with health outcomes, such as mortality, falls, and morbidity.7 Frailty is diagnosed based on several symptoms and characterised by weakness and vulnerability to adverse health events.7 While using one of the most widely used diagnostic criteria, the Biological Syndrome Model scores, to diagnose frailty,9 biases alone can explain more than 71% of the variances of the frailty diagnosis.7 The biases introduced by data censoring and data categorisation can better explain the frailty diagnosis than the input symptoms.7
Mostly designed as symptom-based composite measures, it is possible that the diagnostic criteria of mental illnesses also create and introduce biases into diagnoses so that the diagnoses could not be fully explained by the input symptoms. In concern of the biases created by the diagnostic criteria alone, this study aims first to understand the relationships between mental symptoms and diagnoses and then to quantify the potential role of the biases regarding the diagnoses by simulating populations with different prevalence rates and between-variable correlations of mental symptoms.
Methods
Assumptions and simulation parameters
A file containing R codes to reproduce the simulations was attached in the online supplemental file 1. Simulated populations with mental symptoms of different prevalence rates and between-variable correlations were created to interpret the diagnoses and understand the potential magnitudes of biases that could be introduced via data processing implied by the diagnostic criteriaonline supplemental file 1. Three diagnoses of mental illnesses were chosen for the leading associated disease burdens2: major depressive episodes for the diagnosis of major depressive disorder, dysthymic disorder, and manic episodes for the diagnosis of bipolar disorder.1
Supplemental material
There were assumptions made to simulate the populations (table 1). First, for each simulation, the prevalence rates of the input symptoms were assumed to be similar for the three diagnoses in this study. Second, the input symptoms for the diagnoses of major depressive episodes and dysthymic disorder correlated with the same correlation coefficients.10 The symptoms for the diagnosis of manic episodes correlated to one another. Third, the input symptoms for the diagnosis of manic episodes were created independently of those for the diagnosis of the other two mental illnesses. The assumptions of the prevalence rates and between-variable correlations were made because there was no acceptable-quality data on the symptoms of mental illnesses published and we needed to examine various combinations of these epidemiological measures. There were studies on the prevalence of mental illnesses,11 12 but the information on the prevalence of mental symptoms was very limited. There were variables about depression or anxiety collected in national surveys, such as the items collected through the Center for Epidemiologic Studies Depression Scale.7 13–19 However, these variables were not the symptoms used in the DSM-IV-TR. Lastly, we assumed that the diagnoses were made accurately based on the input symptoms reported precisely by patients and the diagnostic criteria in the DSM-IV-TR were strictly followed. However, these assumptions did not hold in the real world.20 For simplicity and practicality reasons, we assumed perfect diagnostic quality by physicians and accurate reporting of the input symptoms by patients in the simulated populations.
The assumptions and parameters in the simulations
Diagnostic criteria as mathematical functions
The input symptoms were extracted from the major and minor criteria of the diagnoses and listed in tables 2–4. The input symptoms, major and minor criteria, and the diagnoses were assigned variable names. All input symptoms, items or domains in the major or minor criteria, and the diagnoses were binomial variables, presenting 0 and 1 for the absence and presence of the symptoms, criteria or the diagnoses, respectively. For example, two symptoms, ‘insomnia’ and ‘hypersomnia’, were extracted from one of the minor criteria for the diagnosis of major depressive episodes.1 Two other symptoms, ‘more talkative than usual’ and ‘pressure to keep talking’, were extracted from one of the minor criteria for the diagnosis of manic episodes.1
The input symptoms, intermediate variables and bias variables for the diagnosis of major depressive episodes based on the Diagnostic and Statistical Manual of Mental Disorders, Fourth Edition, Text Revision
The input symptoms, intermediate variables and bias variables for the diagnosis of dysthymic disorder based on the Diagnostic and Statistical Manual of Mental Disorders, Fourth Edition, Text Revision
The input symptoms, intermediate variables and bias variables for the diagnosis of manic episodes based on the Diagnostic and Statistical Manual of Mental Disorders, Fourth Edition, Text Revision
Mathematical functions were generated based on the diagnostic criteria to convert input symptoms into diagnoses. For example, one of the minor criteria of dysthymic disorder was ‘poor appetite or overeating.’ This required two input symptoms and one bias variable to generate the criterion.7 In other words, ‘poor appetite or overeating’ equalling the sum of two input variables, ‘poor appetite’ and ‘overeating,’ and a bias variable to achieve censoring of the sum of both variables.7 The sum of two binomial variables could be 0, 1 and 2 for the subjects. However, to derive a binomial variable (having at least one symptom) based on a distribution of 0 to 2, the bias variable had values of −1 for subjects with both symptoms to obtain values less than or equal to one in all subjects.7 Therefore, the bias variable had values of −1 for the subject with both symptoms and 0 for the other subjects. In addition to adding variables together to derive an intermediate variable or a diagnosis, multiplication, categorisation, and other more complicated methods were used in the diagnostic criteria to generate diagnosis variables and domain variables in the major or minor criteria.
For example, the diagnosis of dysthymic disorder required the confirmation of both the major criteria, ‘depressed mood most of the day for more days than not, for at least 2 years’ and the minor criteria, ‘the presence of two or more of the following symptoms,’ at the same time.1 The diagnosis based on whether subjects meeting both the major and minor criteria of dysthymic disorder is the same as identifying those with a multiplicative product of 1 of two binomial variables (0 and 1 for absence and presence of the major or minor criteria). In the equations, two binomial variables were multiplied to confirm the diagnosis of dysthymic disorder among those with a multiplicative product of 1. Individuals could be assigned with 0 or 1 for whether they met both criteria, while the sum of major and minor criteria were 0, 1 or 2 for the individuals. Linearly, a bias variable with values of −1 or 0 was created and those meeting both the major or minor criteria were assigned with −1.7 For categorisation of continuous variables, bias variables were required to remove the variations between the subjects in the same categories.7 Other equations to generate the intermediate variables and the diagnoses were listed and explained in tables 2–4.
Generation of bias variables
Bias variables could be generated while binomial input symptoms were summed or multiplied to obtain binomial intermediate or diagnosis variables (see the example in the previous two paragraphs).7 A visual presentation of how bias variables were generated was published.7 Therefore, the number of bias variables depended on the complexity of how the diagnoses were made. For example, six of the nine items or domains in the minor criteria for the diagnosis of major depressive episodes were the censored sums of the input symptoms and six bias variables were derived along with the intermediate variables that represented the items in the minor criteria. All bias variables were described in tables 2–4.
Simulation parameters and simulated populations
We simulated populations of 100 000 subjects. There were five prevalence rates to simulate the input symptoms for the diagnosis of major depressive episodes, dysthymic disorder and manic episodes: 0.05, 0.1, 0.3, 0.5 and 0.7. The correlations between the input symptoms were hypothesised to be 0, 0.1, 0.4, 0.7 and 0.9. There were 25 combinations of the assumed prevalence rates and between-variable correlations. The presence of the input symptoms was randomly assigned to the subjects after specifying the prevalence rates and between-variable correlations between the input symptoms.21 22 The intermediate and diagnosis variables were derived according to the equations in tables 2–4. For each combination of prevalence rates and between-variable correlations, the populations were simulated for 100 times to obtain the mean values and 95% CIs of derived prevalence rates, as well as the adjusted R squared and p values derived by approximating the diagnosis variables.
Diagnosis approximation
Due to the existence of the biases, the input symptoms were not likely to fully explain the diagnoses.7 Therefore, the diagnoses were approximated by the input, bias and intermediate variables individually and collectively.7 13 15 17 The approximation was conducted using forward-stepwise linear regressions.7 13 15 17 23 The interpretability of the diagnoses by the input symptoms and bias variables was assessed via adjusted R square ranging from 0 to 1: 0 suggested that the input symptoms were unrelated to the diagnosis, and 1 suggested that the input symptoms perfectly explained the diagnosis.15 16 24–27
All statistical analyses were conducted within the R environment (V.3.4.1)28 and RStudio (V.1.0.153).29 Two-tailed p values less than 0.05 were considered statistical significant.
Patient and public involvement
This is a simulation study that did not involve patients or human subjects.
Results
The derived prevalence rates of the input symptoms for the three mental illnesses matched the assumed rates in the online supplemental file 1. The derived correlations between the input symptoms were close to assumed levels in the online supplemental file 1. The simulations were successful and accurate based on the assumed prevalence rates and correlations.
Prevalence of intermediate variables
The items in the major and minor criteria were the intermediate variables necessary to create the diagnoses. The methods used to generate the intermediate variables were important for the prevalence rates of the intermediate variables and the derived diagnoses in figure 1. For example, an intermediate variable, ‘significant unintentional weight loss or gain,’ was created by summing and censoring two binomial variables with values of 0 and 1 (significant unintentional weight loss; significant unintentional weight gain). The prevalence rates of the intermediate variables were larger than those of the two input symptoms regardless of the assumed prevalence rates or between-variable correlations of the input symptoms.

The prevalence rates of an intermediate variable for the diagnosis of major depressive episodes by assumed input symptom prevalence and correlations. The intermediate variable is ‘significant unintentional weight loss or gain’ and the input symptoms are ‘significant unintentional weight loss’ and ‘significant unintentional weight gain.’ The black line represents the situation where the prevalence rates of the input symptoms are the same as that of the intermediate variable. Lines above the black lines have the prevalence rates of the intermediate variable larger than those of the input symptoms. CI, confidence interval.
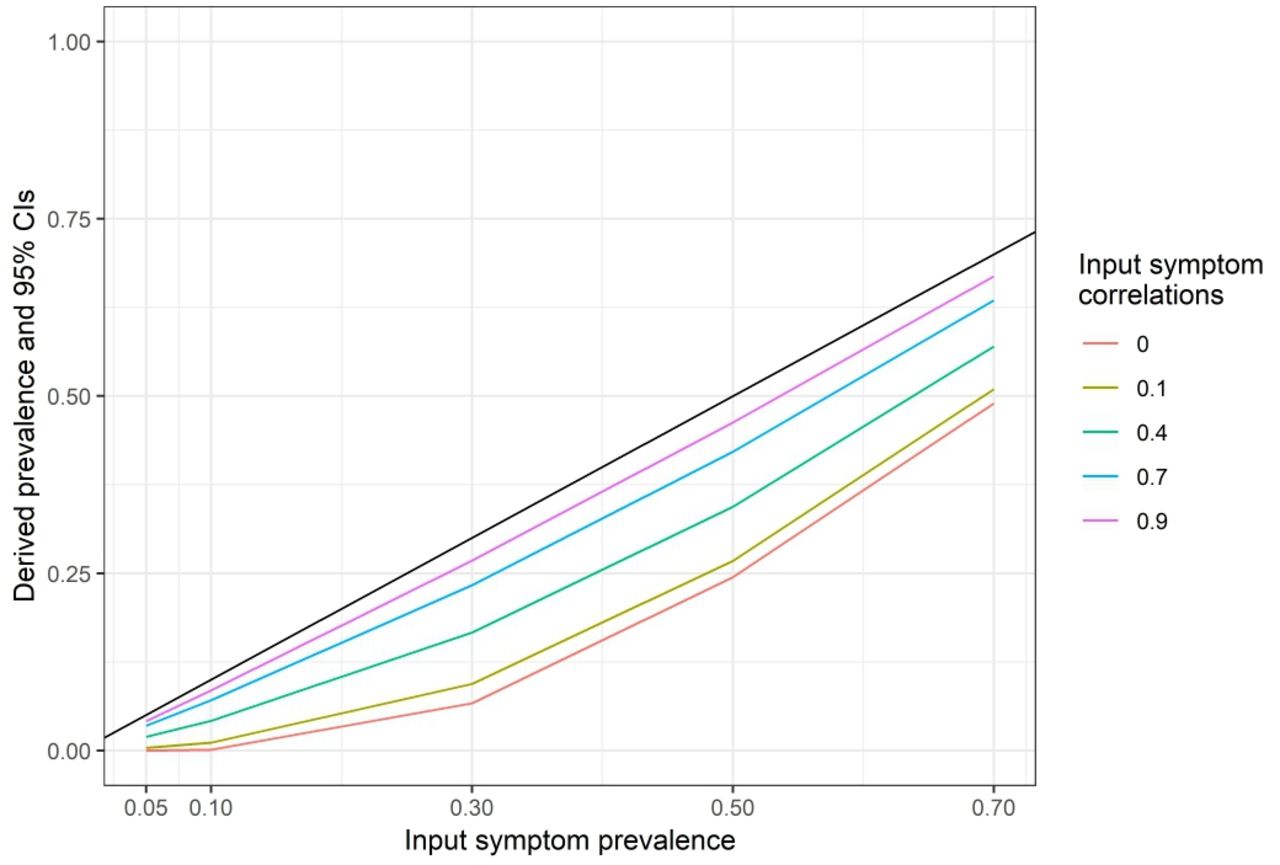
In contrast, the diagnosis of dysthymic disorder was a multiplication product of two intermediate binomial variables, the major and minor criteria and the prevalence rates of dysthymic disorder were lower than those of the major or minor criteria under all combinations of the assumed correlations and prevalence rates of the input symptoms in figure 2.

The prevalence rates of dysthymic disorder by assumed input symptom prevalence and correlations. Dysthymic disorder is diagnosed when both the major (depressed mood most of the day for more days than not, for at least 2 years) and minor criteria (at least two of the six items) are met. The black line represents the situation where the prevalence rates of the input symptoms are the same as those of dysthymic disorder. Lines below the black lines have dysthymic disorder prevalence rates lower than those of the input symptoms. CI, confidence interval.
The prevalence rates of major depressive episodes by assumed input symptom prevalence and correlations. Major depressive episodes are diagnosed when both major and minor criteria are confirmed. The black line represents the situation where the prevalence rates of the input symptoms are the same as that of major depressive episodes. Lines below the black lines have the prevalence rates of major depressive disorder lower than those of the input symptoms. CI, confidence interval.
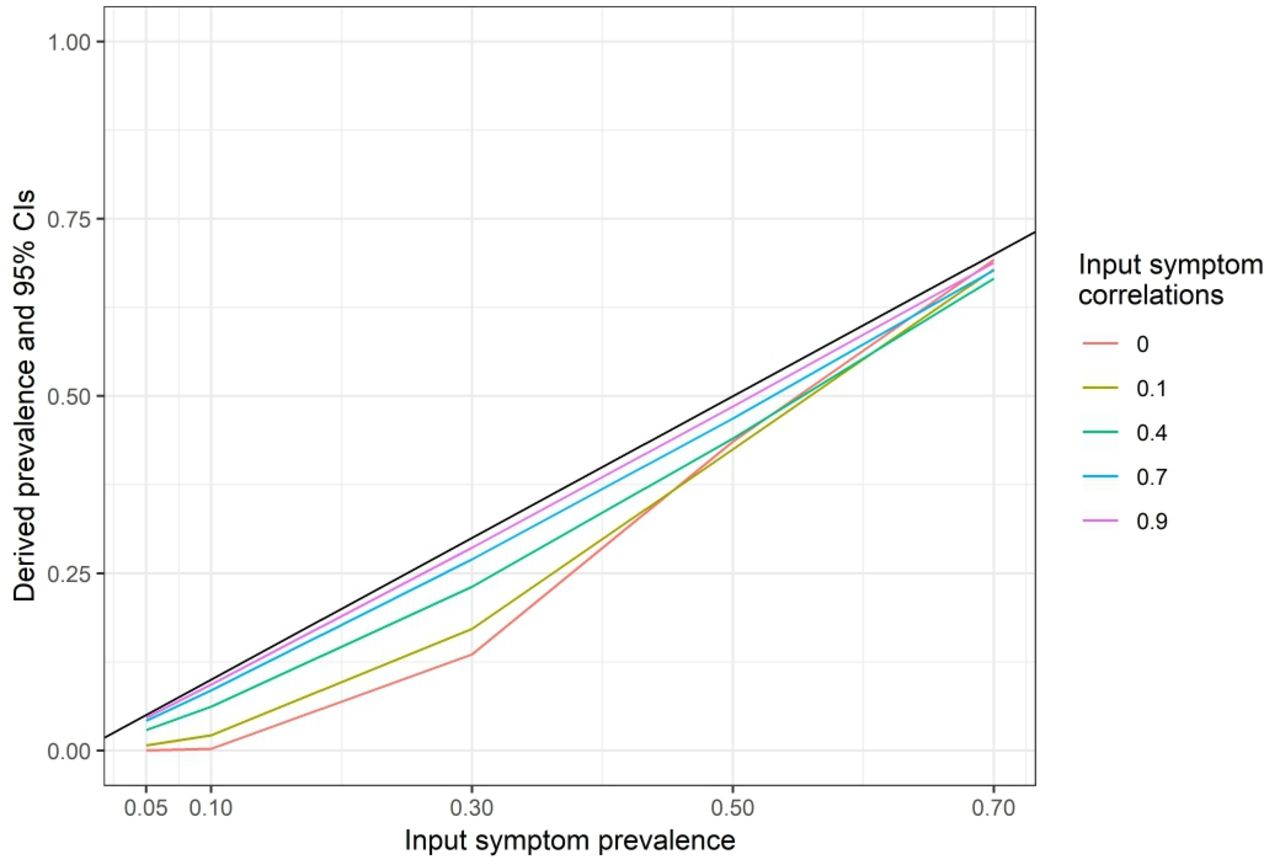
The prevalence rates of manic episodes by assumed input symptom prevalence and correlations. Manic episodes are diagnosed when the symptoms present as described in the diagnostic manual. The black line represents the situation where the prevalence rates of manic episodes are the same as those of the input symptoms. Lines below the black lines have prevalence rates of manic episodes lower than those of the input symptoms. CI, confidence interval.
Prevalence of mental illnesses
The derived prevalence rates of three diagnoses were plotted against the assumed prevalence rates and correlations of the input symptoms in figures 2–4 and listed in table 5. None of the three diagnoses had prevalence rates exceeding those of the input symptoms. In general, higher prevalence rates or between-variable correlations of the input symptoms were associated with higher prevalence rates in the three diagnoses, except for manic episodes that had higher prevalence rates (0.692) assuming 0 correlations and 0.7 prevalence rates than the prevalence rate (0.679) assuming 0.1 correlations and 0.7 prevalence rates of the input symptoms. When compared across figures 2–4, given the same assumed prevalence rates and between-variable correlations of the input symptoms, the diagnostic criteria of dysthymic disorder consistently generated diagnoses of the highest prevalence rates and the criteria of major depressive episodes created diagnoses of the least prevalence rates (see table 5 for details).
The derived prevalence rates of the diagnoses of major depressive episodes, dysthymic disorder, and manic episodes based on the assumed prevalence rates and between-variable correlations of the input symptoms
Associations between the diagnoses and input symptoms or bias variables
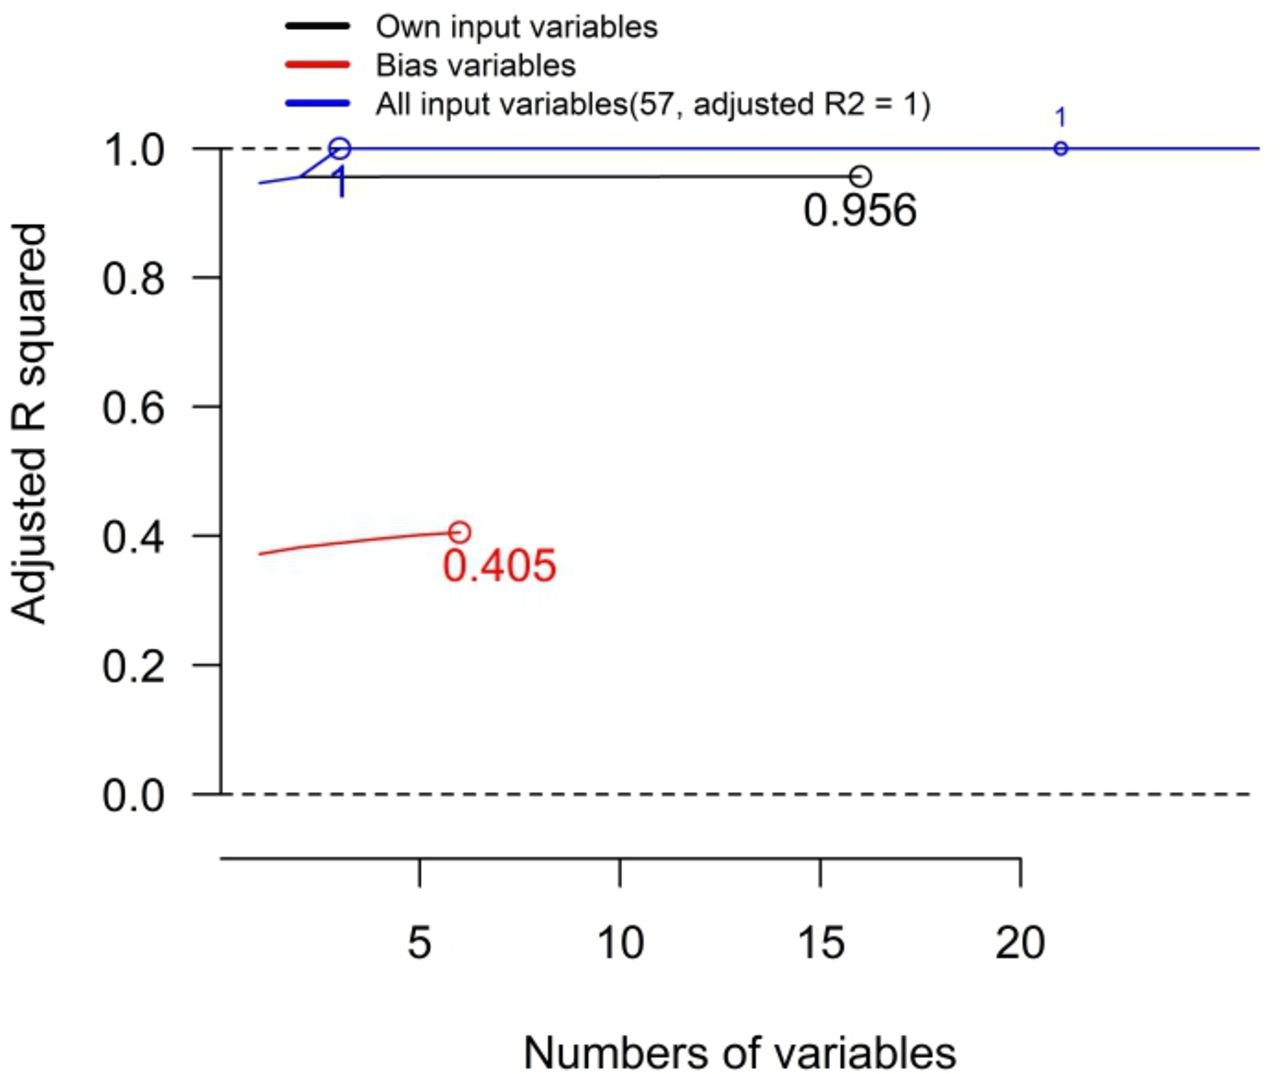
The diagnoses were first interpreted with the input symptoms (including intermediate variables) and the bias variables individually. The diagnosis of dysthymic disorder, for example, was interpreted with the input symptoms, the bias variables, and both in figure 5. For each simulation, the diagnosis of dysthymic disorder was approximated with an increasing number of the input symptoms, the bias variables or both. After selecting the variables that best approximated the diagnosis based on adjusted R-squared, the input symptoms could explain a proportion of 0.956 of the diagnosis variance and the bias variables could explain at most a proportion of 0.405 of the diagnosis variance in figure 5. With all variables used in the regression, the diagnosis could be perfectly explained by the input symptoms and bias variables (adjusted R-squared=1). The individual input symptoms and the bias variables that individually best explained the diagnoses are listed in tables 6 and 7, respectively.

The approximation of the diagnosis of dysthymic disorder by input symptoms, bias variables and both, measured by R-squared. The diagnosis of dysthymic disorder is approximated by all variable, including input symptoms and bias variables, using forward-stepwise regression. The selection of the variables was determined by adjusted R-squared. Circles are the maximal adjusted R-squared achieved by the regression with input symptoms, bias variables, or both of them. See table 4 for the details in the input symptoms and the bias variables. The assumed correlations between the input symptoms are 0.4 and the assumed prevalence rates of the input symptoms are 0.7 in this figure.
The individual input symptoms that best explained the diagnoses based on adjusted R-squared: major depressive episodes, dysthymic disorder and manic episodes by assumed input symptom prevalence and correlations
The individual bias variables that best explained the diagnoses based on adjusted R-squared: major depressive episodes, dysthymic disorder and manic episodes by assumed input symptom prevalence and correlations
For the diagnosis of major depressive episodes, the first or second items in the major criteria (variable names: mde_ma1 or mde_ma2 in table 2) individually best explained the diagnosis depending on the assumed prevalence rates and correlations in table 6. For the diagnosis of dysthymic disorder, the major criteria (dys_ma in table 3) consistently and individually explained the diagnosis the best. For the diagnosis of manic episodes, the third item of the major criteria (man_ma3 in table 4) individually best explained the diagnosis in all combinations of assumed prevalence rates and correlations. However, the proportions of diagnosis variances best explained by individual input symptoms varied widely between 0.001 and 0.974, depending on the assumed prevalence rates and between-variable correlations. Based on a high correlation with the diagnoses, certain input variables or symptoms were more important than others, such as the major criteria for the diagnosis of dysthymic disorder. The prevalence rates and between-variable correlations were important to determine the relationships between input symptoms and diagnoses.
Similarly, there were bias variables that consistently best explained the diagnoses in table 7. For the diagnosis of major depressive episodes, the biases due to categorisation of the numbers of confirmed input symptoms (mde_bias1 and mde_bias2 in table 2) were the leading bias variable. The diagnosis of major depressive episodes not explained by the input symptoms or information censoring (mde_bias in table 2) was the leading bias variable in two combinations of the assumed prevalence rates and correlations. For the diagnosis of dysthymic disorder, the residual of the diagnosis not explained by the major and minor criteria (dys_bias in table 3) and the bias due to the categorisation of the confirmed input symptoms in the minor criteria (dys_mi_bias) were the leading bias variables. For the diagnosis of manic episodes, the bias due to the categorisation of the number of confirmed input symptoms in the minor criteria up to three (man_bias1 in table 4) was the leading bias variables, except for two combinations of the assumed prevalence rates and correlations, in which the bias due to categorisation of the confirmed input symptoms in the minor criteria up to four (man_bias2 in table 4) best explained the diagnosis. However, the proportions of diagnosis variances explained by individual bias variables varied widely from 0 to 0.87. Depending on the assumed prevalence rates and between-variable correlations of the input symptoms, certain bias variables were more important than other bias variables and even some input variables. The assumed prevalence rates and between-variable correlations were important factors for the relationships between the bias variables and the diagnoses.
In general, the proportions of the diagnosis variance that could be explained by either individual input symptoms or single bias variables were low when the prevalence rates and between-variable correlations of the input symptoms were assumed to be low. With higher assumed prevalence rates or correlations, the proportions of the diagnoses explained by the single input symptoms or bias variables were higher. Across three diagnoses, the diagnosis of dysthymic disorder could be better explained by single input variables (higher adjusted R-squared), and the diagnosis of major depressive episodes was associated with the least adjusted R-squared. The bias variables of the diagnosis of manic episodes could explain the diagnosis individually better than the bias variables of the other two diagnoses.
Approximating the diagnoses with input symptoms
When the diagnoses were approximated by all of their own input symptoms (table 8), there were always some diagnosis variances that could not be explained by the input symptoms. In other words, the input symptoms together could not fully explain the diagnoses, except for the diagnosis of dysthymic disorder that could be fully explained by the input symptoms (adjusted R-squared=1) assuming 0 between-variable correlations and 0.7 prevalence rates for the input symptoms. In table 8, the proportions of diagnosis variances explained by input symptoms increased with higher assumed prevalence rates or between-variable correlations of the input symptoms in general. The input symptoms of dysthymic disorder explained the diagnosis better than those of the other two diagnoses under all combinations of assumed prevalence rates and between-variable correlations. However, the proportion of diagnosis variance explained by own input symptoms varied widely from 0.003 to 1.0. The assumed prevalence rates and between-variable correlations of the input symptoms and the design of the diagnostic criteria were all important for the relationships between input symptoms and diagnoses.
Approximating the diagnoses using input symptoms and derived adjusted R-squared
Approximating the diagnoses with bias variables
The diagnoses were approximated with the bias variables of their own. The bias variables always explained some of the diagnosis variances, except for the diagnosis of dysthymic disorder assuming 0 between-variable correlations and 0.7 prevalence rates for the input symptoms (adjusted R-squared=0). With increasing assumed between-variable correlations for the input symptoms, the adjusted R-squared increased. However, given the same assumed between-variable correlations, the proportions of diagnosis variances explained by the bias variables might increase or decrease with the assumed prevalence rates. Compared with the adjusted R-squared in table 8, the proportion of the diagnosis variances explained by the bias variables was always smaller than that explained by the input symptoms in table 9. The proportions of the diagnosis variance explained by bias variables also varied widely from 0 to 0.89. The assumed prevalence rates and between-variable correlations of input symptoms and the design of the diagnostic criteria were important for the relationship between the bias variables and the diagnoses. Only when the input symptoms for the diagnosis of dysthymic disorder were randomly and independently prevalent to 70% of the simulated populations, the bias variables became irrelevant to the diagnosis.
Approximating the diagnoses using bias variables and derived R-squared
Discussion
This study is a first attempt to assess the biases created by mental illness diagnostic criteria, as well as understand the relationships between input symptoms and the diagnoses of three mental illnesses: major depressive episodes (at least one episode required for the diagnosis of major depressive disorder), dysthymic disorder and manic episodes. The diagnostic criteria of these three mental illnesses have been reviewed and rewritten as mathematical functions. Simulated populations of 100 000 for each of 100 simulations, with input symptoms of the three diagnoses, were created. For simplicity and practicality, the presence of the input symptoms was randomly assigned, and the input symptoms were assumed to have uniform prevalence rates and between-variable correlations. There were 25 combinations of assumed prevalence rates and between-variable correlations simulated.
Mathematically, the diagnostic criteria are functions and composite measures to transform information from the input symptoms to diagnoses. There are bias variables created by the diagnostic criteria due to data processing.7 There are three major mechanisms of introducing biases: censoring, data categorisation8 and multiplication of input symptoms.7 These mechanisms introduce information or biases that cannot be fully explained by the input symptoms.7 The introduced biases can sometimes explain more than half of the variance in the diagnoses depending on the prevalence rates and between-variable correlations of the input symptoms. The findings show that the design of the diagnostic criteria is important for bias introduction and significant for the prevalence of the diagnoses in populations, the relationships between the input symptoms and the diagnoses, and the relationships between the bias variables and the diagnoses.
The role of the diagnostic criteria
With the same assumptions in the prevalence rates and between-variable correlations of the input symptoms, the design of the diagnostic criteria of three mental illnesses can be compared with each other. The design of diagnostic criteria transform input symptoms into various diagnosis prevalence rates with implicit upper limits (ie, no more prevalent than the input symptoms), unacknowledged differential weights on the input symptoms (ie, certain input symptoms better explaining the diagnoses) and the introduction of biases (ie, due to censoring, data categorisation or multiplication).
We are the first to notice that the prevalence rates of the three diagnoses are lower than those of the input symptoms if input symptoms are randomly distributed with uniform prevalence rates and correlations. Given similar assumed input symptom prevalence and correlations, dysthymic disorder is the most prevalent, and major depressive episodes are the least. The diagnosis of dysthymic disorder can be better explained by its input symptoms individually or collectively than the other two diagnoses. The diagnosis of major depressive episodes is least explained by own input symptoms individually or collectively. As expected, the diagnosis of the three mental illness is similar to composite measures or indices and is subject to the biases introduced by data processing, given all combinations of the assumed prevalence rates and between-variable correlations of the input symptoms.7 There is only one exception: dysthymic disorder with the input symptoms that are randomly and independently present in 70% of the population. This is because the diagnosis of dysthymic disorder is a multiplicative product of the major and minor criteria. Without correlations, everyone in the population is certain to qualify for the minor criteria (probability of 100% because having at least two out of the six items in the minor criteria: mathematically [C(2,6)+C(3,6)+C(4,6)+C(5,6)+C(6,6)] × (0.7)6 = 37 × 0.117=4.35 > 100%). If 70% of the population were also randomly assigned with the major criteria and 100% were assigned with the minor criteria, 70% would be diagnosed with dysthymic disorder and the diagnosis of dysthymic disorder can be fully explained by the major criteria. In fact, without correlations between input symptoms, it only requires each of the six items in the minor criteria to be randomly assigned to 54.8% [(1/37)(1/6)] of the population for everyone to qualify for the minor criteria, and the diagnosis can be fully explained by the minor and major criteria.
Distortion of the input symptoms
The importance of the input symptoms has been distorted due to the diagnostic criteria for the three mental illnesses. The same phenomenon has been proven in the diagnosis of frailty based on three of the most commonly used scoring methods.7 In other words, based on the functions to generate the diagnoses, the input symptoms are differentially weighted, and weights are not explicitly acknowledged. The most prominent is the diagnosis of dysthymic disorder; more than 90% of the variance can be explained by its major criteria assuming 0.7 or 0.9 between-variable correlations for the input symptoms in table 6. Another example is that the third item of the major criteria for the diagnosis of manic episodes, ‘irritable mood,’ individually predicts the diagnosis better than any other input symptoms or intermediate variables. This input symptom has been given more weight than others and can explain more than 91.8% of the diagnosis variance, assuming 0.9 correlations between input symptoms. Based on the texts in the DSM-IV-TR, we do not think this symptom should be emphasised to this degree. However, the diagnostic criteria impose implicit and unequal weights to the input symptoms, and introduce biases into the diagnoses.
Future directions
We think it important to rethink the role and importance of the diagnostic system. Current approaches are embedded with implicit assumptions of the prevalence rates of the diagnoses (no higher than input symptoms if the prevalence of input symptoms are similar), unacknowledged weights to input symptoms (certain input symptoms explaining the diagnoses much better) and biases that are induced by data processing and could not be explained by the input symptoms. It is unclear whether the diagnosis of dysthymic disorder was intentionally designed to be more prevalent than those of major depressive episodes or manic episodes, given their input symptoms of the same prevalence rates.
In the real world, there are other important issues related to the diagnostic criteria. For example, diagnoses are not closely linked to treatment,20 30 diagnoses are not well made particularly by non-psychiatrists,31 and there are two diagnostic systems (the DSM and the International Classification of Disease) that require efforts to harmonise.32 Amid these issues, we think the diagnostic criteria for mental illnesses should be reviewed and improved for interpreteability, clinical use without introducing biases, and better connection to clinical decisions. Certain measures and biomarkers have been proven useful to identify mental illnesses.33 34 We are developing methods that better detect symptom-based conditions and applying syndrome mining techniques35 to search for neglected mental illnesses.
Limitations
The strength of this study is the use of simple assumptions in simulated populations that enables the comparison of the diagnostic criteria of three mental illnesses. However, the assumptions in the prevalence rates and between-variable correlations for the input symptoms might not be realistic. Some of the assumptions are unlikely to hold in the real world. However, simulations are the only option for us due to the lack of real-world data on the prevalence of the input symptoms. In addition, the translation from symptoms to diagnoses was assumed to be perfect based on the diagnostic criteria. The simulations in this study only reflect the problems in the design of the diagnostic criteria and are not designed to review the impact of how they are used in the real world.
Conclusion
To the best of our knowledge, there is no study on the relationships between the input symptoms and diagnoses. The input symptoms were extracted from the diagnostic criteria and the diagnostic criteria were transformed into mathematical functions. Without mental illness data available to the public, 100 000 subjects were simulated with different assumptions on the prevalence rates (0.05, 0.1, 0.3, 0.5 and 0.7) and correlations (0, 0.1, 0.4, 0.7 and 0.9) of the input symptoms. We found that biases were introduced into the diagnoses of three mental illnesses: major depressive episodes, dysthymic disorder, and manic episodes. The prevalence rates of the diagnoses were proportional to the assumed prevalence rates and between-variable correlations of the input symptoms. Certain input symptoms were more important than the others in explaining the diagnoses. However, the input symptoms could not fully explain the diagnoses, except when the input symptoms independent of each other with 0.7 symptom prevalence rates were used for the diagnosis of dysthymic disorder. In conclusion, the criteria used to diagnose these three mental illnesses may fail to represent the concepts they are based on, in a similar manner to three of the most commonly used scoring methods to diagnose frailty.
References
Supplementary materials
Supplementary Data
This web only file has been produced by the BMJ Publishing Group from an electronic file supplied by the author(s) and has not been edited for content.
Footnotes
Contributors Y-SC conceptualised and designed this study, managed and analysed data and drafted the manuscript. K-FL assisted in the interpretation of the diagnostic criteria. C-JW assisted in data management and computation. H-CW, H-TH, L-CT, Y-PC, Y-CL and W-CC participated in the design of this study. All authors reviewed and approved the manuscript.
Funding The authors have not declared a specific grant for this research from any funding agency in the public, commercial or not-for-profit sectors.
Competing interests Y-SC is currently employed by the Canadian Agency for Drugs and Technologies in Health. The other authors declare that there is no conflict of interest.
Patient consent for publication Not required.
Provenance and peer review Not commissioned; externally peer reviewed.
Data availability statement All data relevant to the study are included in the article or uploaded as online supplemental information. No real-world data used—all analysis are based on simulations reproducible with the files in the online supplemental materials.
Supplemental material This content has been supplied by the author(s). It has not been vetted by BMJ Publishing Group Limited (BMJ) and may not have been peer-reviewed. Any opinions or recommendations discussed are solely those of the author(s) and are not endorsed by BMJ. BMJ disclaims all liability and responsibility arising from any reliance placed on the content. Where the content includes any translated material, BMJ does not warrant the accuracy and reliability of the translations (including but not limited to local regulations, clinical guidelines, terminology, drug names and drug dosages), and is not responsible for any error and/or omissions arising from translation and adaptation or otherwise.