Article Text

Abstract
Objective To compare the epidemiological characteristics and transmission dynamics in relation to interventions against the COVID-19 and severe acute respiratory syndrome (SARS) outbreak in mainland China.
Design Comparative study based on a unique data set of COVID-19 and SARS.
Setting Outbreak in mainland China.
Participants The final database included 82 858 confirmed cases of COVID-19 and 5327 cases of SARS.
Methods We brought together all existing data sources and integrated them into a comprehensive data set. Individual information on age, sex, occupation, residence location, date of illness onset, date of diagnosis and clinical outcome was extracted. Control measures deployed in mainland China were collected. We compared the epidemiological and spatial characteristics of COVID-19 and SARS. We estimated the effective reproduction number to explore differences in transmission dynamics and intervention effects.
Results Compared with SARS, COVID-19 affected more extensive areas (1668 vs 230 counties) within a shorter time (101 vs 193 days) and had higher attack rate (61.8 vs 4.0 per million persons). The COVID-19 outbreak had only one epidemic peak and one epicentre (Hubei Province), while the SARS outbreak resulted in two peaks and two epicentres (Guangdong Province and Beijing). SARS-CoV-2 was more likely to infect older people (median age of 52 years), while SARS-CoV tended to infect young adults (median age of 34 years). The case fatality rate (CFR) of either disease increased with age, but the CFR of COVID-19 was significantly lower than that of SARS (5.6% vs 6.4%). The trajectory of effective reproduction number dynamically changed in relation to interventions, which fell below 1 within 2 months for COVID-19 and within 5.5 months for SARS.
Conclusions China has taken more prompt and effective responses to combat COVID-19 by learning lessons from SARS, providing us with some epidemiological clues to control the ongoing COVID-19 pandemic worldwide.
- covid-19
- epidemiology
- infectious diseases
Data availability statement
The data set used to support the findings of this study are not publicly available as proprietary or confidential information was included.
This is an open access article distributed in accordance with the Creative Commons Attribution Non Commercial (CC BY-NC 4.0) license, which permits others to distribute, remix, adapt, build upon this work non-commercially, and license their derivative works on different terms, provided the original work is properly cited, appropriate credit is given, any changes made indicated, and the use is non-commercial. See: http://creativecommons.org/licenses/by-nc/4.0/.
Statistics from Altmetric.com
Strengths and limitations of this study
We brought together all existing Chinese data sources for COVID-19 and severe acute respiratory syndrome (SARS) and integrated them into one unique data set.
We comprehensively assessed the epidemiological characteristics and transmission dynamics of the COVID-19 and SARS outbreak in mainland China to provide clues to control the ongoing COVID-19 pandemic worldwide.
All cases of SARS show symptoms, while this is not the case for COVID-19; therefore, more serological evidence are needed to compare the epidemiological characteristics of the two diseases.
The denominator for the case fatality rate of COVID-19 might be biased towards confirmed cases and more severe disease, and the true mortality might be overestimated.
We only compared the most important events and public health control measures in the estimation of Rt out of dozens of control measures implemented in mainland China.
Introduction
Severe acute respiratory syndrome (SARS), caused by an emerging coronavirus (SARS-CoV), initially occurred in Guangdong Province in China in November 2002, and led to 8437 cases and 813 deaths in 32 countries and regions.1 After July 2003, the SARS outbreak was brought under control, thanks to the world’s enormous efforts. A total of 5327 cases with 343 deaths were reported in mainland China.2 Seventeen years later, another emerging coronavirus, SARS-CoV-2, was identified in Wuhan in Hubei Province in China in December 2019,3 and resulted in a worldwide COVID-19 pandemic.4 As of 28 April, a total of 213 countries or territories have been affected, with more than 2.95 million cases reported and over 202 000 deaths.5 The whole world is facing a health crisis, which is greatly challenging the public health system.6 The specific characteristics of COVID-19 in comparison with SARS and whether the COVID-19 pandemic can be controlled by the same measures done during the SARS outbreak are of great interest now.7 After nearly 3 months of strong political commitment and centrally coordinated response, mainland China had only sporadic locally transmitted and a few imported COVID-19 cases at the time of writing, and all cases had been discharged from the hospital in the epicentre Wuhan.8
During the SARS outbreak in 2002–2003, no functional infectious diseases surveillance system was available in mainland China and the reporting system was outdated, which hampered data collection and delayed interventions.9 After the outbreak, we brought together all existing Chinese data sources and integrated them into one comprehensive data set.2 10 In the current study, we compare the epidemiological characteristics and transmission dynamics in relation to public health control measures against the COVID-19 and SARS outbreak in mainland China using a unique SARS data set as well as the national surveillance database of COVID-19, to provide experience in effectively fighting the ongoing COVID-19 pandemic.
Methods
Data collection and database construction
We collected data on COVID-19 from the China Information System for Diseases Control and Prevention and official reports by national, provincial and municipal health commissions. Individual information on age, sex, occupation, residence location, date of illness onset, date of diagnosis and clinical outcome was extracted. The final database included 82 858 confirmed cases of COVID-19 (all showing clinical manifestations) with 4633 deaths in mainland China from 8 December 2019 to 28 April 2020. Information on public health measures was obtained from the website of the National Health Commission (NHC) of the People’s Republic of China (http://www.nhc.gov.cn/).
We integrated data on reported SARS cases in mainland China derived from all available data sources at various levels.2 The databases comprised demographic characteristics, residence location, date of illness onset, date of diagnosis and clinical outcome of cases. After integrating data from different sources, we removed duplicate cases and filled in missing data by comparing the medical records of cases with individual case records of different data sources. The final database included 5327 SARS cases with 343 deaths in mainland China from 16 November 2002 to 28 May 2003. Information on control measures was obtained from the website of WHO (https://www.who.int/csr/don/archive/disease/severe_acute_respiratory_syndrome/en/).
Statistical analyses
Normally distributed data were expressed as mean±SD, while skewed data were described as median (IQR). Categorical variables were reported as frequency (n) and proportion (%). To estimate differences between groups, Student’s t-test or Wilcoxon rank-sum test for continuous variables and χ2 test or Fisher’s exact test for categorical variables were used, where appropriate.
Attack rate (AR) was calculated to characterise the epidemic magnitude and dimensions of COVID-19 and SARS in mainland China. AR with 95% CI was computed using the population estimate of the national census in 2010 obtained from the National Bureau of Statistics of China and presented as the number of cases per million persons. Thematic maps on the AR of COVID-19 and SARS at county level were created using ArcGIS V.10.2 software (ESRI, Redlands, California, USA). Case fatality rate (CFR) was defined as the proportion of deaths among identified confirmed cases. We compared the CFR between male and female patients, for different age categories, and estimated the OR and 95% CI by maximum likelihood method. Multivariate logistic regression analysis was conducted to validate male and female differences in CFR after adjusting for age, occupation and onset-to-diagnosis interval. All analyses were conducted using SPSS V.21.0 and R V.3.6.3 software. A two-sided p value less than 0.05 was considered statistically significant.
We estimated the effective reproduction number on day t (Rt) separately for COVID-19 and SARS to explore differences in transmission dynamics and intervention effects. Rt is defined as the mean number of secondary cases generated by one primary case with illness onset on day t using the method developed by Cori et al (online supplementary text 1).11 The CI of Rt was quantified using a bootstrap procedure.12
Supplemental material
Patient and public involvement
Patients and the public were not involved in the design or conduct of the study.
Results
As shown in table 1, the COVID-19 outbreak began on 8 December 2019 and is still ongoing. A total of 82 858 cases had been diagnosed by 28 April 2020, resulting in an overall AR of 61.8 (95% CI 61.4 to 62.2) per million persons. Of these cases 4633 have died, resulting in a CFR of 5.6% (95% CI 5.4 to 5.8). The SARS outbreak started in mainland China on 16 November 2002 and lasted for 193 days, until 28 May 2003. A total of 5327 cases were diagnosed, with an AR of 4.0 (95% CI 3.9 to 4.1) per million persons, which was much lower than that of COVID-19 (p<0.0001). Among them 343 cases died, resulting in a CFR of 6.4% (95% CI 5.8 to 7.1), which was significantly higher than COVID-19 (p=0.01). The median age of COVID-19 cases was 52 years (IQR 39–63), which was significantly older than that of SARS cases (34 years; IQR 24–47) (p<0.0001). The male to female ratio was not significantly different between COVID-19 and SARS (p=0.08). The proportion of healthcare workers among COVID-19 cases was 4.1% (95% CI 4.0 to 4.2), which was significantly lower than among SARS cases (19.2%; 95% CI 18.7 to 19.7) (p<0.0001). The average interval from onset of illness to diagnosis among COVID-19 cases decreased dramatically at different stages during the course of the outbreak, while the intervals among SARS cases were basically stable (online supplemental figure 1). The overall median onset-to-diagnosis interval of COVID-19 was 8 days (IQR 4–13), which was significantly longer than that of SARS (median 5 days; IQR 2–9) (p<0.0001).
Main epidemiological characteristics of COVID-19 and SARS in mainland China
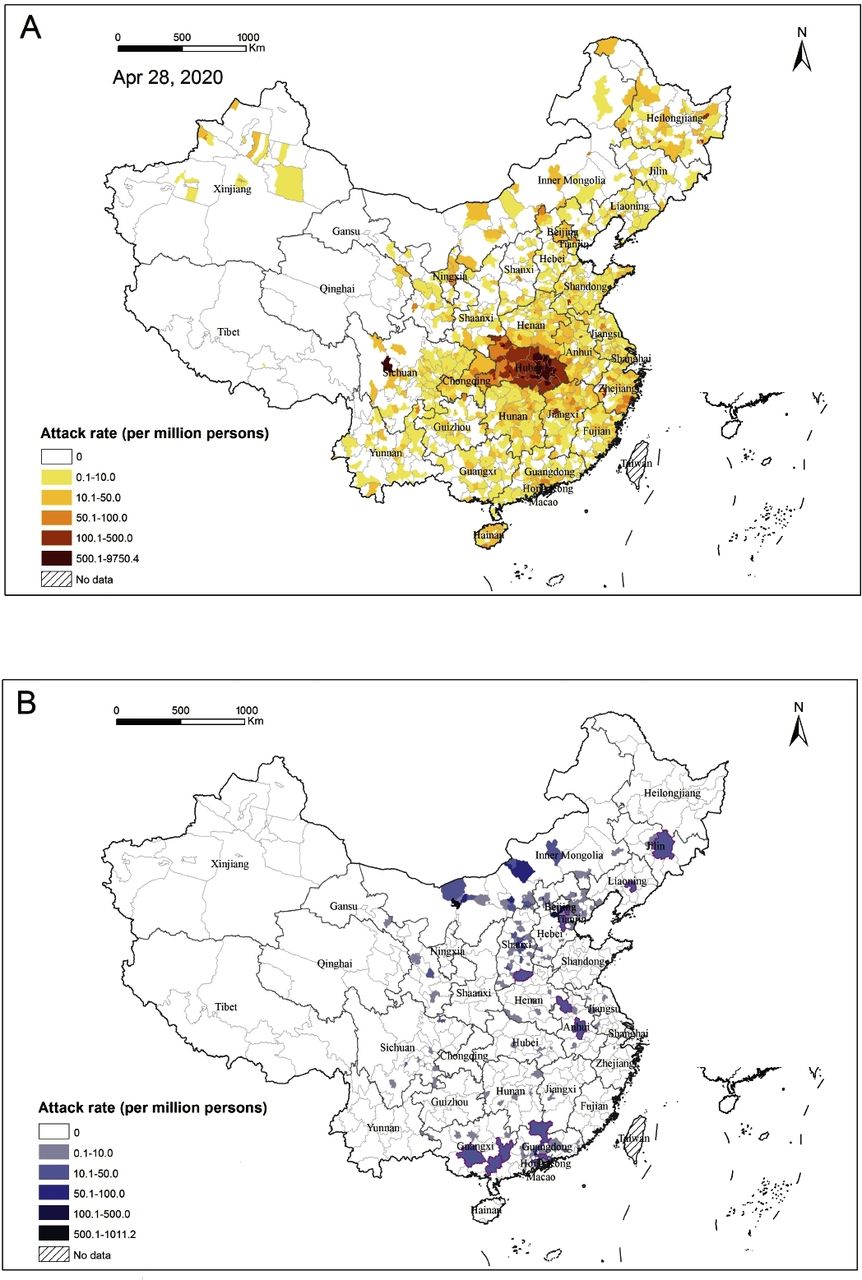
Figure 1 shows the geographical distribution of COVID-19 and SARS in mainland China. The administrative divisions including provinces, autonomous regions and municipalities of mainland China were all referred to as provinces for simplicity. COVID-19 affected 1668 counties in all 31 provinces, with Hubei Province as the only epicentre. ARs of all districts and counties in Wuhan, the capital city of Hubei Province, were higher than 1200.0 per million persons, ranging from 1253.6 (Xinzhou District) to 9750.4 (Hannan District). Generally speaking, the shorter the distance of an area from Wuhan, the higher its AR. Counties with an AR over 500.0 per million persons were mainly located in the surrounding areas of Wuhan (figure 1A). SARS cases were identified in 230 counties of 23 provinces, and clustered in Guangdong Province and the surrounding areas of Beijing. The ARs were over 100.0 per million persons in about half of the affected districts and counties of Guangzhou and Beijing. Most affected counties in other areas had ARs lower than 10.0 per million persons (figure 1B).

Comparison of attack rates between COVID-19 and severe acute respiratory syndrome (SARS) in mainland China. (A) Attack rates of COVID-19 in affected counties as of 28 April 2020. (B) Attack rates of SARS in affected counties from 16 November 2020 to 28 May 2003. The cities mainly reporting cases at the city level are highlighted with purple edging.
The COVID-19 outbreak lasted for 142 days so far with only one peak (figure 2A). From 8 December 2019 to 19 January 2020, COVID-19 mainly occurred in Wuhan. Thereafter, the number of COVID-19 cases grew rapidly and peaked around 26 January 2020. After the Chinese authorities adopted vigorous and extensive control measures on 23 January 2020, the outbreak showed a markedly decreasing trend. Since mid-March, most cases were imported or import-related. In contrast, the SARS outbreak lasted for 193 days with two peaks (figure 2B). The first wave was characterised by local transmission in Guangdong Province from 16 November 2002 to early March 2003, and peaked around 8 February. The second wave was caused by the spread of SARS to other provinces, which lasted from early March to 28 May 2003, with the peak around 26 April 2003. The Beijing metropolis was the second epicentre after Guangdong Province.

Epidemic curves of COVID-19 and severe acute respiratory syndrome (SARS) in mainland China. (A) Epidemic curve of COVID-19 in mainland China by date of onset from the first case on 8 December 2019 to 28 April 2020 and by three locations (Wuhan, Hubei Province except Wuhan, and other provinces). (B) Epidemic curve of SARS in mainland China by date of onset from the first case on 16 November 2002 to 28 May 2003 and by three locations (Guangdong Province, Beijing and other provinces).
SARS-CoV-2 tended to infect people 50 years or older, accounting for 55.6% cases, and the AR of COVID-19 increased with age. On the contrary, SARS-CoV was more likely to infect young adults between 20 and 49 years, accounting for 69.9% cases, and the AR dramatically decreased with age (figure 3A). The overall AR of COVID-19 in women (61.6 per million persons) was significantly higher than in men (58.3 per million persons; p<0.0001), while male and female differences in AR were not found in SARS cases (p=0.86). The CFR for both COVID-19 and SARS increased strongly with age (χ2 test of linear trend, both p<0.0001) and was significantly higher among male cases in comparison with female cases, with an OR of 1.8 (95% CI 1.7 to 2.0; p<0.0001) for COVID-19 and 1.4 (95% CI 1.1 to 1.8; p=0.003) for SARS (figure 3B). Multivariate regression analysis revealed that the male and female difference in CFR remained significant for both diseases after adjusting for age, occupation and onset-to-diagnosis interval. The adjusted OR was 1.9 (95% CI 1.8 to 2.0; p<0.0001) for COVID-19 and 1.3 (95% CI 1.0 to 1.7; p=0.043) for SARS.

Comparison of age and sex differences between COVID-19 and severe acute respiratory syndrome (SARS) in mainland China. (A) Attack rate of COVID-19 (left) and SARS (right) in different age and sex groups. (B) Case fatality rate of COVID-19 (left) and SARS (right) in different age and sex groups.
We further evaluated the transmission dynamics of both COVID-19 and SARS outbreak by estimating trends in Rt in relation to public health interventions. Although various actions had been implemented in mainland China during the outbreak (online supplemental table 1), we selected seven important events and control measures, and displayed the duration from disease emergence to initiation of each action as the background of Rt curves. As shown in figure 4A, Rt fluctuated greatly between 1.5 and 3.0 at the beginning of the COVID-19 outbreak. On 31 December 2019, the Wuhan Health Committee announced the outbreak publicly. Three days later, NHC notified WHO of the emerging infectious disease, when Rt was up to 2.5. About 1 week after the disease was first notified, the novel coronavirus was isolated and identified as the causative agent. On 11 January 2020, diagnostic kits were available and provided to Wuhan. Regular control measures, such as case finding and contact tracing, were taken.13 Rt subsequently decreased to 1.7. However, due to the spread to and within other parts of China besides Wuhan, Rt steadily increased. Chinese authorities then started to take very vigorous intervention measures, such as mandatory reporting, lockdown of Wuhan, extending the Spring Festival holidays and postponing the school semester. Immediately, Rt consistently decreased to below 1 in the following 2 weeks. On 4 February, Huoshenshan Hospital was put into operation and Rt consistently decreased to nearly 0 on 20 March. After this, Rt increased again and fluctuated around 1 due to the emergence of sporadic locally transmitted cases.

Dynamics of estimated effective reproduction number (Rt) during the COVID-19 and severe acute respiratory syndrome (SARS) outbreak in relation to public health control measures in mainland China. (A) Estimated Rt during the COVID-19 outbreak in mainland China. (B) Estimated Rt during the SARS outbreak in mainland China. Values represent average Rt (central blue line) and associated 95% CI (light blue shade). The horizontal dashed line represents Rt=1, below which sustained transmission is impossible. The length of the colourful bars represents the interval from the first case emergence to the time of each action. Different colours represent different actions taken in mainland China. Light grey: official announcement (COVID-19 on 31 December 2019 and SARS on 11 February 2003); light purple: notification of WHO (COVID-19 on 3 January 2020 and SARS on 10 February 2003); light pink: identification of aetiology (COVID-19 on 7 January 2020 and SARS on 16 April 2003); light orange: availability of diagnostics (COVID-19 on 11 January 2020 and SARS on 1 May 2003); light yellow: mandatory reporting (COVID-19 on 20 January 2020 and SARS on 13 April 2003); light green: full governmental control (COVID-19 on 23–26 January 2020 and SARS on 19–26 April 2003); light blue: specialised hospitals (Huoshenshan Hospital for COVID-19 on 4 February 2020 and Xiaotangshan Hospital for SARS on 30 April 2003).
As shown in figure 4B, Rt of SARS fluctuated significantly from the beginning to early February 2003, with a wide CI. When China notified WHO about the unknown pneumonia on 10 February (86 days after the first case of SARS emerged) and officially reported the outbreak 1 day later, regular control measures were conducted in Guangdong Province and Rt dropped to below 1 within 1 week. Due to the transmission in Beijing and neighbouring provinces, Rt reincreased to above 1. On 13 April, SARS was listed as a notifiable infectious disease and reported mandatorily; however, Rt did not show a decreasing trend. It was only from 19 April to 26 April that Chinese authorities gained full control of all activities to combat SARS (154 days after the outbreak). Within 1 week, Rt fell to around 1. On 30 April, Xiaotangshan Hospital was open, and diagnostic kits were available 1 day later. Rt remained stable and never exceeded 1 again. The durations from the emergence of COVID-19 to official announcement, notification of WHO, identification of aetiology, availability of diagnostics, mandatory reporting, full governmental control and specialised hospitals were all remarkably shorter in comparison with SARS.
Discussion
By 26 April 2020, all hospitalised patients with COVID-19 in Wuhan, the epicentre, where the virus was first detected last December 2019, had been discharged,14 indicating that the first wave of COVID-19 outbreak in mainland China was coming to an end. This paper describes the differences between the COVID-19 and SARS outbreak in mainland China with respect to epidemiological characteristics and transmission dynamics.
The COVID-19 outbreak has spread more extensively in mainland China and affected 1668 counties in all 31 provinces, which is over seven times more than that of the SARS outbreak. Wuhan, the capital city of Hubei Province, was the only epicentre whilst the surrounding counties had much higher ARs. The COVID-19 outbreak coincided with the Spring Festival holidays, when people traditionally go home to celebrate Chinese New Year. The large-scale population movement and convenient transportation have undoubtedly accelerated the transmissions especially during the early stage of the outbreak.15–17 Learning from experience and lessons from the SARS outbreak,18 19 very strict public health measures had been taken to combat the COVID-19 outbreak since 23 January 2020. It turned out to be effective in controlling the spread of COVID-19 from Hubei Province to other provinces, probably preventing a second epicentre in mainland China. Although the SARS outbreak has affected much fewer (230) counties with much lower ARs, it did result in a secondary epicentre in Beijing and its surrounding areas.
COVID-19 has spread more rapidly and took only 44 days to spread from Hubei to all other provinces across mainland China. Although COVID-19 emerged in Wuhan, its epidemic peaks in either Wuhan or Hubei as well as in other provinces occurred at nearly the same time on 24–28 January 2020. As the clinically diagnosed cases were included in the updated version of case definition, an abnormal peak value of daily new cases was recorded on 1 February. The epidemic curve might reflect the great effects of all control measures coordinated by the central government. The strict public health measures such as the complete lockdown of cities, active case surveillance, quarantine of contacts and the compulsory use of masks in the general population are probably extreme but have helped achieve good results. These experiences can be taken into consideration by other countries in their response to COVID-19.20 Taking a look back at the SARS outbreak, the peak of the first wave occurred in the initial epicentre of Guangdong Province in late January and mid-February 2003. Thereafter the epidemic gradually subsided. Unfortunately, this reduction did not continue and was followed with further national spread and led to the second peak around late April 2003. When the Chinese government initiated impressive nationwide control measures, the SARS outbreak was contained within 2 months.21 The trade-off between social economic consequences and timely health effects might be an important lesson that China and other countries around the world can learn from the SARS outbreak.
There are obvious differences in age distribution between COVID-19 and SARS. Most COVID-19 cases were people 50 years or older, with a median age of 52 years. Meanwhile, both AR and CFR increased with age. On the contrary, most SARS cases were young adults, with a median age of 34 years. The AR tended to decrease with age, but the CFR increased with age, except for the 0–19 years age group. The results of analysis on sex differences in COVID-19 are controversial. Our study shows that AR is higher among women than men, which is consistent with reports in South Korea and Germany.22 23 Other studies, however, came with an opposite conclusion that COVID-19 is more prevalent among men24 25 or that the diagnosis rates are similar between sexes.26 Different population composition, case definitions and inclusion criteria, and gender-associated risk of exposure might lead to the discrepancy between studies. CFRs are greater in men than in women in mainland China, indicating a sex predisposition to COVID-19. The same findings have been reported in most countries,26 27 with men more prone to severe COVID-19 and death. A similar trend in sex bias in mortality was also observed in the prior SARS epidemic.26 Sex-specific disease outcomes might be attributed to the sex-dependent production of steroid hormones and the different copy numbers of immune response X linked genes in men and women.28 Additionally, social factors including smoking and healthcare-seeking behaviours as well as sex-related chronic comorbidities might also impact disease outcomes.29 30 Although the underlying mechanisms require further investigation, our findings imply that greater efforts in effectively preventing COVID-19 should be done in older populations and more attention should be paid to treatment of older male patients in order to reduce mortality.
In the present study, we used CFR to estimate the mortality from two diseases. During the early stage of the COVID-19 pandemic, a proportion of people with milder or no symptoms might have been undetected.31 Additionally, asymptomatic cases were not defined as confirmed cases according to the case definition in mainland China32 and were not included in the denominator when calculating. Therefore, the observed CFR of COVID-19 tended to be high. In addition, the high value might also be skewed by the lethality of the disease in Wuhan (CFR of 7.7%), where the outbreak unexpectedly started, with over 60.7% of confirmed cases having been recorded in mainland China. However, our estimate calculated from the COVID-19 data set as of 28 April 2020 was more accurate than previous studies in mainland China,33 where the final outcomes remained unknown in some cases.34 The estimated CFR of SARS in mainland China was much lower than other affected countries or regions,2 35 which might be due to the relatively young age of SARS cases, over-reporting in Guangdong early in the epidemic, and the use of rational management and more intense treatment.2 36 37
The dynamic changes in Rt during the COVID-19 and SARS outbreak showed clear differences in the timing and impact of important actions taken in mainland China. Looking retrospectively, due to the imperfect national emergency response and insufficient attention to the emerging infectious diseases during the SARS epidemic, national control measures were delayed. However, the late interventions still contributed much to speeding up the elimination of SARS, given the fact that the epidemic was fully controlled after the central government took leadership.10 Since 2003, China has improved its epidemic response capacity, which played a key role in fighting COVID-19. After an obvious fluctuation at the very beginning of COVID-19, Rt was maintained at a low level for about a week in mainland China before 31 December 2019. Unfortunately, China missed the best opportunity to end the outbreak early, as COVID-19 was only identified as a zoonosis, with the important clue being an exposure history to the Huanan Seafood Wholesale Market.38 Regular control measures such as case finding, contact tracing and investigations of infective sources implemented in the epicentre were shown to be effective and decreased Rt to about 2.0. However, since 10 January 2020, Rt steadily increased again due to COVID-19 occurrence in many parts outside of Wuhan. After person-to-person transmission was confirmed, the most stringent control measures have been taken since 23 January. The set of control measures was certainly necessary, adequate and effective, given the fact that Rt dropped to below 1 in just a period of 2 weeks.
These facts implied that non-pharmaceutical control measures deployed in mainland China can actually halt the epidemics of diseases, even in 2003 when the government had a slow response to SARS. The remarkable success was mainly due to the vigorous old-style public health control measures implemented, especially isolation and quarantine, social distancing and community containment.39 Compared with Western countries, Chinese authorities took isolation of all cases more seriously, including mild cases, during the COVID-19 epidemic, and developed the Fangcang shelter hospitals to particularly isolate and treat patients with mild to moderate COVID-19.40 Compared with isolating at home, this institutional-based isolation substantially decreased the risk of transmission between families and communities.41 The wide use of big data, sophisticated artificial intelligence and machine learning algorithms is crucial to retracing the movement of infected persons and tracing close contacts.42 In addition, mainland China is preventing importation and onward transmission strictly through custom inspection and border quarantine.43 Every incoming traveller (including returning residents) is subject to a nucleic acid testing and a 14-day mandatory quarantine at a designated central facility in the city of first entry point.44 Clearly the Chinese government has acted more quickly and effectively this time. The strong political commitment, the centrally coordinated response and mass participation across the whole country have played a very important role in containing COVID-19 in mainland China. These efforts represent welcome progress and development for global health security and diplomacy.45
There are some limitations to this study. First, all cases of SARS are symptomatic, while a proportion of cases infected with COVID-19 had mild or no symptoms and passed unnoticed. Comparative results between the two diseases should be interpreted with caution and more evidence-based serological data are needed. Second, our estimates of fatality rate were based on confirmed cases detected through national surveillance and calculated using crude methods. The denominator for the CFR of COVID-19 might be biased towards confirmed cases and more severe disease, and the true mortality might thus be overestimated. These biases are difficult to overcome early in a pandemic. Therefore, future studies estimating the ratio of deaths among all infected individuals will be needed to measure mortality more accurately. Third, although dozens of local and national, small-scale or large-scale control measures were implemented in different areas, we only compared the most important events and control measures in the estimation of Rt.
In conclusion, the ongoing COVID-19 outbreak spread more quickly to more extensive areas within a shorter period of time, in comparison with the SARS outbreak in 2002–2003, which implies higher transmissibility of SARS-CoV-2. However, COVID-19 only had one epicentre with one peak, unlike SARS with two epicentres and two epidemic peaks, which indicates early response and prevention measures were effective. The age and sex distributions between COVID-19 and SARS are different in terms of AR, but crudely the same in fatality rate. The comparison of Rt in relation to response activities reveals that the durations from the emergence of COVID-19 to official announcement, notifying WHO, identification of aetiology, availability of diagnostics, mandatory reporting and centrally coordinated response were remarkably shorter in comparison with SARS, indicating a more prompt and effective response. These findings provide helpful information that can be used to fight the ongoing COVID-19 pandemic worldwide.
Data availability statement
The data set used to support the findings of this study are not publicly available as proprietary or confidential information was included.
Ethics statements
Ethics approval
As this study constituted public health surveillance rather than research in human beings, ethical approval from institutional review boards was not required. All information on individual persons had been anonymised.
Acknowledgments
We thank all members of the Cheeloo EcoHealth Consortium (CLEC) for help with data collection and cleaning.
References
Supplementary materials
Supplementary Data
This web only file has been produced by the BMJ Publishing Group from an electronic file supplied by the author(s) and has not been edited for content.
Footnotes
Z-QW and W-CC are joint senior authors.
Contributors LZ, DF, SL, ZW and WC conceptualised the initial hypothesis and conceived and designed the study. LZ, DF, RY, HW, YZ, JW, XC, NJ, CY, SL, ZW and WC collected the data. LZ, DF, RY, HW, YZ, JW, SdV, XC, NJ and WC did the statistical analyses and interpreted the results. LZ, DF, RY, ZW and WC wrote the first draft of the manuscript, and LZ, DF, SdV, ZW and WC revised the manuscript. All authors contributed substantially to data acquisition and interpretation, and revision and editing of the manuscript.
Funding This work is supported by the National Natural Science Foundation of China (81621005), National Key Research and Development Program of China (2019YFC1200505 and 2019YFC1200500), and the China Postdoctoral Science Foundation (2020T130069ZX).
Competing interests None declared.
Provenance and peer review Not commissioned; externally peer reviewed.
Supplemental material This content has been supplied by the author(s). It has not been vetted by BMJ Publishing Group Limited (BMJ) and may not have been peer-reviewed. Any opinions or recommendations discussed are solely those of the author(s) and are not endorsed by BMJ. BMJ disclaims all liability and responsibility arising from any reliance placed on the content. Where the content includes any translated material, BMJ does not warrant the accuracy and reliability of the translations (including but not limited to local regulations, clinical guidelines, terminology, drug names and drug dosages), and is not responsible for any error and/or omissions arising from translation and adaptation or otherwise.