Article Text

Abstract
Objectives The UK government is proposing to cease cutting the local authority public health grant by reallocating part of the treatment budget to preventative activity. This study examines whether this proposal is evidenced based and, in particular, whether these resources are best reallocated to prevention, or whether this expenditure would generate more health gains if used for treatment.
Methods Instrumental variable regression methods are applied to English local authority data on mortality, healthcare and public health expenditure to estimate the responsiveness of mortality to variations in healthcare and public health expenditure in 2013/14. Using a well-established method, these mortality results are converted to a quality-adjusted life year (QALY) basis, and this facilitates the estimation of the cost per QALY for both National Health Service (NHS) healthcare and local public health expenditure.
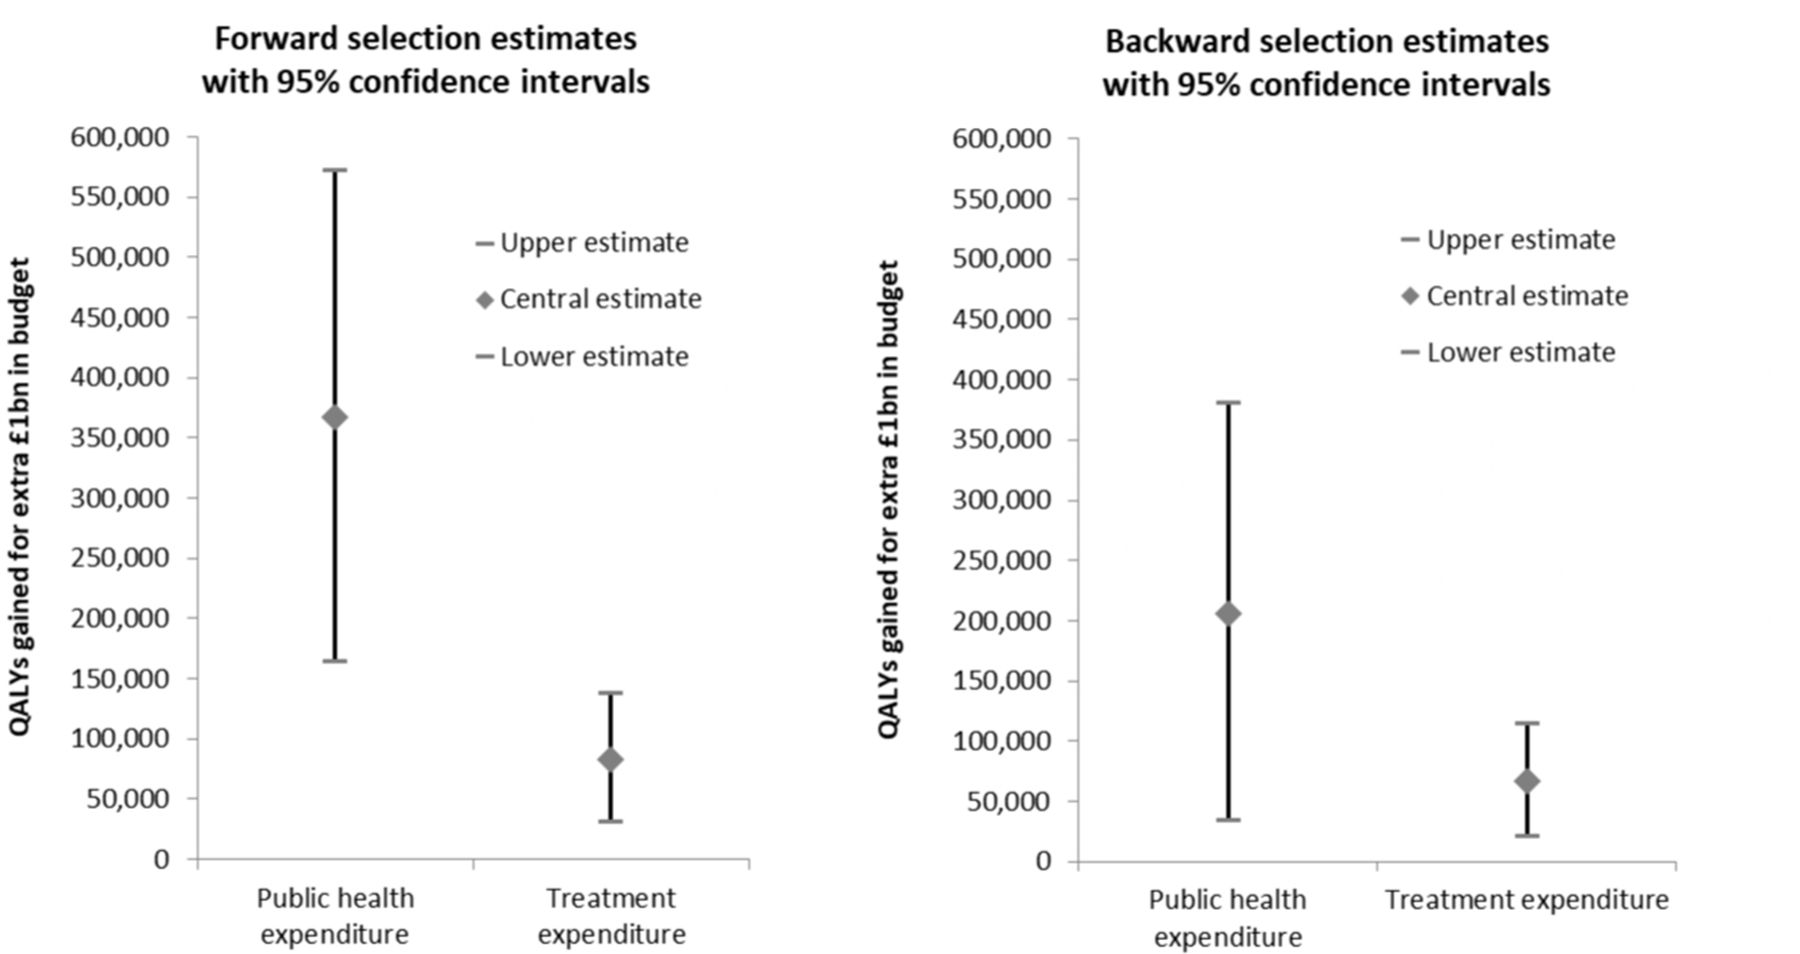
Results Saving lives and improving the quality of life requires resources. Our estimates suggest that each additional QALY costs about £3800 from the local public health budget, and that each additional QALY from the NHS budget costs about £13 500. These estimates can be used to calculate the number of QALYs generated by a budget boost. If we err on the side of caution and use the most conservative estimates that we have, then an additional £1 billion spent on public health will generate 206 398 QALYs (95% CI 36 591 to 3 76 205 QALYs), and an additional £1 billion spent on healthcare will generate 67 060 QALYs (95% CI 21 487 to 112 633 QALYs).
Conclusions Additional public health expenditure is very productive of health and is more productive than additional NHS expenditure. However, both types of expenditure are more productive of health than the norms used by National Institute for Health and Care Excellence (£20 000–£30 000 per QALY) to judge whether new therapeutic technologies are suitable for adoption by the NHS.
- public health
- health economics
- health policy
This is an open access article distributed in accordance with the Creative Commons Attribution Non Commercial (CC BY-NC 4.0) license, which permits others to distribute, remix, adapt, build upon this work non-commercially, and license their derivative works on different terms, provided the original work is properly cited, appropriate credit is given, any changes made indicated, and the use is non-commercial. See: http://creativecommons.org/licenses/by-nc/4.0/.
Statistics from Altmetric.com
Strengths and limitations of this study
Cross-sectional analysis of the impact of public health and healthcare expenditure on mortality.
The endogenous nature of expenditure is accommodated via the use of instrumental variable methods.
The analysis includes controls for the need for healthcare expenditure.
The estimated mortality effects are converted into quality-adjusted life year effects.
There may be other healthcare need factors beyond those included in this study.
Introduction
The UK’s National Health Service (NHS) spends about 5% of its annual budget on preventative activity with most of the remainder on treatment.1 However, most observers agree that prevention is better than cure and two recent government publications emphasise the importance of prevention if the government’s target gains in life expectancy by 2035 are to be realised.2–4 The government’s 2019 Spending Review announced that cuts to the public health grant will cease and that a real-terms increase from 2019/2020 to 2020/2021 will be achieved by a reprioritisation within the Department of Health’s budget.5 6 Although there is some debate about whether the increased funding will even compensate for increased costs,7 this reprioritisation raises the issue of whether these resources are best reallocated to prevention, or whether this expenditure would generate more health gains if used for treatment.
There is considerable evidence that specific individual preventative interventions generate substantial health benefits. For example, a study of the cost per quality-adjusted life year (QALY) associated with public health interventions assessed by the National Institute for Health and Care Excellence (NICE) over two 5-year periods reported that the median cost per QALY was £1053 between 2005 and 2010, and £7843 between 2011 and 2016.8 Both of these cost per QALY figures are far below the £30 000 threshold that NICE uses for the approval of new therapeutic treatments within the NHS.9
Studies of individual public health interventions are useful but, if budgets are reallocated, we need to know the health gains associated with the increased spending on public health across all types of investments and the health losses associated with reduced spending on treatment (again, across all programmes that are likely to be curtailed). In other words, we need to know the health effects at the margin of changes in the totality of the public health and healthcare budgets.
There is some American evidence on the effect of public health expenditure on mortality but the relevance of this for the UK is limited because the US healthcare system is very different and these studies do not simultaneously account for the impact of treatment expenditure.10 There is considerable evidence about the marginal productivity of English NHS healthcare (treatment) expenditure.11 12 However, we want to investigate the marginal productivity of preventative expenditure while simultaneously controlling for treatment expenditure, and the inclusion of prevention expenditure in the health outcome specification may affect the estimated marginal productivity of treatment expenditure.
Here, we exploit the availability of a funding formula for the public health grant. This determines how much of the total national budget is allocated to each local authority (LA). Some components of this formula are conditionally exogenous, that is, they are not related to health outcomes after controlling for the need for healthcare, except through their influence on the level of expenditure, and this makes it possible to identify the causal effect of changes in expenditure on mortality.
At the time of this study, the most recent mortality data available at a local level was for 2013/2014/2015 combined, and hence we relate expenditure in 2013/2014 to a measure of mortality for these 3 years. Moreover, by converting healthcare (treatment) expenditure as reported by Clinical Commissioning Groups (CCGs) to an LA geography, we are also able to estimate a health outcome specification that includes both treatment (healthcare) and prevention (public health) expenditure. This enables us to identify the relative contribution of both types of expenditure to reductions in mortality.
Methods
Institutional context
The English NHS is a largely centrally planned and publicly funded healthcare system. Its income comes almost entirely from national taxation. Access to the Service is usually achieved via general practitioners who act as gatekeepers to secondary care and pharmaceuticals. With some minor exceptions, the service is free at the point of consumption for patients.
The service is organised geographically, with responsibility for the local management of the NHS delegated to local health authorities. For our study year (2013/2014), each authority (CCG) was assigned a fixed annual budget by the national ministry (the Department of Health) within which they were supposed to meet expenditure on most types of healthcare including inpatient care, outpatient and community care, and pharmaceutical prescriptions.
We use their reported expenditure from the programme budgeting dataset as a measure of local healthcare expenditure.13 Primary care, specialised commissioning and national public health programmes were administered centrally. £2203 m was made available for these nationally funded public health programmes including those for immunisation (eg, for hepatitis B, for tuberculosis and for measles, mumps and rubella (MMR)) and for screening (eg, for exposure to HIV and for cervical cancer).14
Responsibility for local public health was delegated to local government with each ‘unitary’ or upper tier LA receiving a fixed annual budget, ring-fenced for public health activities. Here, our focus is on the impact of the local public health grant because we do not have data for expenditure on national programmes by local area. In 2013/2014, LAs spent over £2500 m on public health services including £630 m on sexual health services (eg, for sexually transmitted infection (STI) testing and treatment, and for contraception), £800 m on substance (drugs and alcohol) misuse services, £150 m on stop smoking and tobacco control services, and £240 m on health programmes for children aged 5–19.15
We sometimes refer to public health expenditure as ‘preventative’ and CCG healthcare expenditure as ‘treatment’ (for ill health). This is more out of a desire to avoid repetition rather than any belief that all expenditure funded by the public health grant is preventative and/or that all healthcare expenditure is solely for treatment. For example, some expenditure from the public health grant could be considered as treatment (eg, expenditure on substance misuse treatment services) and some expenditure by CCGs will be preventative (eg, on medication for blood pressure and blood cholesterol). This issue is discussed further in the online supplemental appendix A1 . Strictly speaking, we are comparing the productivity of the public health grant with CCG healthcare expenditure but we believe that it is reasonable to think of this as a comparison of the marginal productivity of preventative and treatment expenditure.
Supplemental material
Estimation strategy
Studies estimating the relationship between any form of health expenditure and mortality typically estimate an outcome equation of the form:
 (1)
(1)
where expenditure is likely to be endogenous, the controls reflect the need for health expenditure, and e reflects everything not included elsewhere in the specification.16 17 We want to estimate this specification, first with public health as the sole expenditure variable, and then with both public health and healthcare expenditure as two separate variables.
Even after controlling for observable need for health expenditure, estimating the impact of health expenditure on mortality is challenging for two reasons and these are illustrated in the top half of figure 1: first, there might be some reverse causation with historical mortality influencing the current level of expenditure; and second, there might be some unobserved factor that is driving both expenditure and mortality. Our estimation approach involves finding variables (known as ‘instruments’) that are good predictors of expenditure but which have no direct impact on either mortality or unobserved factors.

Causal paths diagram.
These instruments are used to predict the level of expenditure that is not influenced by either historical mortality or unobserved factors. Having severed the link with unobserved factors and mortality, the predicted level of expenditure can then be used in a regression model to examine the causal impact of expenditure on mortality (bottom half of figure 1).
We use the resource allocation formula for the public health grant to LAs as a source of instruments for public health expenditure. This formula has three components—for mandatory services, for non-mandatory services, and for substance misuse services—and each component has its own formula. Although the precise formula differs for each component, overall, the public health budget per person can be expressed as:
local budget per person=(national budget per person) x (local age index) x (local additional needs index) x (local input price index) x (local DFT index)
where: (1) the age index reflects the demographic profile of the local population; (2) the additional needs index reflects local deprivation and other factors likely to influence the need for public health expenditure; (3) the input price index (MFF) reflects prices in the local health economy and (4) the distance from target (DFT) index reflects how far each LA’s actual budget allocation is from its target allocation.16 The DFT index reflects the fact that, periodically, the national ministry revises the funding formula and this, together with routine data updates, generates a new target budget allocation for each LA. For some LAs, the new funding rule might generate a large change in its target allocation and, to avoid sudden large reductions in actual allocations (budgets), such changes are phased into actual budgets over a number of years in accordance with the Department of Health’s ‘pace of change’ policy.18
Two of the four adjustment factors in equation (2)—the MFF and the DFT—are relevant for all three components of the public health resource allocation formula for 2013/2014. We use these variables as instruments to predict expenditure, and then estimate the relationship between this predicted level of expenditure and health outcomes. The MFF and DFT are valid instruments if they are not related to health outcomes (except through their influence on expenditure) or an unobserved confounder.16 17
The local input price index (MFF), which will reflect characteristics of the local (health) economy, could be correlated with unmeasured determinants of mortality (ie, an unobserved confounder). However, we have over a dozen potential socioeconomic covariates (including the Index of Multiple Deprivation) in the baseline mortality equation and hence it is difficult to imagine what effect the input price index would detect that our covariates do not (see online supplemental appendix A2 for further discussion of this instrument). The DFT variable will largely reflect: (1) the level of PCT expenditure in 2010/2011 associated with those public health activities that were transferred to LAs in 2013/2014; (2) the public health grant funding formula for 2013/2014; and (3) the ‘pace of change’ policy for the 2013/2014 allocations. The latter two factors will be policy choices but it is not obvious that the resulting DFT will be endogenous with respect to mortality. Moreover, any correlation between our two instruments and the error term in equation (1) is likely to be detected by the Hansen-Sargan test. Hence, we use the public health grant MFF and DFT as instruments for public health expenditure when estimating equation (1).
Theory provides little guidance as to the identity of the appropriate controls in equation (1) so, following previous studies, we identify a dozen socioeconomic variables—such as the proportion of the working age population employed in managerial and professional occupations, and the proportion of owner-occupied households—as potential controls for the need for public health expenditure.17 We start by estimating (1) with all socioeconomic variables included as controls. The least significant regressor is removed from the specification and the equation is re-estimated (backward selection). This process—of dropping the least significant regressor and re-estimating—continues until there are only significant controls remaining (the expenditure term is forced to be ever-present). This specification becomes our preferred result if it also passes the appropriate statistical tests (eg, the instruments are valid and the instruments are strong) but, if this is not the case, the specification is adjusted (eg, an invalid instrument is removed) and the equation re-estimated. When the specification requires no further adjustment it becomes our preferred specification.
Initially equation (1) is estimated using the above strategy with public health as the sole health expenditure variable. We then re-estimate (1)—again using the above strategy—but this time including healthcare expenditure as an additional endogenous regressor. This variable is instrumented in a similar way to public health. Further details of this estimation process and the instruments for healthcare expenditure are in the online supplemental appendix A3. As a sensitivity analysis, we repeat our estimation strategy using forward selection to identify relevant controls when we have both public health and healthcare expenditure in the health outcome equation.
Data
Unitary and upper tier LAs (n=152) are the unit of analysis in this study but one of them (the Isles of Scilly) is so small that the mortality data for this authority is rarely disclosed by the Office for National Statistics (ONS) so this leaves 151 authorities for analysis. In addition, the healthcare expenditure data for one CCG (Wiltshire) for 2013/2014 is not available so that, when both expenditure variables are included in the estimating equation, there are 150 observations for analysis.
With the exception of the CCG healthcare expenditure and the instruments for this variable, all of the dataset is readily available at the LA level. The healthcare expenditure and instrument data have been converted to an LA basis using a mapper which uses population levels in mid-2012 to allocate (parts of) CCGs to LAs. As LAs vary greatly in size, we weight all observations in our analysis by their population size. In addition, we use the logarithms of all variables in the empirical analysis so that regression coefficients can be interpreted as elasticities.
Table 1 reports descriptive statistics for the variables employed in this study. Average expenditure per person from the public health grant in 2013/2014 was £53 and this varied between £18 and £186 per person. Average per capita expenditure on healthcare was £1152. The mortality measure employed in this study is the (age) standardised under 75 years of life lost rate. This mortality rate varies considerably across the country, ranging between 267 (city of London) and 776 (Blackpool) years of life lost per 10 000 population.
Descriptive statistics for study variables
The DFT instrument for public health expenditure averages just over 1.00 but its range suggests that at least one LA budget is 46% under its target allocation and another LA budget (the City of London) is 562% above its target allocation. The MFF instrument for public health expenditure reveals that some LAs face unit costs between 8% lower and 21% higher than the average. The instruments for healthcare expenditure also reveal considerable geographical variation with, for example, some LAs being 7% below and others being 23% above their target allocations.
The dozen potential socioeconomic controls for the need for health are also listed in table 1. These census-based variables are constructed using the 2011 census. They show that, for example, on average, 13% of all residents are born outside the European Union, 31% of the working-age population are employed in managerial and professional occupations, and 62% of households are owner occupied. Again, these averages mask considerable variation across LAs; the proportion of residents born outside the EU varies from less than 2% to more than 50%, and the extent of owner occupation ranges between 26% and 81% of all households. Further details about the data can be found elsewhere.19 All specifications are estimated using the ivreg2 command in Stata (version 15).20
Patient and public involvement
Neither patients nor the public were involved in the design, or conduct, or reporting, or dissemination of our research.
Results
With the public health grant as the only expenditure variable
Estimation of equation (1) with public health as the sole expenditure variable generates the result shown in column 1 of table 2. Application of the backward selection process generates the more parsimonious specification shown in column 2 of table 2. In this, public health expenditure has a modest but statistically significant negative association with mortality, expenditure is endogenous, there is no evidence of weak instruments (the Kleibergen-Paap F statistic exceeds the rule-of-thumb threshold value (=10)), and the specification passes the reset test. Details of the intermediate estimations associated with this backward selection process are in the online supplemental appendix A4 (see online supplemental table A1 for the second-stage and online supplemental table A2 for the first-stage results).
Derivation of preferred specifications for public health expenditure, 2013/2014
With both the public health grant and healthcare as the expenditure variables: backward selection
Estimation of equation (1) with both public health and healthcare expenditure as endogenous regressors generates the result shown in column 3 of table 2. This specification includes five instruments (two for public health expenditure and three for healthcare expenditure). Application of the backward selection process generates the more parsimonious result shown in column 4 where both expenditure variables have the anticipated negative association with mortality, they are endogenous, the instrument set is valid, and the instrument sets for both endogenous variables are individually strong (the Sanderson-Windmeijer F-statistics are around ten or better). Details of the intermediate estimations associated with the backward selection process are in the online supplemental appendix A4 (see online supplemental table A3 for the second-stage and online supplemental table A4 for the first-stage results).
With both the public health grant and healthcare as the expenditure variables: forward selection
The use of backward selection to identify relevant covariates when theory provides little guidance does not always meet with universal approval, and hence results are also reported using forward selection (see table 2, columns 5 and 6). Column 5 shows the result with the inclusion of the most significant single control (‘permanently sick’) with the same five instruments from the ‘full’ specification in column 3. Further re-estimation, with the inclusion of additional significant controls, generates the result shown in column 6. No further additional significant controls could be found and, as the result in column 6 is both in line with both our theoretical priors and passes the appropriate statistical tests, this is our preferred specification using forward selection. Details of the intermediate estimations associated with the forward selection process are in the online supplemental appendix 1 (see online supplemental tables A5 and A6 in online supplemental appendix A4.
The estimation of a mortality equation that includes both public health and healthcare expenditure generates an outcome elasticity for public health expenditure of −0.081 using backward selection and an elasticity of −0.144 using forward selection. The midpoint of these two elasticities is almost identical to the elasticity estimated without the inclusion of healthcare expenditure (=−0.115). Although statistically significant, these elasticities appear relatively modest when compared with the elasticity associated with healthcare expenditure (which, in this paper, is several times larger than the public health elasticity). However, this comparison is misleading because it fails to allow for the relative size of the two budgets (£65 billion for healthcare and £2.5 billion for public health in 2013/2014). The coefficient on public health expenditure from column 2 of table 2 implies that a 1% increase in such expenditure (=£25.107 m) in 2013/2014 is associated with a 0.115% decline in mortality. With 446 560 deaths in England in 2013, the coefficient on public health expenditure implies that an additional £25.107 m of expenditure would avert 514 deaths (=0.115% of 446 560) and that the cost per death averted would be £48 894. Similar calculations can be made for the other outcome elasticities reported in table 2 and summarised in columns 1 and 2 of table 3. The resulting cost per death averted estimates are shown in columns 3 and 4 of table 3. The estimates reveal that the healthcare cost of a death averted is between three times (backward selection) and four times (forward selection) the size of the public health cost.
Mortality elasticities and cost per quality-adjusted life year (QALY) estimates for public health and healthcare expenditure, 2013/2014
Although interesting, the cost per death averted estimates are of limited relevance because a large proportion of CCG expenditure is not directed towards saving life but to improving the quality of life. To capture the full health effects associated with a change in expenditure, we require a measure that incorporates both survival and quality of life effects, that is, we require a measure of the number of quality-adjusted life-years (QALYs).
Unfortunately, direct estimates of the QALY effects of public health expenditure are not available. However, previous work has used the estimated mortality effects of changes in NHS healthcare expenditure to calculate the QALY effects.12 We can apply the same approach to estimate the QALY effects of public health expenditure if we assume that the distribution of mortality benefits across disease areas for public health expenditure is similar to that for CCG expenditure.
Previous work estimated that, in 2012/2013, a 1% change in total healthcare expenditure generates 65 773 QALYs across all disease areas and this result implies an all-cause mortality elasticity of −1.028. This suggests that a 1% reduction in all-cause mortality is associated with a gain of 63 981 QALYs (65 773/1.028).12 Therefore, a 1% increase in public health expenditure (£25.107 m), which reduces all-cause mortality by 0.115% is associated with a gain of 7358 QALYs (0.115×63 981). This 7358 QALY gain, together with the additional expenditure of £25.107 m, implies a cost per QALY for local public health expenditure of £3412 (column 5, table 3).
Similar calculations can be made for the two other public health elasticities (−0.081 and −0.144) reported in table 2 and the implied cost per QALY estimates are £4845 and £2725, respectively (see column 5 of table 3). Using the same method, we can also use convert the all-cause healthcare elasticities in column 2 of table 2 into cost per QALY estimates. The backward selection elasticity (=−0.672) implies a cost per QALY of £14 912, while the forward selection elasticity (=−0.837) implies a cost per QALY of £11 973 (see column 6 of table 3).
Another way to look at the impact of changes in expenditure is to calculate the total health gains/losses associated with any such change. For example, two leading health charities recently estimated that (local) public health funding would have to increase by £1 billion in 2020/2021 for real expenditure per person to be restored to its 2015/2016 level.21 We can use our cost per QALY estimates to calculate the total health gains associated with such a budget boost. If the £1 billion is allocated to public health then the total health gain will be 206 398 QALYs (=£1bn/£4845). This calculation uses the most conservative of the two elasticities for health outcomes (−0.081) associated with public health expenditure. Alternatively, if the additional £1 1 billion is allocated to healthcare then the total health gain will be 67 060 QALYs (=£1 billion/£14 912). This calculation uses the most conservative of the two elasticities for health outcomes (−0.672) associated with healthcare expenditure.
Similar health gain calculations can be made using the (less conservative) elasticities obtained using the forward selection process. The health gain estimates for public health and NHS treatment expenditure, and for forward and backward selection, are shown in columns 7 and 8 of table 3. These health gain estimates, together with 95% CIs, are illustrated graphically in figure 2.
Total health gains associated with a £1 billion budget boost for public health and NHS treatment expenditure, by method of selection of covariates. NHS, National Health Service; QALYs, quality-adjusted life years.
Using the point and SE estimates associated with the mortality elasticities in table 3, we undertook a simulation study of the difference between the public health and CCG QALY gains associated with the budget boost described in columns 7 and 8 of table 3. We made one million pairs of draws from the two distributions. We found that the public health QALY gain was greater than the CCG QALY gain in just over 94% of the draws from the backward selection estimates, and that this proportion increased to over 99% when the forward selection estimates were used. We conclude that the marginal public health QALY effect is greater than the CCG healthcare effect.
Discussion
If we compare the average of the backward and forward selection estimates, then public health expenditure appears to be about three to four times more productive than healthcare expenditure; that is, the prevention cost per QALY is about £3800 whereas the treatment cost is £13 500. Similarly, the total health gains associated with a spending boost in public health are about three and a half times as great as those associated with the same boost in healthcare expenditure. This finding—that public health offers a much better return than healthcare at the margin—is also reported by other (American) studies.10 22 Our (marginal) cost per QALY estimate for the public health grant (£3800) is about halfway between the median cost per QALY associated with public health interventions assessed by NICE between 2005 and 2010 (£1053), and between 2011 and 2016 (£7843).8
Our cost per QALY estimates for the public health grant can also be compared with the return on investment (ROI) associated with the public health interventions revealed by a systematic search of the literature.23 This reported that, across both local and national interventions, a median ROI of 14.3–1. Putting aside average versus marginal differences, we can convert the cost per QALY associated with the public health grant (of about £3800) into a societal ROI of about 15–1 if we assume that the value of a QALY is about £60 000 (this is the figure used by Treasury to evaluate public sector programmes).24 Thus our cost per QALY estimates are very much in line with the findings from other studies that have used very different data sets and very different approaches to estimation.
Our findings suggest that at the margin public health expenditure is very productive of health and more productive than NHS expenditure. This suggests that the reallocation of resources from NHS healthcare to public health is likely to improve health outcomes overall and that the squeeze on the public health grant while protecting NHS expenditure over recent years is likely to have reduced health outcomes. It also means that new investments in public health interventions need to cost less than £3800 per QALY to be accommodated within current levels of funding.
Our results also suggest that NHS expenditure is very productive of health (about £13 500 per QALY) and that it is considerably more productive than: (1) the norm (£30 000 per QALY) used by NICE to judge whether new technologies are cost-effective and (2) HM Treasury’s value of a QALY (£60 000) when assessing public sector projects.24 Our results also suggest that the inclusion of prevention expenditure in the health outcome equation does not materially affect the estimated cost per QALY associated with treatment expenditure. The cost per QALY for NHS expenditure reported here is similar to previous estimates where public health expenditure was excluded.11 12 17
Different levels of expenditure on local public health services may affect mortality both directly and indirectly. For example, a recent review estimated that approximately one in five hospital in-patients in the UK are using alcohol harmfully, and one in ten is alcohol-dependent.25 These figures are ten and eight times higher, respectively, than the general population.25 Reductions in local community-based alcohol misuse services might increase alcohol-related mortality rates. They might also increase non-alcohol-related mortality as addicts, who would have been treated in the community, now require hospitalisation and, by occupying a bed, delay other patients’ access to hospital services.
Although our results are plausible, this study is not without its limitations. First, our focus is on the impact of the public health grant (£2.5bn in 2013/2014) and we ignore the impact of other health-related expenditure (eg, such as social care). Second, we ignore the impact of national public health programmes (eg, for national immunisation and national screening programmes). These are the responsibility of the NHS Commissioning Board and are omitted because we do not have data for expenditure on national programmes by local area. Also, there will be some treatment expenditure within the public health grant, and there will be some prevention spend within the measure of CCG healthcare expenditure.
Moreover, equation (1) is static in the sense that it assumes that all health benefits occur contemporaneously with expenditure. However, our empirical implementation of (1) does slightly better than this because our outcome measure reflects not only mortality in the same year as expenditure but also in the two subsequent years. In a recent Californian study just over half of the cumulative lives saved as a result of a single year of public health spending occurred in the 2 years immediately following that expenditure.26 Nevertheless we readily acknowledge that, for some public health expenditure, the health benefits might arise many years after the expenditure has occurred. This is particularly likely to be the case where expenditure is directed at encouraging healthy lifestyles, where some benefits may occur two or three decades after the actual expenditure.
However, this study is constrained by the available public health expenditure data which are almost exclusively cross-sectional (a funding formula for public health was first introduced in 2013/2014). Implicitly we are assuming that the data represent a quasi long-run equilibrium situation, that relative expenditure levels and health outcomes within each LA have been reasonably stable over a period of time, and that any lagged of effect of current expenditure on future mortality is offset by the impact of previous expenditure on current mortality. These are not unreasonable assumptions in the English context but they are just assumptions, and they might be less appropriate for other geographies where, for example, relative outcomes have changed through time.
The final limitation that must be mentioned is that there is always the possibility that we have omitted a relevant variable (eg, one that affects both mortality and expenditure) from our regression specifications and such an omission might affect our results.
Conclusions
An increase in public health expenditure is more productive of health than a change in NHS healthcare expenditure, and hence the recent proposal to shift resources away from the latter and towards the former is an evidence-based one. However, NHS healthcare expenditure is also productive of health and the cost per QALY (£13 500) is less than one-quarter of the value of a QALY (£60 000) used by Treasury when evaluating public sector projects. These comparisons suggest that additional prevention and healthcare expenditure, whether funded through additional taxation, borrowing or reallocation from other spending departments, appear good value when compared with the Treasury’s estimates of the consumption value of health. Our cost per QALY calculations reveal that public health expenditure appears to be about three to four times more productive at the margin than healthcare expenditure. Thus Benjamin Franklin’s axiom—that ‘an ounce of prevention is worth a pound of cure’—is correct in this context in the sense that prevention is more productive than cure but, with 16 ounces to the pound, the adage rather exaggerates the size of this advantage.
Acknowledgments
We should like to thank NHS Digital for supplying the mortality data. We should also like to acknowledge the assistance received from various individuals including Michael Chaplin at the Department of Health and Social Care and Brian Ferguson and Scott Mahony at Public Health England. In addition, we should like to acknowledge the comments received from various individuals at the Department of Health and Social Care on an earlier version of this paper. Their suggestions have substantially improved the final version. Finally, we acknowledge fruitful discussions with Francesco Longo and Noemi Kreif, and helpful feedback received at a presentation of this paper in February 2020 from analysts at Public Health England and the Department of Health and Social Care.
Supplementary materials
Supplementary Data
This web only file has been produced by the BMJ Publishing Group from an electronic file supplied by the author(s) and has not been edited for content.
Footnotes
Contributors All authors (SM, JL and KC) contributed to the concept and design of this paper. SM led on the analysis and drafting, and the final paper was edited and approved by all three authors. The corresponding author attests that all listed authors meet authorship criteria and that no others meeting these criteria have been omitted. SM is the paper’s guarantor.
Funding This paper reports independent research funded by the National Institute for Health Research Policy Research Programme (NIHR PRP) through its Policy Research Unit in Economic Evaluation of Health & Care Interventions (EEPRU, grant reference 104/0001).
Disclaimer The views expressed in this publication are those of the authors and not necessarily those of the NHS, the National Institute for Health Research or the Department of Health and Social Care (DHSC).
Competing interests All authors have completed the Unified Competing Interest form (available on request from the corresponding author) and declare: financial support from the National Institute for Health Research Policy Research Programme for the submitted work; no financial relationships with any organisations that might have an interest in the submitted work in the previous 3 years; and no other relationships or activities that could appear to have influenced the submitted work.
Patient and public involvement Patients and/or the public were not involved in the design, or conduct, or reporting, or dissemination plans of this research.
Patient consent for publication Not required.
Provenance and peer review Not commissioned; externally peer reviewed.
Data availability statement Data are not available in a public, open access repository but all of the raw data are in the public domain and are available electronically. The healthcare expenditure data are available in the 2013-14 CCG Programme Budgeting Benchmarking Tool. This is available from https://www.england.nhs.uk/progbudgeting/ (accessed 14 July 2020). The socioeconomic variables have been constructed from the 2011 Population Census.These are available from the Office for National Statistics at https://www.ons.gov.uk/peoplepopulationandcommunity/populationandmigration/populationestimates/datasets/2011censuskeystatisticsforlocalauthoritiesinenglandandwales (accessed 14 July 2020). The public health expenditure data are available from ‘Local authority revenue expenditure and financing England: 2013–2014 individual local authority data—outturn which is available from https://www.gov.uk/government/statistics/local-authority-revenue-expenditure-and-financing-england-2013-to-2014-individual-local-authority-data-outturn (accessed 14 July 2020)’. The instruments for public health expenditure are available in ‘Exposition Book Public Health Allocations 2013-14 and 2014-15:Technical Guide and this is available from https://assets.publishing.service.gov.uk/government/uploads/system/uploads/attachment_data/file/213324/Public-Health-Weighted-Capitation-FormulaTechnical-Guide-v0.13.pdf (accessed 14 July 2020). The DFT variable for healthcare expenditure is available from the Department of Health’s website at-https://www.networks.nhs.uk/nhsnetworks/health-investment-network/news/2012-13-programme-budgeting-data-is-now available (accessed 14 July 2020) and the MFF and prescribing cost age indices are available from the exposition books for the 2011/2012 allocations at https:/www.gov.uk/government/publications/exposition-book-2011-2012(accessed 14 July 2020).