Article Text

Abstract
Objectives Cancer survival rates vary widely between European countries, with differences in timeliness of diagnosis thought to be one key reason. There is little evidence on the way in which different healthcare systems influence primary care practitioners’ (PCPs) referral decisions in patients who could have cancer.
This study aimed to explore PCPs’ diagnostic actions (whether or not they perform a key diagnostic test and/or refer to a specialist) in patients with symptoms that could be due to cancer and how they vary across European countries.
Design A primary care survey. PCPs were given vignettes describing patients with symptoms that could indicate cancer and asked how they would manage these patients. The likelihood of taking immediate diagnostic action (a diagnostic test and/or referral) in the different participating countries was analysed. Comparisons between the likelihood of taking immediate diagnostic action and physician characteristics were calculated.
Setting Centres in 20 European countries with widely varying cancer survival rates.
Participants A total of 2086 PCPs answered the survey question, with a median of 72 PCPs per country.
Results PCPs’ likelihood of immediate diagnostic action at the first consultation varied from 50% to 82% between countries. PCPs who were more experienced were more likely to take immediate diagnostic action than their peers.
Conclusion When given vignettes of patients with a low but significant possibility of cancer, more than half of PCPs across Europe would take diagnostic action, most often by ordering diagnostic tests. However, there are substantial between-country variations.
- international health services
- adult oncology
- primary care
This is an open access article distributed in accordance with the Creative Commons Attribution Non Commercial (CC BY-NC 4.0) license, which permits others to distribute, remix, adapt, build upon this work non-commercially, and license their derivative works on different terms, provided the original work is properly cited, appropriate credit is given, any changes made indicated, and the use is non-commercial. See: http://creativecommons.org/licenses/by-nc/4.0/.
Statistics from Altmetric.com
Strengths and limitations of this study
Recruitment of primary care practitioners (PCPs) from 20 European countries, 4 countries from each of the Northern, Southern, Eastern, Western and Central European geographical areas, provided variation in geography, health systems and levels of healthcare spending.
The questionnaire was carefully developed and piloted by general practitioners and other PCPs, and therefore grounded in their clinical experience.
While the response rate varied between countries and was low, it was comparable to that of other equivalent surveys of primary care doctors.
There was only one survey round, and follow-up rounds may have given more information about how PCPs’ decision-making changes as clinical cases evolve.
Most samples were taken from each local lead’s own localities, and these may not have been representative of their nations as a whole.
Background
Cancer survival rates vary widely across Europe.1 The fifth cycle of the European Cancer Registry-based Study on Survival and Care of Cancer Patients shows that national 1-year relative survival rates for all cancer sites vary from 58.2% to 81.1%,2 but there is no evidence on how much of this variation is attributable to infrastructure as opposed to individual physician’s clinical practice. Comparison of European 1-year and 5-year relative cancer survival rates2–5 shows that some countries have higher survival rates from most cancers (including Belgium, France, Sweden and Switzerland), while others have consistently lower survival (including Bulgaria, Croatia, Poland and Scotland). This suggests that an improvement in cancer awareness and early detection in relatively poorly performing countries could reduce the survival gap.4 While recent cancer survival rates show improvement in most countries,5 the between-country differences remain.6 However, this is not inevitable: Denmark’s considerable efforts to improve early detection rates7 have resulted in a narrowing of the gap between its own relatively poor cancer survival rates and those of its better performing Nordic neighbours.8 There has been a call for studies that compare practice between well and poorly performing countries, to help gain an understanding of how these disparities may be remedied.5
Although 1-year and 5-year relative survival can be affected by overdiagnosis and lead-time biases,9 10 poorer 1-year survival in some countries is thought to be rooted in diagnostic delay11 12 and more advanced disease at diagnosis.13 14 The more advanced a cancer is, the more difficult it is to treat it successfully15 and, for many but not all cancers, disease stage at diagnosis is associated with survival.16 17 There is considerable evidence that longer time to diagnosis and treatment increases cancer mortality.18 19 Timely diagnosis of cancer is, therefore, a cornerstone of health policy throughout Europe.20 However, there is a substantial challenge in deciding where and how to achieve this,21 as it is uncertain whether late diagnosis is due to patients with cancer presenting later, not being referred quickly enough from primary care, or whether they are inefficiently investigated, diagnosed and treated in secondary care.15 This may be a particular issue where patients with cancer present without ‘red-flag’ symptoms, as how the primary care practitioner (PCP) acts will depend to a large extent on local health service organisation.22 Balanced with a desire for more timely diagnosis of cancer is the need to avoid increased healthcare costs as well as to minimise overdiagnosis and overtreatment, though these latter concerns are particularly related to cancer screening.23–25
There is little evidence on how different healthcare systems influence PCPs’ referral decisions.21 However, a large variety of non-clinical factors affect these referral decisions.22 These include the extent of gatekeeping, funding systems, access to special investigations, concerns over litigation and barriers to accessing specialist advice as well as the availability of fast-track programmes for suspected cancer. Whether the responsibility for early detection of cancer is principally in primary or secondary care varies between countries. The International Cancer Benchmarking Partnership (ICBP)26 examined the differences in cancer awareness and beliefs between six countries with comparable wealth in an attempt to explain differences in cancer survival.27 It found a positive association between national cancer survival rates and the readiness of PCPs in those countries to investigate potential cancer symptoms.28 However, there has not yet been an investigation of how PCPs’ diagnostic actions (a key diagnostic test and/or referral to a specialist) with respect to potential cancer symptoms vary across Europe, among countries with a wide range of socioeconomic development, healthcare systems and healthcare spending. Also, while there is evidence that PCP gender can affect specialist referral rates29 30 as may the extent of their professional experience30 and whether or not they work in rural areas,31 32 this has not been assessed with regards to referrals for patients who could have cancer.
We therefore aimed to explore how the diagnostic action rates of PCPs for patients with symptoms that could be due to four types of cancers (lung, ovarian, breast and colorectal) compared across European countries and to explore the effect of PCPs’ demographics on their diagnostic action rates for these cancers.
Methods
Design
We provided clinical vignettes to PCPs from 20 European countries with markedly different socioeconomic and healthcare systems. The vignettes described patients presenting with symptoms that could indicate cancer. Recruitment started in November 2015 and was completed at the end of 2016.
Outcome measures
The primary outcome was a comparison of PCPs’ immediate diagnostic action rates (a key diagnostic test and/or referral to a specialist) for patients with symptoms that could be due to cancer across the participating European countries.
The secondary outcome was an exploratory analysis to investigate the relationship between PCPs’ demographics and their diagnostic action rates.
Study population
The Örenäs Research Group (ÖRG) is a European collaborative of primary care researchers, formed in 2013 to study the factors influencing national variations in the early diagnosis of cancer in primary care. The research was conducted in 25 ÖRG centres in 20 countries across Europe: Bulgaria, Croatia, Denmark, England, Finland, France, Germany, Greece, Israel, Italy, Netherlands, Norway, Poland, Portugal, Romania, Scotland, Slovenia, Spain, Sweden and Switzerland. Medical doctors were eligible for the survey if they were working mainly in primary care. These doctors, here referred to collectively as ‘PCPs’, included general practitioners (GPs) and other doctors who had other specialist training but worked in the community and could be accessed directly by patients without referral.
Development of the questionnaire
We used clinical vignettes as they have been validated as a measure of clinical practice.33 34 Following a literature review, ÖRG investigators developed a questionnaire designed to elicit PCPs’ demographic information and their actions for patients who could have cancer. The questionnaire with five clinical vignettes (three new ones and two designed and validated by the ICBP35 and used with permission) was piloted by the ÖRG local leads in January 2015 to check validity. More information about this process is given elsewhere.36 No changes to the demographic questions were made. One of the vignettes was found to be invalid and was removed. The next version of the questionnaire, in English, was then piloted by 49 PCPs in 16 ÖRG member countries in July 2015. No changes to the questions were made following this second pilot.
ÖRG leads arranged for translations of the questionnaire into their local languages where these were not English, a total of 19 translations from the original English. Translation and validation by backtranslation were done in a standardised way37 and are described elsewhere.38
Description of the questionnaire
The questionnaire consisted of 47 items and was divided into four sections: (a) demographic questions (questions about years since graduation, gender, rural/urban location of practice and number of doctors working in the practice), (b) referral availability questions (questions about tests and specialist opinions that were either directly or indirectly available to the respondent), (c) four fictitious clinical vignettes and (d) 20 health system factor questions. The patients’ names in the vignettes were pseudonyms. Each of the vignettes provided information on the patient’s presenting symptoms, previous medical history, medication, clinical findings and other relevant information. A factor analysis of the results of the survey section on the effect of health system factors is reported separately.39
The version of the questionnaire for PCPs in England, on which those for the other countries were based, is given in online supplemental appendix 1. We chose to make the survey anonymous, as this has been shown to improve the honesty of responses to questions that may be considered sensitive.40
Supplemental material
The demographic questions were:
How many years is it since you graduated as a doctor? Under 10 years/10–19 years/20–29 years/30–39 years/40 years or over/I prefer not to say.
Are you—female?/male?/I prefer not to say.
What type of practice do you work in? Urban/rural/island or remote/mixed.
How many doctors work in your practice/health centre in total? 1/2/3/4–5/6–7/8–9/10 or more.
The vignettes were chosen to have a low but significant possibility of cancer:
A 62-year-old male smoker with chronic obstructive pulmonary disease and now a 2-week history of a productive cough; positive predictive value (PPV) for lung cancer: 3.6%41 .
A 53-year-old woman with lower abdominal pain and abdominal distension; PPV for ovarian cancer: 3.1%42 .
A 35-year-old breastfeeding woman with an abnormal nipple discharge and eczematous changes around the nipple; PPV for breast cancer: 1.2%43 .
A 22-year-old man with coeliac disease who now has abdominal pain, rectal bleeding and diarrhoea; PPV for colorectal cancer: 3.4%.41
For each patient, a range of five possible management decisions was given, with an invitation to choose as many as needed:
‘I would write an appropriate prescription for the patient’.
‘I would arrange to see the patient again for follow-up and reassessment’.
‘I would not arrange formal follow-up, but would tell the patient under what circumstances she/he should see me again’.
‘I would organise an investigation at this consultation’.
‘I would refer the patient to a specialist at this consultation’.
Those who chose to investigate the patient were able to select from a range of possible diagnostic tests. The response of primary interest was a PCPs’ management choice that would be likely to identify a cancer as a cause of the patients’ symptoms, by either opting to request a significant diagnostic test or by referring to a specialist. The tests used in the analysis were: a plain chest X-ray or lung CT for the lung vignette; a tumour marker, diagnostic ultrasound or CT for the ovarian vignette; an ultrasound of the breast or mammography for the breast vignette; and diagnostic ultrasound, sigmoidoscopy, colonoscopy or CT colonography for the colorectal vignette.
Sample size
We aimed for a total sample size of at least 1000 PCPs, with at least 50 responses from each of the participating countries. There was a pragmatic decision to use this sample size, as some ÖRG local leads were unsure as to whether they would be able to recruit more than this number because, in their participating countries, PCPs had little experience of research using online surveys.
Recruitment of participants
Each ÖRG local lead was asked to email an invitation to take part in the survey to the PCPs in their local health district or jurisdiction and to recruit at least 50 participants. In six countries (Denmark, Norway, Portugal, Romania, Slovenia and Sweden), the invitation was distributed to a national sample. The recruitment email stated that the research aimed to identify which health system factors affect PCPs’ decisions to refer patients for further investigation. The possibility of cancer as being a cause of the vignette symptoms was not mentioned in either the recruitment email or the survey.
Distribution of the questionnaire
The questionnaire was designed using SurveyMonkey (SurveyMonkey, California, USA). Because of the study’s wide geographical coverage, online delivery of the questionnaire was used; this methodology has previously been successfully used in research involving cancer care professionals.44 45 Local leads were asked to send two follow-up reminders to encourage completion of the survey.
Statistical analysis
Demographic questions and those relating to vignette decision-making were analysed using descriptive statistics. For each individual PCP, mean vignette decision-making rates were calculated from the four individual vignette responses. Merging the vignette data has face validity as we aimed to explore PCPs’ diagnostic actions in patients with symptoms that could be due to cancer, and the four cancers between them account for 37% of new cancer cases in Europe.46 Also, other authors have merged vignette data where the aim is to compare the action of different groups of healthcare professionals, as in this study, as opposed to comparing the effect of different vignettes on their action.47 48 For comparisons between countries, means, SDs and ranges were calculated. As it was considered that some PCPs would not organise a diagnostic test because they were referring to a specialist, and conversely some PCPs would not refer to a specialist because they were organising a diagnostic test, we used a composite measure of a decision to arrange a diagnostic test and/or refer to a specialist, that is, the likelihood of taking immediate diagnostic action for cancer. To compare these rates between countries, we fitted an analysis of variance (ANOVA) model to investigate whether the differences were statistically significant. We fitted a mixed effects model, adjusted for country, to investigate the relationship between PCP demographics (as independent variables) and likelihood of immediate diagnostic action (the dependent, continuous variable). The Pearson correlation coefficient was calculated to examine correlations between PCPs’ likelihood of organising a diagnostic test and their likelihood of referring to a specialist, and between national response rates and PCPs’ likelihood of taking immediate diagnostic action in those countries. Calculations were performed using IBM SPSS V.25 and, for the mixed effects model, Stata SE V.15.1.
Patient and public involvement
There was no patient or public involvement in this study.
Results
A total of 2086 PCPs completed the questionnaire. There was a median of 72 respondents per country, range 59–446 (table 1).
Number of respondents per country, response rates, mean national cancer survival rates for the four cancers of interest
The response rate for two countries was unknown. For the other 18 countries, the median response rate was 24.8% (range 7.1%–65.6%). Participants’ demographic distributions are shown in table 2.
Demographic distributions of respondents
Organising a diagnostic test
The range of PCPs who stated that they would organise a diagnostic test at this first consultation varied from 35.6% to 80.1%, mean 54.1%, SD 11.2 (figure 1).

Percentage of primary care practitioners in each country who would organise a diagnostic test.
Referring the patient to a specialist
Across the participating countries, a mean of 33.6%, SD 13.7, range 12.3%–64.7%, of PCPs decided to refer the patient to a specialist at the first consultation (figure 2).

Percentage of primary care practitioners in each country who would refer the patient to a specialist.
Arranging a diagnostic test and/or referring the patient to a specialist
There was a strong correlation between PCPs’ likelihood of organising a diagnostic test and their likelihood of referring to a specialist: r=0.77, p=<0.001. Across the surveyed countries, the proportion of PCPs who would take diagnostic action at this first consultation varied from 50.0% to 82.1%, mean 62.6%, SD 10.3 (figure 3). This variation was statistically significant (p≤0.001).

Percentage of primary care practitioners in each country who would organise an investigation and/or refer the patients to a specialist.
Overall, the likelihood of immediate diagnostic action varied across the four cases: lung vignette 54.8%, ovarian vignette 56.7%, breast vignette 58.1% and colorectal vignette 78.1%.
Although there was a wide variation in response rates across the countries, there was no significant linear relationship between national response rates and PCPs’ likelihood of taking immediate diagnostic action in those countries (r=0.4, p=0.055, figure 4).

Association between national response rates and primary care practitioners’ likelihood of taking immediate diagnostic action.
Other PCP actions
A mean of 41.2%, SD 13.8, of PCPs indicated that they would issue a prescription to the patients in their vignettes, though the range across the 20 countries was wide (21.7%–73.3%). This is shown in figure 5.

Percentage of primary care practitioners in each country who would issue a prescription.
Between 43.7% and 77.6% of PCPs would arrange to see the patients again, mean 61.8%, SD 9.1 (figure 6).

Percentage of primary care practitioners in each country who would arrange to see the patients again.
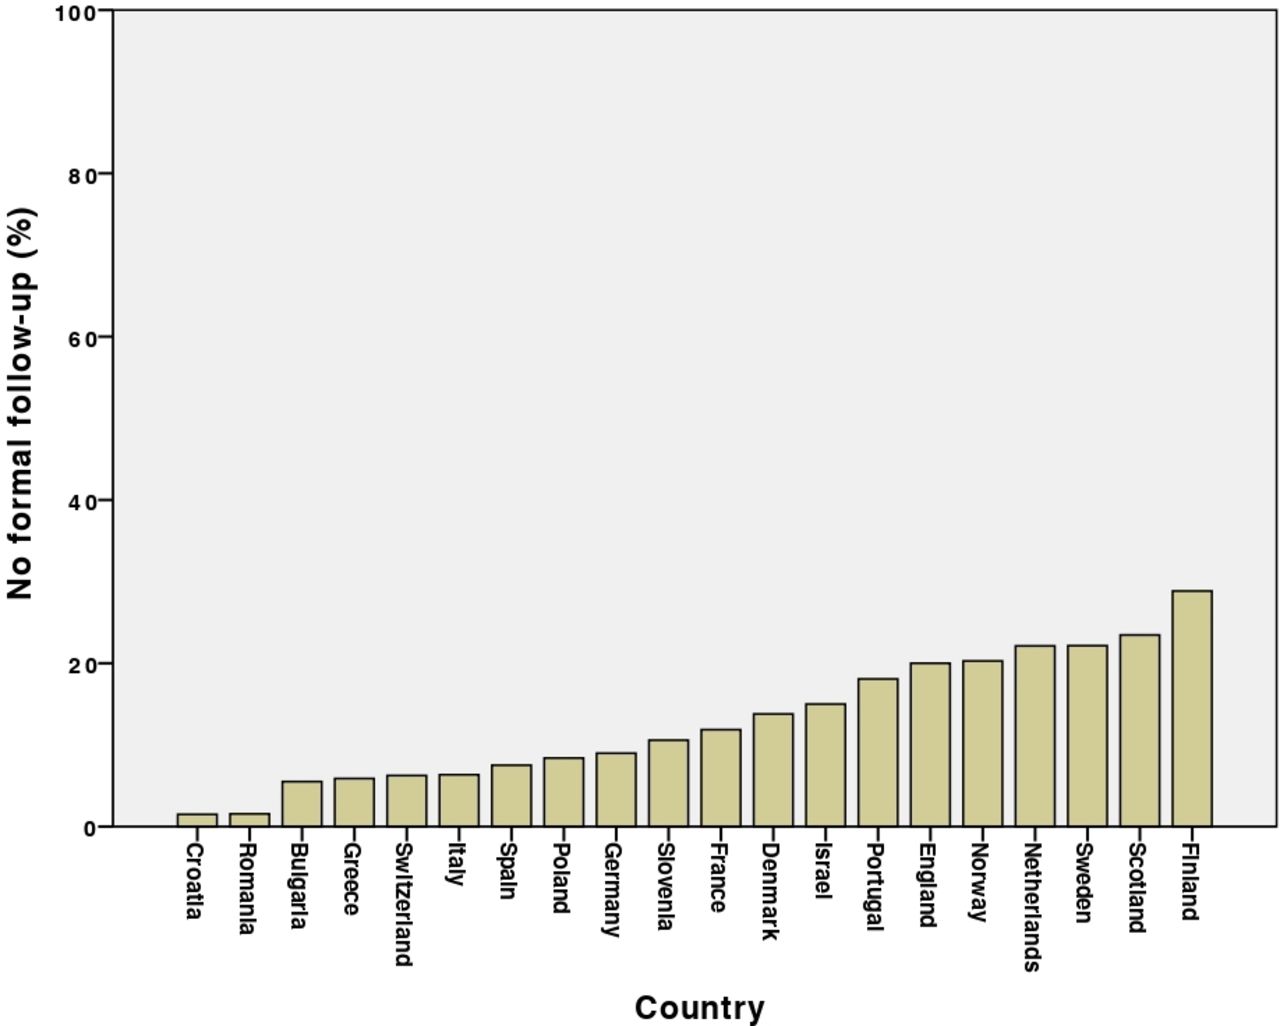
A smaller proportion, mean 12.9%, SD 7.9, range 1.6%–28.8%, indicated that they would not arrange formal follow-up but would tell the patient under what circumstances they should return (figure 7).
Percentage of primary care practitioners in each country who would not arrange formal follow-up.
Effect of PCP demographics on their likelihood of immediate diagnostic action
The results of a mixed effects model analysis indicated that the number of years since graduation was a significant predictor of likelihood of immediate diagnostic action (table 3): PCPs who had graduated within the previous 10 years were significantly less likely to investigate or refer than those who had graduated longer ago. Neither PCP gender nor size of practice had a significant effect.
Mixed effects model to investigate the relationship between PCP demographics and likelihood of immediate diagnostic action, adjusted for country
In the 12 countries with respondents who self-identified as working in remote or island practices, those PCPs were significantly more likely to take immediate diagnostic action than their colleagues (71.4% vs 60.7%, p=0.021).
Discussion
Principal findings
When faced with vignettes of patients with symptoms that could be due to cancer, PCPs’ stated actions varied markedly across 20 European countries. In all the participating countries, at least half of PCPs would have taken immediate diagnostic action (either organised a key diagnostic test or referred the patient to a specialist or both).
PCPs who were more likely to arrange a diagnostic test were also more likely to refer their patients to a specialist at the same time. PCPs who had graduated more recently were less likely to take diagnostic action in these vignettes than their more experienced peers, and PCPs working in more remote locations were more likely to take diagnostic action than their colleagues in other localities.
Strengths and limitations of this study
One of the strengths of our study is the wide spectrum of participating centres, with four countries from each of the Central, Eastern, Northern, Southern and Western European geographical areas, providing variation in geography, socioeconomic and health systems and levels of healthcare spending. It included the views of PCPs who are not usually involved in research. The questionnaire was carefully developed and piloted by GPs and other PCPs, and therefore grounded in their clinical experience. We used clinical vignettes, which have been shown to be effective for cross-national studies.45 49 There is evidence that responses to vignettes in surveys correspond well to clinical practice,28 and such surveys have previously been used to study primary care investigation preferences in patients who could have cancer.34
While vignette studies on mixed physician populations can achieve high response rates,45 49 low survey response rates are common in primary care35 36 and are known to vary between countries. However, those in our study compared favourably with those of a recent ICBP survey, in which response rates varied from 5.5% to 45.6%.50 There may be non-response bias, as those who did not complete the questionnaire may be systematically different from those who participated.
Most samples were taken from the local lead’s own localities, and these may not have been representative of their nations as a whole.51 The recruitment method used in this study resulted in variable response rates, leading to a risk of non-response bias.52 However, the goal of 50 survey participants per country and more than 1000 respondents in total was achieved. There was a trend to a relationship between national response rates and likelihood of taking immediate diagnostic action, and while this did not reach significance, it may have influenced the findings.
We have no data on non-responders as the survey was anonymous. However, the respondent anonymity might have reduced the risk of social desirability bias. While respondents gave us some demographic data, in many participating countries there were no equivalent national data on PCP demographics. This, and the low response rates in some countries, means that we were unable to be sure how representative their results were of their wider PCP populations. The varying response rates may be due to differences in how the local study leads selected PCPs for the study and national variations in PCPs’ willingness to take part in online survey research.
It is possible that the PCPs with the most interest in diagnostic decision-making were the most likely to respond. Our respondents were only able to select their management decisions from the options that we gave them; this means they might have selected an option that they would not have thought of without prompting, which may have affected the diagnostic testing and referral rates. There was only one survey round, and follow-up rounds may have given more information about how PCPs’ decision-making changes as clinical cases evolve.
Interpretation of the results
Diagnostic testing and referral rates for these vignettes differed widely between participating countries. However, the response rates were low in most of the countries surveyed, so the results should be interpreted with caution. Whereas we might expect that referring a patient would result in PCPs being less likely to organise a diagnostic test on their patient and vice versa, this was not confirmed in the survey: the more likely PCPs were to refer a patient, the more likely they were to organise a diagnostic test at the same time. The reasons for this are unclear, but it may be that PCPs who are more worried about patients with unexplained symptoms are more likely to take all the measures available to help them make a diagnosis.
While we found that PCPs working in remote locations were more likely to take immediate diagnostic action, this may be due to confounding, as doctors with young families have been found to be less likely to work rurally.53
Comparison with the existing literature
While our study shows a link between PCP diagnostic actions and both practice location and duration of PCP experience, an ICBP study found no health system characteristics that explained their findings.28 However, the ICBP study only studied six, relatively wealthy, countries (Australia, Canada, Denmark, Norway, Sweden and the UK). Another study found a lower likelihood of diagnostic action for PCPs working in larger practices.54 Our evidence that PCPs working in more remote locations were more likely to take diagnostic action for these vignettes links across to evidence that such remote living is associated with more rapid cancer diagnosis and treatment following GP referral.55 While our data show higher diagnostic action rates in PCPs with more years since graduation, the opposite was found in a Finnish study,30 and no difference was found in a UK study.56 However, those two studies did not specifically study referrals for suspected cancer: it may be that experienced PCPs are more likely to recognise symptoms that suggest a possibility of cancer, even in the absence of ‘red-flag’ symptoms, because they are more likely to have previously seen patients with those symptoms who were subsequently found to have a serious diagnosis.
The extent to which respondents were gatekeepers, and needed to authorise their patients’ access to specialist care and diagnostic tests,57 may have been a factor in their diagnostic actions. There has been a suggestion that stronger gatekeeper systems are linked with lower 1-year relative cancer survival than non-gatekeeper systems,58 possibly because gatekeeping can result in cost and resource decisions that reduce the likelihood of early referral.59 However, there are important variations in the level of gatekeeping between countries, with no simple binary model as to whether or not a country has a ‘GP-as-gatekeeper’ system, and a European study found no association between cancer survival and a probability of presentation to a GP.36
Implications for research and practice
This study has shown considerable national variation in PCPs’ actions when faced with patients who have a low but significant risk of cancer, and the reasons for this need to be investigated. While it might be expected that PCPs who are more likely to arrange a diagnostic test would be less likely to refer their patient in the same consultation, we found the opposite was the case, and research is needed to explain this.
Conclusion
When given vignettes of patients with a low but significant possibility of cancer, more than half of PCPs across Europe would take diagnostic action (a key diagnostic test and/or referral to a specialist), most often by ordering diagnostic tests. However, there are substantial between-country differences.
Supplemental material
Acknowledgments
We would like to thank all the PCPs who piloted the questionnaire and those who completed the survey. We would also like to thank the European GP Research Network for its support. We are grateful to Professor Barbara Silverman and Professor Lital Keinan for the data on cancer survival rates in Israel, and to Dr Yochai Schonmann for his work on those data. Two of the vignettes were used by kind permission of the ICBP; we also thank Dr Peter Murchie and Dr Rhona Auckland, who generously provided the other two vignettes. Professor Antonius Schneider kindly organised the Technical University of Munich’s data collection.
References
Footnotes
Twitter @CAPCAberdeen, @Sven_Streit
Contributors IA-A, JA, KB, MB, NB, G-JD, ME, GF, SGB, MH, RH, EJ, TK, MM, PM, ALN, AP, DP, MPS, JS-P, ES, SS, GT, HT, PV and BW participated in the study design. All authors except GT were involved in the data collection. All authors contributed to the manuscript and approved the final version. MH had overall responsibility for the study design, recruitment of local leads, analysis of data and interpretation of results. GT advised on the study design and the statistical analysis.
Funding ALN’s time is supported by the National Institute for Health Research (NIHR) Imperial Patient Safety Translation Research Centre, with her infrastructure support provided by the NIHR Imperial Biomedical Research Centre (BRC).
Competing interests None declared.
Patient consent for publication Not required.
Ethics approval Ethical approval for the study was given by the University of Bath Research Ethics Approval Committee for Health (approval date: 24 November 2014; REACH reference number: EP 14/15 66). Other countries’ study leads either achieved local ethical approval or gave statements that formal ethical approval was not needed in their jurisdictions (see supplemental file). Consent was implied by agreeing to take part in the survey.
Provenance and peer review Not commissioned; externally peer reviewed.
Data availability statement To avoid the risk of identification of individual participants, the datasets generated and analysed during the current study are not publicly available. However, they are available (with participants’ identifying information redacted) from the corresponding author on reasonable request.