Article Text

Abstract
Objectives The accuracy of the ascertainment of vital status impacts the validity of cancer survival. This study assesses the potential impact of loss-to-follow-up on survival in Japan, both nationally and in the samples seen at individual hospitals.
Design Simulation study
Setting and participants Data of patients diagnosed in 2007, provided by the Hospital-Based Cancer Registries of 177 hospitals throughout Japan.
Primary and secondary outcome measures We performed simulations for each cancer site, for sample sizes of 100, 1000 and 8000 patients, and for loss-to-follow-up ranging from 1% to 5%. We estimated the average bias and the variation in bias in survival due to loss-to-follow-up.
Results The expected bias was not associated with the sample size (with 5% loss-to-follow-up, about 2.1% for the cohort including all cancers), but a smaller sample size led to more variable bias. Sample sizes of around 100 patients, as may be seen at individual hospitals, had very variable bias: with 5% loss-to-follow-up for all cancers, 25% of samples had a bias of <1.02% and 25% of samples had a bias of > 3.06%.
Conclusion Survival should be interpreted with caution when loss-to-follow-up is a concern, especially for poor-prognosis cancers and for small-area estimates.
- survival analysis
- oncology
- simulation
- registries
- prognosis
This is an open access article distributed in accordance with the Creative Commons Attribution Non Commercial (CC BY-NC 4.0) license, which permits others to distribute, remix, adapt, build upon this work non-commercially, and license their derivative works on different terms, provided the original work is properly cited, appropriate credit is given, any changes made indicated, and the use is non-commercial. See: http://creativecommons.org/licenses/by-nc/4.0/.
Statistics from Altmetric.com
Strengths and limitations of this study
The ascertainment of vital status impacts the validity of cancer survival.
This study assessed impact of loss-to-follow-up for small populations using Hospital-Based Cancer Registries in Japan.
The expected bias was not associated with the sample size, but a smaller sample size led to more variable bias.
The probable range of the loss-to-follow-up rate was simulated without the tendency of incompleteness in the real data.
Survival estimates must be interpreted with caution even with small rates of loss-to-follow-up, particularly for smaller samples.
Background
Survival statistics are the most-used measures to estimate cancer patients prognosisand the likely course of their disease, and are of great interest to patients, clinicians, researchers and policy makers.1 Cancer survival estimates are employed by policymakers to compare cancer outcomes between different populations and time periods.1 In Japan, the equalisation of cancer medical services is a key issue for cancer control strategy.2 Hospital-level survival estimates would be useful for assessing progress toward equalisation of services, but interpreting these estimates requires an understanding of limitations, biases, underlying stochastic processes, and clinical and biological insight.3
In Japanese survival statistics of the Hospital-Based Cancer Registry (HBCR), data of hospitals that have over 90% of follow-up for their cancer patients were used for survival estimates (the high-completeness hospitals) in order to avoid overestimates of survival, as we do not have an official system to link death certificates with HBCR data for patients diagnosed before 2015. Loss-to-follow-up is still a potential limitation of Japanese cancer survival estimates: around 5.7% of patients diagnosed in 2007 were lost-to-follow-up even in the high-completeness hospitals included in the national reporting.4 The National Cancer Center collects data from the HBCR of every designated cancer-care hospital, starting with cancer cases diagnosed in 2007.4 In the HBCRs, patients’ vital status during follow-up is obtained by matching hospital databases with resident cards held by provincial governments using patients’ names and postal addresses and by recording deaths occurring in hospital. Loss-to-follow-up may occur when patients move around the country or when mis-recording of patients’ names or postal addresses leads to linkage failure. For these patients, survival was censored at their most recent visit to the hospital, an approach giving accurate results only if the reasons they were lost-to-follow-up were not related to survival.
Use of cancer survival estimates to assess equalisation of cancer medical services naturally involves comparing estimates based on the relatively small number of patients treated by individual hospitals. Previous studies exploring the impact of loss-to-follow-up on survival estimates in a large sample (national survival statistics) focused on the expected impact5–12 and demonstrated that even modest levels of under-registration of deaths might lead to severe overestimation of long-term survival. To understand the possible impact of loss-to-follow-up on results for small areas and individual hospitals, it is important to describe the variance of the bias as well as the expected bias. This study uses Monte Carlo simulations to assess the impact of loss-to-follow-up on Japanese cancer survival estimates for different sample sizes to represent the variation resulting when reporting at hospital and other scales.
Methods
Data source
A subset of incident cases diagnosed in 2007 in the HBCR of 177 designated cancer-care hospitals throughout Japan was used for the analysis.
The inclusion criteria were:
Patients aged 15 years or older at diagnosis.
Patients received the first course of treatment at the hospital.
This prevents duplicate records of patients treated at multiple hospitals.
Patients had 5 years of complete follow-up after diagnosis. Therefore, we only used data of known follow-up cases for simulation (complete cases).
In total, 163 084 cancer cases were included: 25 890 cases for stomach, 20 603 cases for colon and rectum, 8694 cases for liver, 20 623 cases for lung, 14 764 cases for female breast and 72 510 for other cancers. The mean age of cancer cases was 68.4 years (SD 10.9) for stomach, 68.0 years (SD 11.5) for colorectal, 69.0 years (SD 9.6) for liver, 69.2 years (SD 10.1) for lung and 58.2 years (SD 13.0) for female breast.
Data generating mechanism
Sampling with replacement was used to generate 10 000 datasets for each of the 108 permutations of loss-to-follow-up rates, cancer site and sample size discussed below.
Loss-to-follow-up rate: Loss-to-follow-up rates of 1%, 2%, 3%, 4% and 5% were considered, as well as an empirical estimate based on real loss-to-follow-up rates in the high-completeness hospital data of 2007 (6.3% for those aged 15–39; 3.8% for 40–49; 2.7% for 50–59; 2.4% for 60–69; 3.0% for 70–79; and 5.0% for those aged 80 or older). When we simulated the loss-to-follow-up rate of 1% up to 5%, we randomly selected loss-to-follow-up cases across the whole cancer-specific cohorts. In age-specific simulations, we selected these cases randomly after stratifying by age group.
Cancer site: Survival estimates were produced for each major cancer site (stomach, colorectal, liver, lung and female breast) individually, as well as for all cancers combined.
Sample size: Samples of 100, 1000 and 8000 patients were considered, representing potential incidence at different levels of geography (eg, an individual hospital at 100 patients and Japan at 8000 or more).
Loss-to-follow-up was applied by marking patients identified as ‘lost to follow-up’ as alive regardless of their true vital status. The probability of loss-to-follow-up in this simulation study was not related to the survival time of the patient.
Performance measure
We assessed performance using bias in the 5-year survival estimate due to loss-to-follow-up; it was calculated as the difference between the Kaplan-Meier estimators based on the accurate survival data and on the data with loss-to-follow-up in each of the 10 000 datasets for each of the 108 permutations.
The average bias across the 10 000 datasets, the empirical SD and the IQR of the bias were assessed.
All analyses were performed using Stata V.14.0 (Stata Corporation).
Results
Survival for complete cases
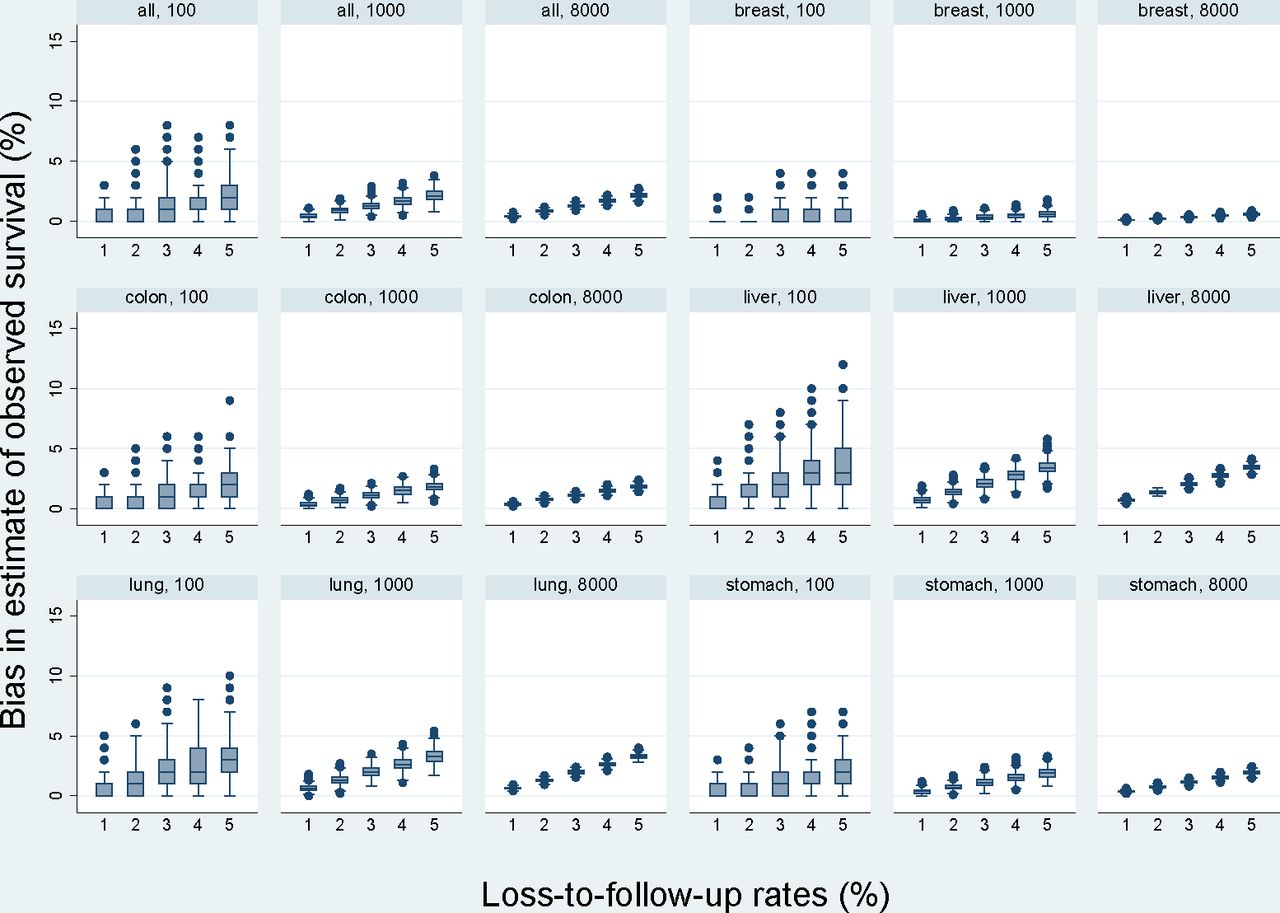
The 5-year crude survival rate of all cancers for complete cases was 56.6% (95% CI, 56.4% to 56.8%). The 5-year crude survival rate for complete cases was 61.5% (95% CI, 60.9% to 62.1%) for stomach, 62.9% (95%CI, 62.2% to 63.5%) for colorectal, 31.0% (95%CI, 30.1% to 32.0%) for liver, 34.0% (95%CI, 33.4% to 34.6%) for lung and 88.2% (95%CI, 87.6% to 88.7%) for female breast. Figure 1 shows the result of simulation of loss-to-follow-up rates of 1%, 2%, 3%, 4% and 5%. Figure 2 shows the result of simulation of empirical estimates based on real loss-to- follow-up rates in the high-completeness hospital data of 2007.

Distribution of bias resulting from 1% up to 5% loss-to-follow-up by different sample sizes.

Distribution of bias resulting from observed rates of loss-to-follow-up by different sample size. Empirical estimate based on real loss-to-follow-up rates in the high-completeness hospital data of 2007 (6.3% for those aged 15–39; 3.8% for 40–49; 2.7% for 50–59; 2.4% for 60–69; 3.0% for 70–79; and 5.0% for those aged 80 or older).
Sample size
The expected bias was not associated with the sample size (figure 1), but a smaller sample size led to a more variable bias. Sample sizes of around 100 patients, as may be seen at individual hospitals, had a very variable bias: with 5% loss-to-follow-up for all cancers, 25% of samples had a bias of <1.02% and 25% of samples had a bias of >3.06%. This appears to be exacerbated for sites with poor prognosis (figure 1; table 1). In liver cancer, 4.76% of estimates have >5%-points of error in samples of 100 patients. With larger samples, particularly with 8000 or more cases, the variation in bias becomes inconsequential.
Summary results across 10 000 simulations for each cancer site, with loss-to-follow-up probabilities by age group based on those seen in real data
Loss-to-follow-up rate
Higher loss-to-follow-up rates gave more bias in the survival estimates (figure 1; online supplementary appendix table 1), but had less impact on the spread of the bias. If we look at liver cancer, the expected bias with 1% loss-to-follow-up in a sample of 1000 was 0.71% with an SD of <0.27%, but with 5% loss-to-follow-up it was 3.49% with an SD of 0.59%.
Supplemental material
Cancer site
Loss-to-follow-up introduced more bias and more variable bias for cancer sites with poor prognosis (figures 1 and 2; table 1). The expected bias with loss-to-follow-up, similar to that observed empirically for lung cancer, was around 2.12% (SD 0.16%–1.43%), while for breast cancer it was only 0.40% (SD 0.07%–0.63%).
Discussion
Loss-to-follow-up rates consistent with those seen in Japan in 2007 incidence data lead to highly variable bias in survival estimates for small populations. Hospital-level survival comparisons should be avoided, as some loss-to-follow-up is likely to introduce a large overestimation of survival rates for some hospitals but not for others, even if the loss-to-follow-up rate is the same for all hospitals. Previous studies have demonstrated that higher loss-to-follow-up leads to survival estimates with more bias, especially for cancers with poor prognosis;9 this study also found similar trends in both large and small samples.
Our empirical data shows that a higher proportion of patients aged 15–39 years and over 80 years were lost to follow-up than in other groups. Follow-up currently relies on linking patients to their resident card to ascertain their vital status. Loss-to-follow-up among younger people may be due to patients marrying and changing their names or due to moving to other places. Lower follow-up for elderly patients may be due to their moving more frequently after discharge from the hospital because of difficulties living alone, for example, into a nursing home. The number of older patients has recently been increasing in the designated cancer-care hospitals.13 This will make it difficult to estimate unbiased survival for cancer patients without any official system to follow-up for cancer patients.
Our study has several limitations. First, we considered a probable range for the loss-to-follow-up rate for the simulation work. We do not know the incompleteness of death ascertainment in the real data, which may affect the true survival rate used as a baseline, and so we cannot estimate true survival from this simulation. Second, we used data for patients diagnosed in 2007. This data is the data collected in first year in Japan by HBCR. Cancer registries may have lacked experience gathering data items needed to estimate survival, and some data, such as follow-up-days or last-contact date, may have been miss-recorded. Third, when patients are known to be lost-to-follow-up in real data, their survival is censored at the date they were last known to have been alive. Such loss-to-follow-up is likely to be informative censoring, and our results could be viewed as an approximate upper bound on the bias. Finally, this simulation only considers absolute survival. Previous studies report that, in general, relative survival is much more affected by incomplete registration of deaths than absolute survival, and potential problems are much larger for relative survival estimates in older patients compared with younger.7 Even more care will be needed when interpreting relative survival estimates.
Conclusion
Loss-to-follow-up of the level currently observed in HBCR in designated cancer-care hospitals in Japan introduces substantial and variable bias into cancer survival estimates for small samples. Until we achieve >99% completeness in ascertainment of survival status, we must interpret survival estimates with caution, particularly for smaller samples (eg, individual hospitals). An official follow-up system is required to support unbiased estimation of survival.
Patient and public involvement
This study is based on historical hospital-level data collected for the purpose of national disease registration. The research question and outcome measures are aimed at assessing standard epidemiological outputs, and patients were not involved in this study.
Acknowledgments
We would like to thank the members of cancer registries in Japan for allowing us to use the data for this simulation.
Footnotes
Contributors AO, MB and CC planned the study design. AO and TH were involved in the data collection. AO and MB carried out the analysis. AO, MB and CC wrote the draft manuscript. AO, MB, CC and TH were responsible for the interpretation of the data and have participated in writing and approving the final manuscript version.
Funding This work was supported by the Cancer Research and Development Fund of National Cancer Center, Japan (H29-A-17).
Competing interests None declared.
Patient consent for publication Not required.
Ethics approval The Institutional Review Board at the National Cancer Center in Japan approved this study (2015-335).
Provenance and peer review Not commissioned; externally peer reviewed.
Data availability statement Data were obtained from a third party and were not publicly available.