Article Text

Abstract
Objective Identifying individuals with high risk of type 2 diabetes is important. To evaluate discriminatory ability of multiple biomarkers for type 2 diabetes in a Chinese population.
Methods Plasma adiponectin, plasminogen activator inhibitor-1, retinol-binding protein 4, resistin, C-reactive protein, interleukin 6 (IL-6), tumour necrosis factor α receptor 2 and ferritin were measured in a population-based sample of 3189 Chinese (1419 men and 1770 women) aged 50–70 years. A weighted biomarkers risk score (BRS) was developed based on the strength of associations of these biomarkers with type 2 diabetes. The discriminatory ability was tested by the area under receiver operating characteristics curve (AUC).
Results Adiponectin, plasminogen activator inhibitor-1, IL-6 and ferritin were independently associated with the prevalence of type 2 diabetes, and they were used to calculate the biomarkers risk score (BRS). After adjustment for the confounding factors, the ORs for type 2 diabetes and impaired fasting glucose with each point increment of BRS were 1.28 (95% CI 1.22 to 1.34) and 1.16 (1.12 to 1.20), respectively. Compared with those in the lowest quintile of the BRS, the participants in the highest quintile have an OR (95% CI) of 6.67 (4.21 to 10.55) for type 2 diabetes. The area under the curve for the BRS and conventional risk factors alone was 0.73 and 0.76, respectively, and substantially increased to 0.81 after combining both BRS and conventional risk factors (p<0.001).
Conclusions These data suggest that combining multiple biomarkers and conventional risk factors might substantially enhance the ability to identify individuals with type 2 diabetes. More prospective data are warranted to confirm this observation.
- Type 2 diabetes
- biomarker risk score
- receiver operating characteristic
- AUC
- population-based study
- general diabetes
This is an open-access article distributed under the terms of the Creative Commons Attribution Non-commercial License, which permits use, distribution, and reproduction in any medium, provided the original work is properly cited, the use is non commercial and is otherwise in compliance with the license. See: http://creativecommons.org/licenses/by-nc/2.0/ and http://creativecommons.org/licenses/by-nc/2.0/legalcode.
Statistics from Altmetric.com
- Type 2 diabetes
- biomarker risk score
- receiver operating characteristic
- AUC
- population-based study
- general diabetes
Article summary
Article focus
Development of type 2 diabetes could be delayed or even prevented by lifestyle modification. Identifying individuals with high risk of type 2 diabetes is important.
This study evaluated the discriminatory ability of multiple biomarkers for type 2 diabetes in a Chinese population.
Key messages
Plasma adiponectin, plasminogen activator inhibitor-1, retinol-binding protein 4, resistin, C reactive protein, interleukin 6, tumour necrosis factor-α receptor 2 and ferritin were measured in a population-based sample of 3189 Chinese. A weighted biomarkers risk score (BRS) was developed based on the strength of associations of these biomarkers with type 2 diabetes.
After adjustment for the confounding factors, the OR for type 2 diabetes with each point increment of BRS was 1.28 (95% CI 1.22 to 1.34). The area under the curve for the BRS and conventional risk factors alone was 0.73 and 0.76, respectively, and substantially increased to 0.81 after combining both BRS and conventional risk factors (p<0.001).
These finding suggested that combining multiple biomarkers and conventional risk factors might substantially enhance the ability to identify individuals with type 2 diabetes.
Strengths and limitations of this study
This is the first study simultaneously assessing the discriminatory ability of multiple biomarkers together with conventional risk factors for type 2 diabetes in a large population-based sample from the north and south of China.
Limitations including, the cross-sectional nature of the study, did not allow determination of the extent to which diabetes incidence would be predicted by the BRS; fasting glucose was measured only once. The oral glucose tolerance test, which was time-consuming and labour intensive, was not performed in such a large population.
Introduction
In parallel with rapid nutritional and lifestyle changes, such as an increased energy-dense diet and reduced physical activity, the prevalence of type 2 diabetes has reached epidemic level and currently affects 92.4 million (9.7%) Chinese adults.1 About two-thirds of these patients had previously undiagnosed diabetes.2 Poor control of diabetes will lead to development of severe complications and substantially increase medical and socioeconomic burdens.2 Compelling evidence has indicated that onset of type 2 diabetes could be delayed or even prevented by lifestyle modification.3 Thus, identifying individuals at high risk at an early reversible stage of the disease is critical for controlling the type 2 diabetes epidemic trend.
To predict or classify type 2 diabetes, several scoring systems have been developed based on lifestyle factors,4–7 anthropometric markers4–6 or genetic factors.8–10 Type 2 diabetes is a multifactorial disease, and its pathogenesis involves dysregulation of various biological pathways as well as an unfavourable profile of multiple cytokines such as adiponectin, plasminogen activator inhibitor-1 (PAI-1), C-reactive protein (CRP) and interleukin 6 (IL-6) in these pathways.11 However, most studies have focused on the effect of a single cytokine on the risk of diabetes and few have investigated the collective effect of these biomarkers together with traditional risk factors in predicting the development of type 2 diabetes.12 In a recent report based upon the finding from a subset population of the Inter99 Cohort, a lifestyle intervention trial, a diabetes risk score composed of adiponectin, CRP, ferritin, IL-2 receptor A, glucose and insulin was shown to provide a better predictive power for having type 2 diabetes than a single variable among overweight Caucasian people.13 However, little is known about whether these circulating biomarkers might also be useful for predicting or screening high-risk individuals among free-living Chinese populations, who are considered to have a higher susceptibility to metabolic disorders even within ‘low-risk’ range of inflammatory cytokine such as CRP according to the criteria for Western populations.14
Therefore, this study aimed to evaluate whether the combination of eight plasma biomarkers, including adiponectin, PAI-1, retinol-binding protein 4 (RBP4), resistin, CRP, IL-6, tumour necrosis factor α receptor 2 (TNF-α-R2) and ferritin could improve the discriminatory ability for type 2 diabetes individuals in middle-aged and older Chinese men and women.
Subjects and methods
Study subjects
The study population included 3189 Shanghai and Beijing residents aged 50–70 years from the Nutrition and Health of Aging Population in China. This study was conducted simultaneously both in Beijing and Shanghai from March to June 2005. The participants were recruited by a multistage sampling method. In each city, two urban districts and one rural district were chosen to represent different socioeconomic statuses. We planned to select 400 participants from each urban district and 800 people from each rural district from the eligible candidates listed in the residential registration record. The eligibility of the candidates was defined as those who had been stable residents for at least 20 years in the areas. Those with severe psychological disorders, physical disabilities, cancer, cardiovascular disease, Alzheimer's disease, or currently diagnosed with tuberculosis, AIDS, and other communicable diseases were excluded.
The study design and protocols have been described elsewhere.14 In brief, information on demographic characteristics, health status, lifestyle practice and physical activity was collected using a standard questionnaire. Body weight and height were measured and body mass index (BMI) was calculated as weight (kg)/ height (m2). Overnight fasting plasma samples were collected and stored at −80°C until laboratory assays were performed. The study protocol was approved by the institutional review board of the Institute for Nutritional Sciences, and all participants provided written informed consents. A total of 3189 participants (1419 men and 1770 women) with none of the eight selected biomarkers missing were included in this study. Individuals were defined as having type 2 diabetes if they had a fasting glucose ≥7.0 mmol/l, or previously diagnosed type 2 diabetes, or used hypoglycaemic drugs including insulin. Impaired fasting glucose (IFG) and normal fasting glucose (NFG) were defined as a participant with a fasting glucose level ≥5.6 to <7.0 mmol/l and <5.6 mmol/l, respectively.
Laboratory measurement
Plasma fasting glucose was measured enzymatically on an automatic analyzer (Hitachi 7080, Japan) with reagents from Wako Pure Chemical Industries (Osaka, Japan).14 HbA1c was quantified from erythrocyte with automated immunoassay (Roche Diagnostics, Indianapolis, Indiana, USA).14 Plasma adiponectin, PAI-1 and resistin concentrations were analysed by Luminex xMAP Technology on a Bio-Rad Multiplex Suspension Array System with an intra-assay coefficient of variation (CV) of 1.4–7.9% and an interassay CV<21%.15 16 Circulating RBP4 was evaluated in duplicate by a sandwich ELISA kit developed in-house, with an intra-assay CV of 1.8–7.6% and an interassay CV of 3.7–8.8%.17 Plasma high-sensitivity CRP was measured by a particle-enhanced immunoturbidimetric assay (Roche Diagnostics), and both intra-assay and interassay CV of CRP levels were <12%.14 IL-6 was determined with a high-sensitivity ELISA (R&D Systems, Inc, Minneapolis, Minnesota, USA), with both intra-assay and interassay CVs <10%.14 Soluble TNF-α-R2 was detected with a Human Death Receptor 3-Plex kit (Biosource International, Inc, Camarillo, California, USA) through the Multiplex Suspension Array System. the average intra-assay CV and interassay CVs for TNF-α-R2 were 7.9% and 10.1%, respectively.18 Plasma ferritin was assayed using a commercially available particle-enhanced immunoturbidimetric kit (Shanghai Gensource Co, Ltd, Shanghai, China).19 The intra-assay CV of ferritin measurements was <2.0%, whereas the interassay CV was <6.1%.
Statistical analyses
A multivariate logistic regression was applied to estimate the ORs for individual biomarkers. Results for the association for each single biomarker have been reported elsewhere.15 16 18 19 The corresponding β coefficients (log ORs) in logistic regression models were employed to assign a score value for each biomarker; only the biomarkers with p values <0.05 after including all the eight biomarkers in the model with forward selection were then selected in the scoring system. A weighted biomarkers risk score (BRS) was developed based on the assumption that selected biomarkers have independent effects on type 2 diabetes and also contribute to diabetes risk in an additive manner.20 Accordingly, adiponectin, PAI-1, IL-6 and ferritin were used to compute a BRS which was derived as the following equation: BRS=κ × (β1 × biomarker1+β2 × biomarker2+…+βκ × biomarkerκ)/(β1+β2+…+βκ). Where κ represents the number of the biomarkers used (in this study κ=4), βί is the assigned sore value of each biomarker corresponding to the log (OR) in logistic regression, biomarkerί assigned to 0, 1, 2 or 3 according to low to high quartile of the specific biomarker.20 The quartiles of adiponectin were assigned as 3, 2, 1 or 0, because of its inverse association with diabetes risk. The confounding factors, which were adjusted in the logistic regression models included age, sex, geographical region (Shanghai or Beijing), residence (urban or rural), smoking status (ex-smoker, current smoker and non-smoker), alcohol drinking (yes or no), physical activity (low, moderate or high), family history of diabetes (yes or no) and BMI. Area under the receiver operator characteristic curve (AUC) was calculated to evaluate the ability of BRS and conventional risk factors alone or collectively in discriminating the prevalence of type 2 diabetes. Net reclassification improvement (NRI) and integrated discrimination improvement (IDI) statistics were also applied to test the discriminative ability.21 The categories <10%, 10–20%, 20–35% and >35% were used in the reclassification analyses. Analyses were performed using SAS V.9.2 (SAS Institute). All reported p values are two-sided and considered statistically significant for p<0.05.
Results
The characteristics of the 3189 participants are presented in table 1, the prevalence of type 2 diabetes and IFG were 13.6% (n=434) and 26.9% (n=858), respectively. As expected, the participants with type 2 diabetes had lower plasma adiponectin, but higher concentrations of RBP4, PAI-1, CRP, IL-6 and ferritin than their IFG and NFG counterparts. The risk for type 2 diabetes increased with lower adiponectin and higher PAI-1, CRP, IL-6 and ferritin (all p<0.001 for trend), but not with RBP4, resistin or TNF-α-R2 levels (supplemental table 1 and supplemental figure 1). Multiple logistic regression analysis with forward selection included all of these eight biomarkers in the model showed that adiponectin, PAI-1, IL-6 and ferritin were significantly and independently associated with type 2 diabetes. Thus, these four biomarkers were used to develop a weighed BRS.
Characteristics of the study population*
Compared with NFG participants, the participants with type 2 diabetes have significantly higher level of BRS (median (IQR): 7.62 (5.86–9.26) vs 5.21 (3.40–7.18), p<0.001, table 1). The distribution of BRS was shifted right in diabetic individuals compared with those with NFG (figure 1). After adjustment for age, sex, region, residence, smoking, alcohol drinking, physical activity, family history of diabetes and BMI, the ORs for type 2 diabetes and IFG with each point increment of BRS were 1.28 (95% CI 1.22 to 1.34; p<0.001) and 1.16 (95% CI 1.12 to 1.20; p<0.001), respectively (table 2). Similar ORs were observed among both sexes (p for interaction=0.48 and 0.49 for diabetes and IFG, respectively) and age groups defined by the cut-off point of 60 years (p for interaction=0.38 and 0.49 for diabetes and IFG, respectively). Among individuals with a score >10 (7.4%), the ORs were 9.95 (95% CI 5.46 to 18.13) for type 2 diabetes and 3.96 (95% CI 2.57 to 6.10) for IFG compared with those with BRS ≤3.0 (14.86%) (figure 2). A similar association was also found when the subjects were categorised into the BRS quintiles (table 2). Compared with the lowest quintile (BRS≤3.5), the ORs in the highest quintile (BRS>8.5) were 6.67 (95% CI 4.21 to 10.55) for type 2 diabetes and 3.09 (95% CI 2.29 to 4.19) for IFG after controlling for the confounding factors.
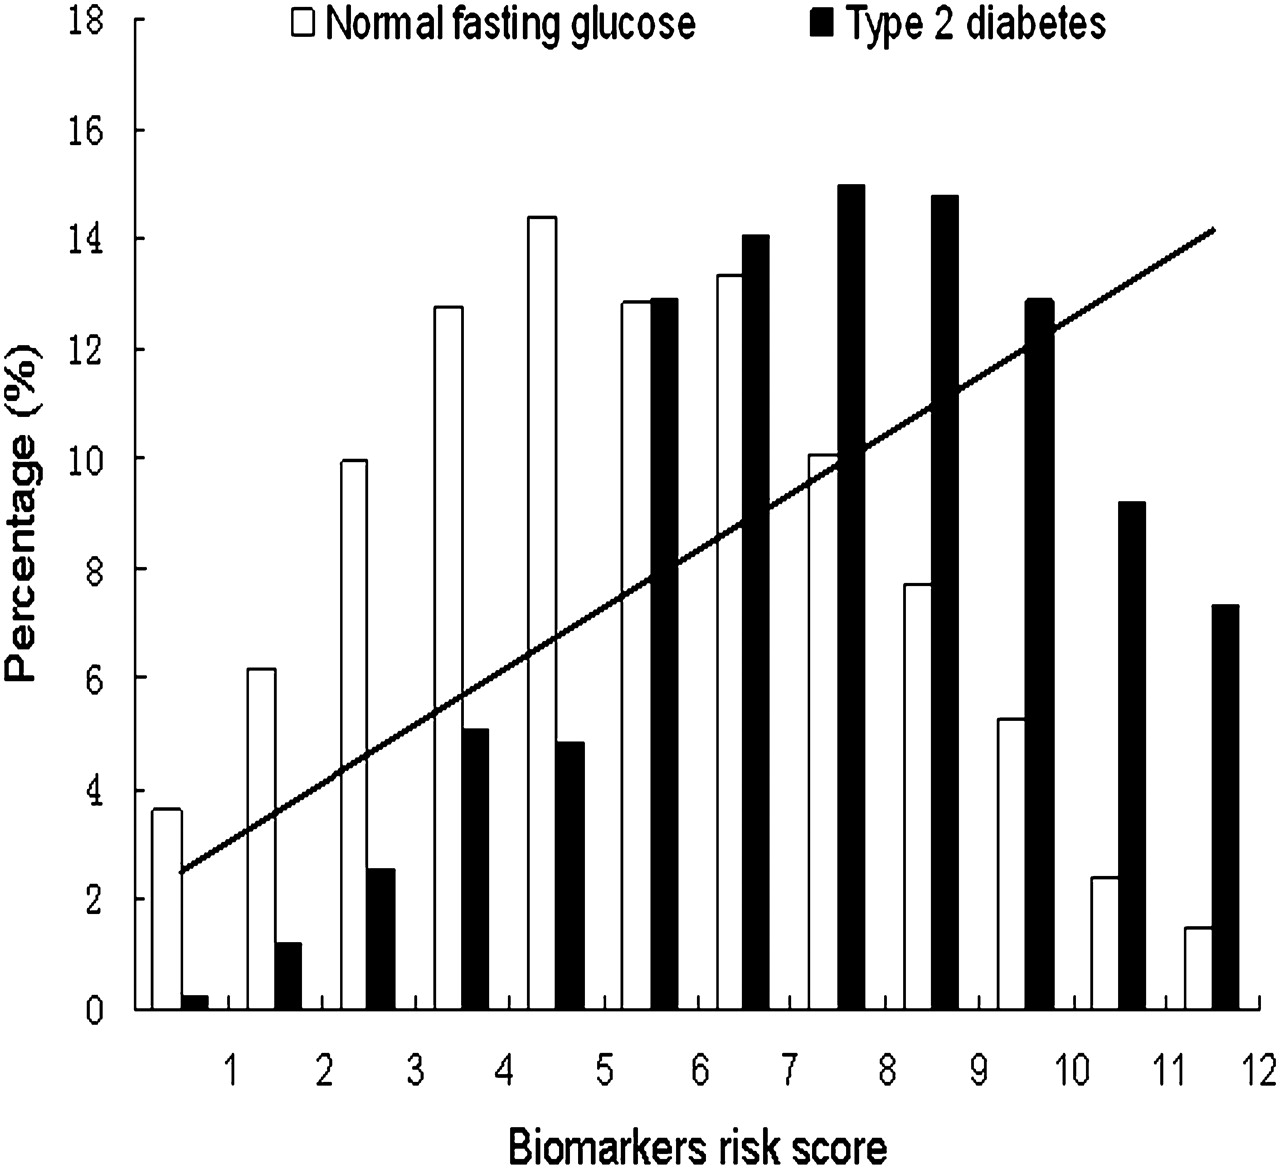
Percentage of participants in each biomarkers risk score category among those who had normal fasting glucose and type 2 diabetes. Risk of developing type 2 diabetes according to biomarkers risk score is shown as a fitted line from regression analysis.
Association of biomarkers risk score (BRS) and risk of type 2 diabetes and impaired fasting glucose (IFG)

Risk of type 2 diabetes (A) and impaired fasting glucose (IFG) (B) in each biomarkers risk score category after adjustment for age, sex, region, residence, smoking, alcohol drinking, physical activity, family history of diabetes and body mass index.
The interaction between BRS and BMI on the prevalence of type 2 diabetes was also examined (supplemental figure 2). In multivariate analysis adjusted for age, sex, region and residence, the odds of type 2 diabetes within each category of BMI increased significantly from the bottom to the top BRS quintile (p<0.0001 for trend). Obese participants (BMI ≥28 kg/m2) in the highest BRS quintile had an OR of 7.08 (95% CI 3.98 to 12.59) compared with their normal-weight counterparts (BMI <24 kg/m2) in the lowest quintile of BRS. However, no significant interaction was found between BRS and BMI (p=0.51 for interaction).
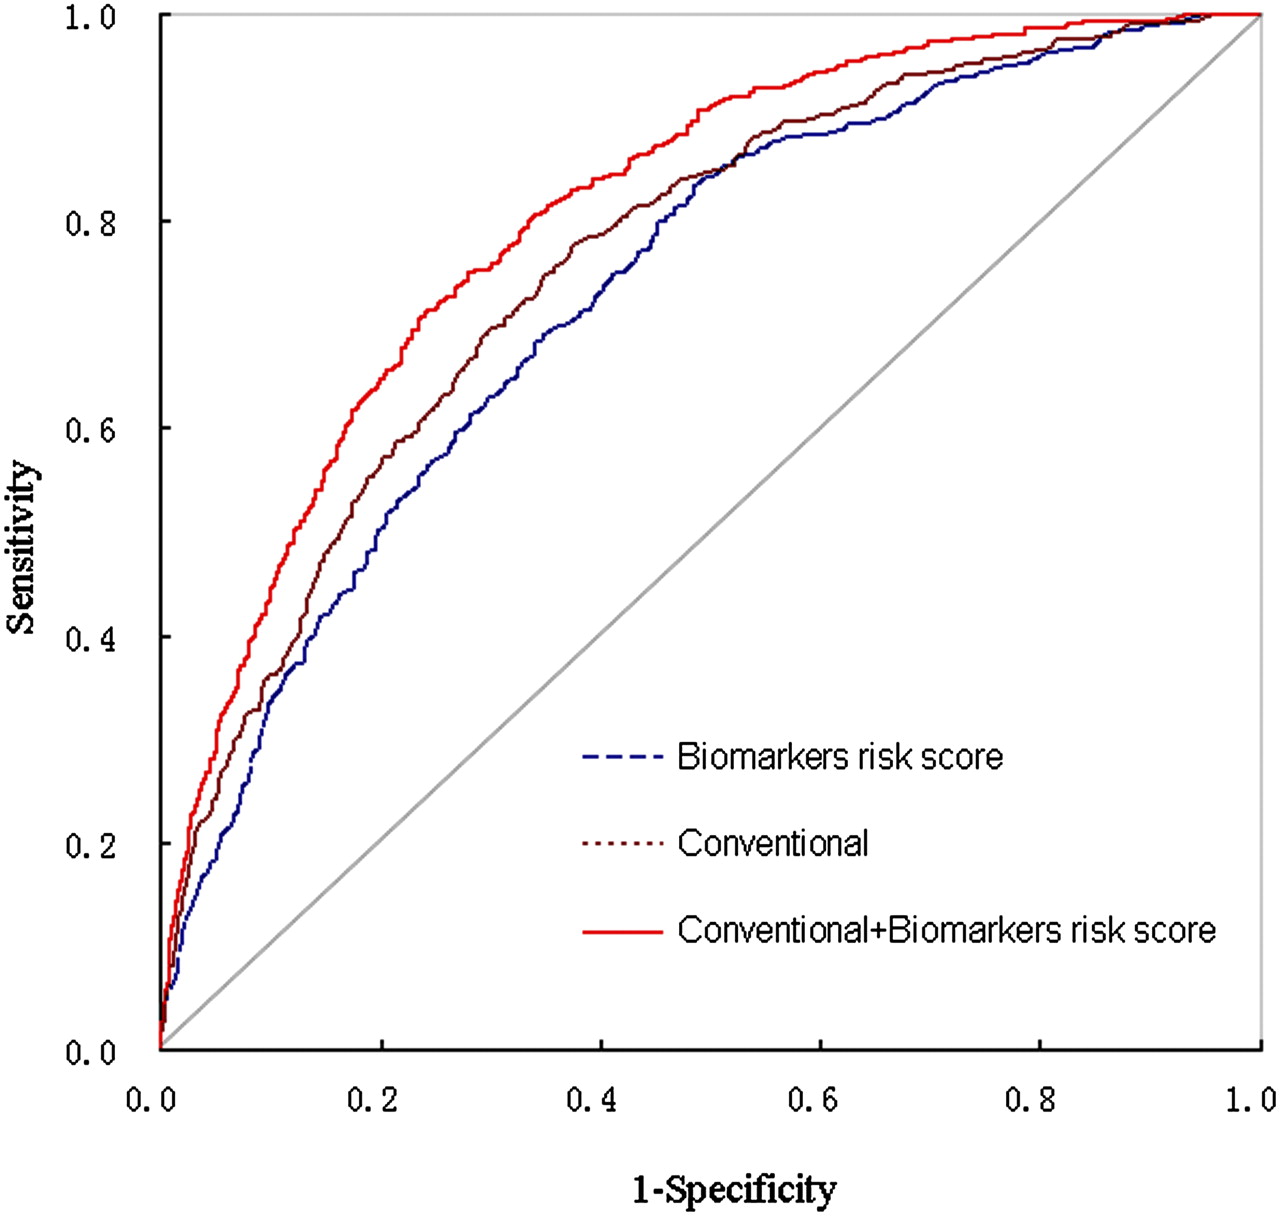
To explore the discriminatory ability of BRS, receiver operator characteristic curve analyses were performed (figure 3). The AUCs were 0.64, 0.64, 0.60 and 0.67 for adiponectin, PAI-1, IL-6 and ferritin, respectively. The AUCs were 0.73 (95% CI 0.71 to 0.76) for the BRS and 0.76 (95% CI 0.74 to 0.78) for conventional risk factors, including age, sex, region, residence, smoking, alcohol use, physical activity, family history of diabetes and BMI. Adding BRS to conventional risk factors significantly improved the AUC to 0.81 (95% CI 0.79 to 0.84; p<0.0001). Excluding the participants with previous diagnosis of diabetes did not appropriately change the identifying ability of BRS, with an increase of AUC from 0.74 (95% CI 0.71 to 0.78) to 0.82 (95% CI 0.80 to 0.85; p<0.0001) after combining the BRS with conventional risk factors. On the other hand, adding the BRS into the model significantly improved the IDI (IDI=0.0669, p<0.0001). The NRI was estimated at 25.7% (p<0.0001), resulting from a total of 16.7% of cases classified upwards and a total of 9.0% of no cases classified downwards (table 3). If the cut off points <3%, 3%–8%, 8%–15% and >15% were used as in previous study,22 the NRI was increased to 33.1% (p<0.0001).

Receiver operating characteristic curves for discriminating type 2 diabetes. Graphs show curves for biomarkers risk score alone (area under curve (AUC)=0.73, 95% CI 0.71 to 0.76), for conventional risk factors including age, sex, region, residence, smoking, alcohol use, physical activity, family history of diabetes and body mass index (AUC=0.76, 95% CI 0.74 to 0.78) and for biomarkers incorporated into conventional ones (AUC=0.81, 95% CI 0.79 to 0.83).
Net reclassification improvement due to the biomarkers risk score
Discussion
In this study, we showed that a weighted BRS, summarising association of adiponectin, PAI-1, IL-6 and ferritin, was strongly associated with type 2 diabetes and IFG in a middle-aged and older Chinese population. The BRS substantially improved the discriminatory ability for type 2 diabetes beyond conventional risk factors.
Since lifestyle modification has been demonstrated to be effective in prevention of type 2 diabetes, several prediction models have been developed to detect high-risk individuals among apparently healthy people for early intervention. However, most of the previous scoring systems for early screening of type 2 diabetes were based on the risk factors related to demographic,4 6 lifestyle,4 6 7 anthropometric4–6 or genetic parameters.8 10 Additionally, most of these systems were derived from white populations. Until now no diabetes risk evaluation system has been developed for use in Asian populations, especially in Chinese people who have a lower than average BMI but a similar or even higher prevalence of diabetes than Western populations.23 In a cross-sectional sample of Taiwanese subjects, Lin et al compared the type 2 diabetes discriminatory power of 10 scoring systems such as QDScore, FINDRISC, ARIC and the Cambridge Risk Score derived from information obtained from questionnaire and physical examination without laboratory blood assays. It was found that all of these scores improved the ability to detect type 2 diabetes, with an AUC ranging from 0.67 to 0.74.24
In this middle-aged and older Chinese population, our data showed that a BRS based on the combined effect of adiponectin, PAI-1, IL-6 and ferritin, was closely associated with the prevalence of type 2 diabetes independently of conventional diabetes risk factors. The participants with a BRS>10 had about 10-fold increased risk of type 2 diabetes than those with BRS≤3.0. Both the BRS and conventional risk factors alone showed a reasonably good ability to distinguish individuals with type 2 diabetes, with AUCs of 0.73 and 0.76, respectively. More importantly, combining the BRS with conventional risk factors substantially enhanced the discriminatory ability for type 2 diabetes by increasing AUC to 0.81. Moreover, adding BRS into the model significantly improved the IDI and NRI. Similarly, in FINRISK97 cohort study, a score calculated as a linear combination of adiponectin, apolipoprotein B, CRP and ferritin was showed to improve the net reclassification and discrimination of diabetes risk in addition to the traditional risk factors.22 Taken together, these findings emphasise that combining multiple circulating biomarkers might provide an additional objective tool in estimating the diabetes risk beyond the conventional risk assessments in clinical practice. These results might lead to use of these biomarkers in practice to assess diabetes risk, and benefit those individuals at high risk by allowing early preventive intervention. Nevertheless, more studies especially prospective studies are needed to verify these findings.
Unlike previous studies,12 which emphasised individual biomarkers, we performed a combined analysis of multiple biomarkers related to different pathogenesis pathways of type 2 diabetes. A number of biomarkers secreted by adipose tissue or liver play important roles in the aetiology of type 2 diabetes via pathways which may not be greatly overlapping.11 For instance, adiponectin is known to be an anti-inflammatory cytokine. However, a strong association between high circulating adiponectin levels and a lower risk of type 2 diabetes was found even after adjustment for inflammatory markers.25 Indeed, adiponectin could also enhance lipid clearance, and stimulate insulin secretion.26 The link between IL-6 levels and type 2 diabetes incidence in several prospective studies, however, was mainly through an inflammatory reaction that might modify glucose and lipid metabolism.27–29 On the other hand, elevated PAI-1 concentration, a marker of endothelial dysfunction, was also an independent predictor of incident diabetes.30 31 As an indicator of iron overload, which might result in β-cell oxidative stress, high circulating ferritin was established as a risk factor for type 2 diabetes.32 33
Consistent with previous studies,23–31 plasma adiponectin, PAI-1, IL-6 and ferritin in our study were independently associated with the risk of diabetes. As each of these biomarkers may involve one or more specific pathways in the link with type 2 diabetes, it was not surprising to find a low value of the AUC for each separate biomarker in discriminating diabetes individuals. However, adding any one of these biomarkers to the conventional factors significantly improved the power of discriminating the participants with and without type 2 diabetes. Moreover, each of these biomarkers contributed independently and additively to risk assessment, and with the combined information of these biomarkers, the BRS appeared to provide much stronger discriminative power. In addition, with the advance of biomarker measurement technology, we can simultaneously assess multiple biomarkers with one blood sample; for example, adiponectin, resistin and PAI-1 were measured simultaneously in our study. Thus, the cost of testing these biomarkers has been reduced, which makes it feasible to measure multiple biomarkers in primary care or large populations in the future. On the other hand, if we could prevent a person at high risk from developing clinically overt diabetes by early detection and intervention, the overall healthcare cost would be significantly reduced. Therefore, joint analysis for multiple potential predictors might be a potentially useful method for diabetes screening.
As far as we know, this is the first study to assess simultaneously the discriminatory ability of multiple biomarkers together with conventional risk factors for type 2 diabetes in a large population-based sample from the north and south of China. However, our study has some limitations. First, The cross-sectional nature of the study meant that we could not determine the extent to which diabetes incidence would be predicted by the BRS. Second, fasting glucose was measured only once. The oral glucose tolerance test, which is time-consuming and labour intensive, was not performed in such a large population sample size. However, HbA1c, which reflects long-term glycaemic control, was evaluated in the whole population. Another limitation is that we could not include more biomarkers involved in the pathophysiology of type 2 diabetes owing to limited blood samples. However, we have captured the well-established biomarkers in the major pathways related to insulin sensitivity, inflammation, endothelial function and oxidative stress.
In summary, a BRS derived from four circulating biomarkers, is strongly associated with the risk of type 2 diabetes. Combining the BRS and conventional risk factors substantially enhanced the discriminatory ability for the disease in middle-aged and older Chinese population. Whether the BRS could be used as an effective screening tool for diabetes needs to be verified in future studies.
Acknowledgments
We are grateful to all participants of the Nutrition and Health of Aging Population in China. We also thank Drs Xinghuo Pang, Zhen Zhang, Shufang Jiao, Hong Liu, Shurong Zou, and all other researchers and the healthcare professionals from the Centers for Disease Control and Prevention in Beijing and in Shanghai for taking part in the fieldwork of this study. Thanks also to Xingwang Ye, Lihua Chen, An Pan, Ying Wu, Jing Wang, Liang Sun, Ling Lu, Chen Liu, Shaojie Ma, and He Zheng and Qianlu Jin in our research group for their kind help at various stages of this study.
References
Footnotes
To cite: Wu H, Yu Z, Qi Q, et al. Joint analysis of multiple biomarkers for identifying type 2 diabetes in middle-aged and older Chinese: a cross-sectional study. BMJ Open 2011;1:e000191. doi:10.1136/bmjopen-2011-000191
Funding This study was financially supported by the Chief Scientist Program of Shanghai Institutes for Biological Sciences, Chinese Academy of Sciences (SIBS2008006), the Ministry of Science and Technology of China (973 program 2011CB504002). The funders had no role in study design, data collection and analysis, decision to publish, or preparation of the manuscript.
Competing interests None.
Patient consent Obtained.
Ethics approval This study was approved by the institutional review board of the Institute for Nutritional Sciences.
Contributors The authors' responsibilities were as follows: HW: study design, data collection and analysis, manuscript production; ZY, XL: study design and editing of the manuscript. QQ, HL, QS: study conception and design, data collection and analysis, and discussing and editing of the manuscript. All authors were responsible for critical revisions and final approval of the manuscript.
Provenance and peer review Not commissioned; externally peer reviewed.
Data sharing statement No additional data available.