Article Text

Abstract
Background In the past, strains of Staphylococcus aureus have evolved, expanded, made a marked clinical impact and then disappeared over several years. Faced with rising meticillin-resistant S aureus (MRSA) rates, UK government-supported infection control interventions were rolled out in Oxford Radcliffe Hospitals NHS Trust from 2006 onwards.
Methods Using an electronic Database, the authors identified isolation of MRS among 611 434 hospital inpatients admitted to acute hospitals in Oxford, UK, 1 April 1998 to 30 June 2010. Isolation rates were modelled using segmented negative binomial regression for three groups of isolates: from blood cultures, from samples suggesting invasion (eg, cerebrospinal fluid, joint fluid, pus samples) and from surface swabs (eg, from wounds).
Findings MRSA isolation rates rose rapidly from 1998 to the end of 2003 (annual increase from blood cultures 23%, 95% CI 16% to 30%), and then declined. The decline accelerated from mid-2006 onwards (annual decrease post-2006 38% from blood cultures, 95% CI 29% to 45%, p=0.003 vs previous decline). Rates of meticillin-sensitive S aureus changed little by comparison, with no evidence for declines 2006 onward (p=0.40); by 2010, sensitive S aureus was far more common than MRSA (blood cultures: 2.9 vs 0.25; invasive samples 14.7 vs 2.0 per 10 000 bedstays). Interestingly, trends in isolation of erythromycin-sensitive and resistant MRSA differed. Erythromycin-sensitive strains rose significantly faster (eg, from blood cultures p=0.002), and declined significantly more slowly (p=0.002), than erythromycin-resistant strains (global p<0.0001). Bacterial typing suggests this reflects differential spread of two major UK MRSA strains (ST22/36), ST36 having declined markedly 2006–2010, with ST22 becoming the dominant MRSA strain.
Conclusions MRSA isolation rates were falling before recent intensification of infection-control measures. This, together with strain-specific changes in MRSA isolation, strongly suggests that incompletely understood biological factors are responsible for the much recent variation in MRSA isolation. A major, mainly meticillin-sensitive, S aureus burden remains.
- Microbiology
- bacteriology
- microbiology
- epidemiology
- genetics
- infectious diseases
- health informatics
- information management
- information technology
- worldwide web technology
This is an open-access article distributed under the terms of the Creative Commons Attribution Non-commercial License, which permits use, distribution, and reproduction in any medium, provided the original work is properly cited, the use is non commercial and is otherwise in compliance with the license. See: http://creativecommons.org/licenses/by-nc/2.0/ and http://creativecommons.org/licenses/by-nc/2.0/legalcode.
Statistics from Altmetric.com
- Microbiology
- bacteriology
- microbiology
- epidemiology
- genetics
- infectious diseases
- health informatics
- information management
- information technology
- worldwide web technology
Article summary
Article focus
Multiple infection control interventions in UK hospitals were rolled out in 2005–2010.
Over the same time period, a decline in MRSA isolations has been noted. The relationship between these two events is unclear and was investigated using an observational study in a group of hospitals.
Key messages
MRSA isolation rates from blood culture, surface swabs and samples suggesting invasive disease declined from 2003 onwards, compatible with national trends.
Rates of meticillin-sensitive S aureus changed little by comparison. Analysis of resistance profiles, together with genotyping of archival collections, suggests a differential decline in the two dominant MRSA strains, ST22 and ST36.
MRSA isolation rates were falling before recent intensification of infection-control measures.
This, together with strain-specific changes in MRSA isolation, strongly suggests that incompletely understood biological factors are responsible for the much recent variation in MRSA isolation.
A major, mainly meticillin-sensitive, S aureus burden remains.
Strengths and limitations of this study
A large hospital with trends in MRSA blood culture isolation similar to the national trends was studied, and data are available not only for blood cultures but also for all other samples.
Archival collections of samples and detailed epidemiological and typing data are all available.
The data are observational.
Introduction
Staphylococcus aureus has a huge impact in healthcare.1 2 It is a clonal organism: much disease is caused by a small number of groups of highly successful, very closely related organisms; such groups are termed clonal complexes3 and vary in their virulence and disease manifestations.4 5
When and how new successful S aureus clones arise is an incompletely understood process which has repeatedly had a major clinical impact. An early example of a successful and virulent meticillin-sensitive clone of sequence-type 30 (ST30) caused serious wound infections and drove initial infection-control investment in the 1950s; the epidemic ended some years later.6 Subsequently meticillin-resistant S aureus (MRSA) clones emerged, expanded and then declined for unknown reasons,7 sometimes being replaced by different MRSA strains.5 In the UK, a national epidemic of two successful clones, designated EMRSA 15 and 16 (ST22 and ST36, respectively) has been responsible for over 95% of cases from the mid-1990s8; by 2006, MRSA was responsible for 15% of all hospital-associated infections and affected about 1.3% of UK inpatients.9
As infection rates, patient concern and costs all rose,10 MRSA control, and the wider field of infection control, became a major focus of the UK government. Multiple initiatives were centrally planned and locally delivered, with implementation centrally monitored via process-based reporting systems across England, as specified in the Health Act 2006 legislation. The impact on disease was assessed via a mandatory MRSA-bacteraemia-reporting scheme.10 Initiatives focused both on management structures prioritising infection control in high-level decision-making and on patient-level interventions: examples included the Winning Ways guidance document (2003),11 the Clean Your Hands Campaign (2004),12 the Saving Lives programme,13 Public Service Agreements which from 2004 onward contained a commitment to halve MRSA bacteraemia,10 the Health Act 2006,10 and a revised Saving Lives Campaign (2007) featuring ‘high impact interventions' including mandatory use of improved line insertion processes and pre- and perioperative management.13 Finally, MRSA screening of elective admissions was introduced from April 2009 across the UK NHS, to be extended to all admissions by 2010.13
Mandatory reporting has shown a steep decline in MRSA isolations from blood cultures across England from 2005 onwards. Meeting UK government targets for MRSA bacteraemia declines has been hailed as a triumph for a ‘zero tolerance approach’ supported by a well-resourced, centrally mandated, coordinated infection control initiative.10 However, similar declines in meticillin-sensitive S aureus (MSSA) bacteraemia have not been seen, although many interventions would be expected to impact all S aureus infections. Additionally, while multicentre quality-improvement studies with contemporaneous controls have documented declining MRSA rates, attribution of the decline to interventions proved difficult.14 It is possible, therefore, that (as occurred in the past)7 some changes in S aureus incidence may have occurred independently of intervention. In view of this, we carefully examined rates of MRSA and MSSA isolation over 12 years in our NHS trust acute hospitals, in relation to the introduction of the different infection-control interventions.
Methods
This study was a prespecified approved analysis project within the Infections in Oxfordshire Research Database, an anonymised linked electronic database including microbiology and patient data from Oxfordshire, approved by the Oxford Research Ethics Committee and the National Information Governance Board. We included admissions to all acute Oxford hospitals in the Oxford Radcliffe Hospital NHS Trust (John Radcliffe, Churchill, Radcliffe Infirmary) and specimens from these inpatients submitted for testing between 1 April 1998 and 30 June 2010 (total 611 434 inpatients). We did not include specimens or admissions from the Nuffield Orthopaedic Centre (NOC) NHS Trust, a small unit focusing mainly on elective bone and joint surgery, the Horton General Hospital (a district hospital near Banbury, north Oxfordshire) or any other mental-health NHS Trusts or private hospitals. To allow for variation in specific times recorded on the underlying data sources, following previous analyses a patient was considered to be ‘within hospital’ when the date of specimen collection was between 24 h before the time of hospital admission on the Patient Administration System and 24 h after the stated discharge time.15 Haemodialysis and chemotherapy sessions were considered as ‘within hospital’. Defined in this way, the patient population covered by Oxfordshire Research Database remained constant over the study period.
We considered clinical specimens taken for microbiological testing in three exclusive categories:
blood cultures;
cultures from other samples suggestive of invasive disease (such as abscesses, peritoneal, pleural or joint fluid, cerebrospinal fluid, bronchoalveolar lavage samples);
surface cultures (defined by laboratory standard operating procedures as locations not expected to be sterile, such as wounds).
Discrimination between (2) and (3) was made by biomedical scientists on specimen receipt in the laboratory based on clinical details provided. We did not include MRSA-screening samples, only samples sent because of clinically suspected infection. Microbiological processing was performed in the Oxford Radcliffe Hospitals microbiology laboratory, which is approved by Clinical Pathology Accreditation. Processing was essentially as recommended by the Health Protection Agency standard methods.16 Macrolide sensitivity testing was performed using a standardised comparative disc diffusion method throughout the entire study period. Within specific research studies, multilocus sequence typing was performed as described.17 When multiple isolations occurred from the same kind of specimen (eg, blood culture) within 14 days, we considered this to represent one isolation, a deduplication policy used by national mandatory MRSA surveillance.10 We used overnight stays (termed the KH03 statistic), a measure recommended by the UK government,10 as denominators for isolations of MRSA and MSSA.
Bias
Our study design is observational, based on specimens taken for clinical indications. Changes in clinical practice in defined clinical areas are therefore of potential concern. Our main approach to reducing the influence of bias was to look for consistency in findings across multiple sample groups. Further, to identify whether reductions in rates in particular could be a consequence of reduced sampling, we also estimated rates of clinical specimen taking (using the same 14-day deduplication) across the study period.
Statistical methods
We modelled quarterly counts of MRSA and MSSA from patients admitted to the ORH NHS Trust using negative binomial regression models with quarterly denominator counts as an offset, estimated using maximum likelihood with the R 2.11 glm.nb function. Contrast estimates used estimable (R gmodels package). We identified change points for trends in MRSA and MSSA isolation from each type of specimen from visual inspection of fitted natural cubic splines with three knots (at the 10th, 50th and 90th percentiles),18 and from comparisons of Akaike Information Criterion from grid search across all possible one and two joinpoint models, considering joinpoints every quarter from September 1998 to September 2009. As isolation from blood cultures was our primary outcome (following the mandatory surveillance scheme) we defined calendar periods according to changes in MRSA bacteraemia, and then compared trends in MRSA and MSSA in these same periods using stacked regression with robust variance adjustment.
Rates were also calculated according to whether the MRSA strain was resistant or sensitive to erythromycin. We estimated rates of ST22 and ST36 MRSA assuming that (see Results) (1) all MRSA strains were represented by ST22 and ST36 only; (2) all erythromycin-sensitive MRSA strains were ST22; and (3) ST22 consisted of similar proportions of erythromycin-sensitive and -resistant MRSA strains. Sensitivity analyses replaced (4) with the upper and lower 95% confidence limits for the estimated proportions of erythromycin-sensitive and -resistant ST22.
Results
Participants and outcomes
Between April 1998 and June 2010, 611 434 individuals were admitted to ORH a total of 1 971 482 times; there were 3 681 791 overnight bedstays and 354 952 emergency admissions. After deduplication, there were a total of 44 541 S aureus isolations from blood, other invasive or surface samples; 29 122 MSSA isolations from 11 272 individuals, and 15 419 MRSA isolations from 4903 individuals. Both MRSA and MSSA were isolated from 852 individuals at some point during the 12-year period. There were more men with both MSSA and MRSA. The age distribution was typical of that described nationally,10 and as previously described,19 about 10% of S aureus isolations were from blood (table 1).
Characteristics of Staphylococcus aureus cases
Expansion and decline phases of the MRSA epidemic
Figure 1 shows that in blood cultures, other invasive samples, and surface swabs obtained from hospital inpatients over 12 years the MRSA epidemic expanded, remained static and then declined. Segmented regression modelling suggested inflections at two points: the first occurred at some time before April 2004, with the most likely change from expansion to decline in blood cultures isolation occurring in October 2003. Spline-based curve-fitting yielded similar conclusions (not shown). The decline in isolation from surface cultures may have started slightly earlier (figure 1). There was also statistical evidence for a steepening of the decline from July 2006 onwards (p=0.003, 0.007 and <0.0001 for blood, other invasive and surface samples respectively). In subsequent analyses, in order to compare isolations from different groups of samples over the same periods of time, we defined three calendar periods according to the optimal change points for MRSA bacteraemia (figure 1). For example, other invasive MRSA incidence rate ratios (IRRs) per annum were 1.13 (ie, a 13% increase per annum, 95% CI 1.09 to 1.18) in the first (expansion) phase to October 2003, 0.90 (95% CI 0.84 to 0.97), in the initial decline phase from October 2003 through July 2006, and 0.76 (0.71, 0.82) in the third (steeper decline) phase from July 2006 onward (latter two rates differ; p=0.007). Trends in isolations from surface samples and blood cultures were similar (figure 1B,D), with initial increases and post-2006 IRRs in blood cultures of 1.23 (1.16–1.30) and 0.62 (0.55–0.71), respectively.
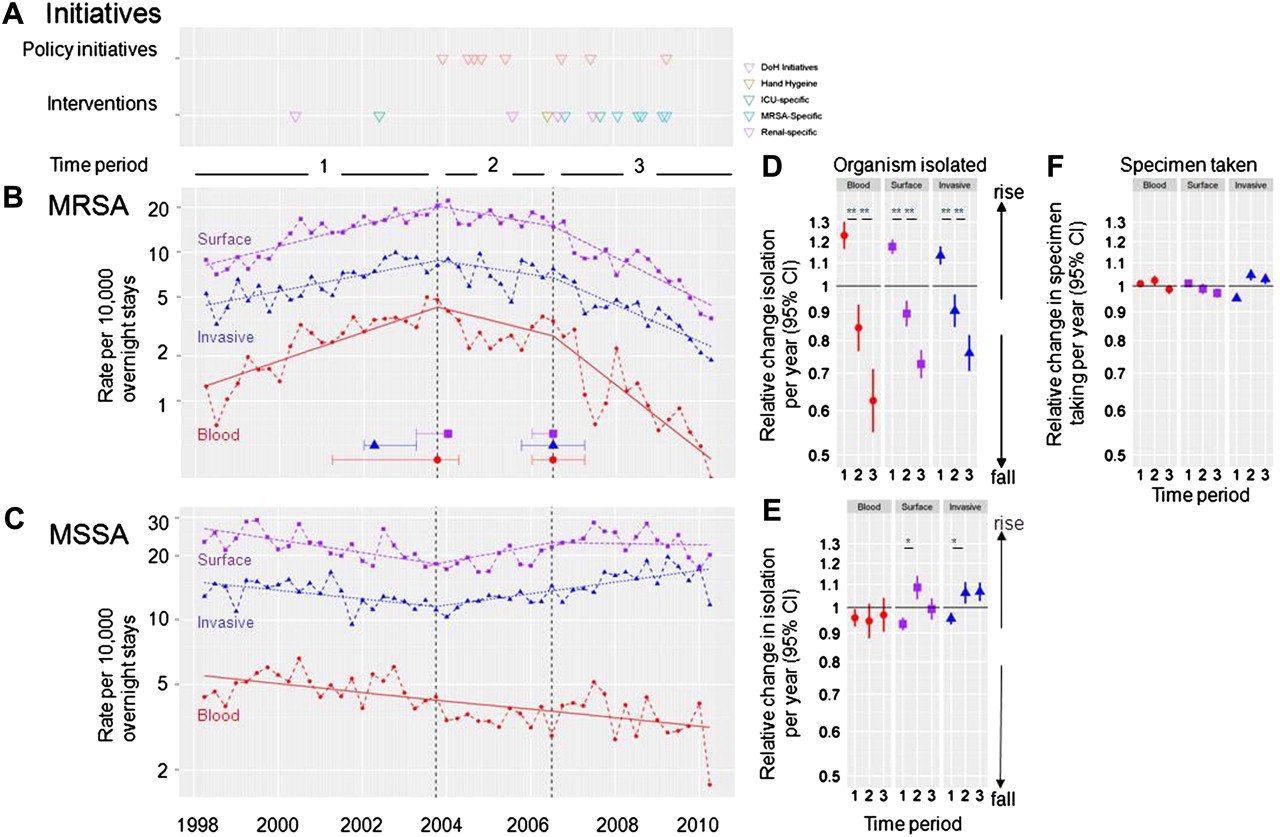
Isolation of meticillin-resistant Staphylococcus aureus (MRSA) and meticillin-sensitive Staphylococcus aureus (MSSA) over a 12-year period: (A) interventions and government initiatives over 12 years, along with rates of isolation of (B) MRSA and (C) MSSA in hospital. Points indicate quarterly rates: solid lines are trends in each time period from negative binomial regression. Denominators are the KH03 overnight bedstay statistic. In (B), the optimal change points for MRSA isolation from each group of isolates is shown (dots) along with the range of change points yielding similar model fits (difference in Akaike Information Criterion<3.84). These change points divide the 12-year period into three periods; rates of isolation in each of these periods are shown for (D) MRSA, (E) MSSA and rates of sampling in (F). Evidence for variation in trends in first versus second and second versus third periods respectively: MRSA blood <0.0001, 0.003; MRSA surface <0.0001, <0.0001; MRSA invasive <0.0001, 0.007; MSSA blood 0.79, 0.70; MSSA surface <0.0001, 0.04; MSSA invasive 0.001, 0.90 (*p<0.01 for the comparison shown).
Changing sampling rates
Over the 12 years, overall rates of collection of sampling changed little during the expansion, decline and rapid decline phases for the epidemic (figure 1F). Trends in invasive sample taking, in particular, were statistically significant at p<0.01 given large numbers, although trends in blood-culture taking were not. All sampling trends were small in magnitude (IRRs 0.95 to 1.05; 95% CI 0.94 to 1.07). Thus, changes in sampling rates were unlikely to explain the much larger changes in MRSA isolation rates observed.
Local interventions and change in MRSA isolation rates
At the start of the study period, the only S aureus specific control measure in place was risk-based MRSA screening, and mupirocin decontamination in renal patients. Use of antimicrobial impregnated central lines was initiated in 2002. A series of government policy documents were published in 2004 and 2005; apart from stopping mupirocin decontamination in renal patients in 2005, only in 2006 were multiple initiatives, including widespread use of alcohol hand gels, put into place in the study hospitals. Enhanced intravascular line specific interventions followed in 2007, and from late 2008 decontamination programmes were progressively implemented (table 2). Thus, the end of the MRSA ‘expansion phase’ occurred around the time of the first Department of Health initiative but preceded the local interventions mandated by this and subsequent investigations by more than 1 year; the steeper decline phase from 2006 began at the same time as the initial hospital-wide interventions.
Interventions against Staphylococcus aureus 1998–2010
Changes in meticillin-sensitive Staphylococcus aureus isolation
By 2010, MSSA isolation was far more common than MRSA (for blood cultures: 2.9 vs 0.25; for invasive samples 14.7 vs 2.0 per 10 000 bedstays, figure 1). We analysed MSSA in the same three time periods identified for the MRSA epidemic, for the purposes of comparison. By contrast with the changes seen in MRSA isolation, changes seen in MSSA were modest (figure 1C,E). For example, during the steep decline phase of MRSA, MSSA isolation from blood cultures did not change significantly in the hospital overall (IRR 0.97, 95% CI 0.90 to 1.04). Indeed, small increases in MSSA isolation from invasive samples were seen in the later years of the study (figure 1C,E; IRR 1.07, 95% CI 1.03 to 1.11), although this may be in part due to enhanced sampling. Since multiple interventions (including use of alcohol gels and enhanced intravascular line precautions) might be expected to decrease both MRSA and MSSA rates (table 2), these results were surprising.
Decline in MRSA isolation is strain-specific
Another unanticipated observation came from routine surveillance of antimicrobial resistance patterns, with significant changes in the proportion of MRSA strains reported as erythromycin-resistant; figure 2A shows the results for blood cultures. Although both erythromycin-sensitive and -resistant MRSA increased from 1998 to 2003, the increases were greater for erythromycin-sensitive (IRR 1.45, 95% CI 1.26 to 1.66) than for -resistant MRSA (IRR 1.19, 95% CI 1.12 to 1.27) (p=0.002). During the rapid decline phase, the opposite trend was observed (figure 2A,B, p=0.002 for difference in trend between erythromycin-resistant and -sensitive isolates). Trends in invasive and surface isolates were similar (figure 3).
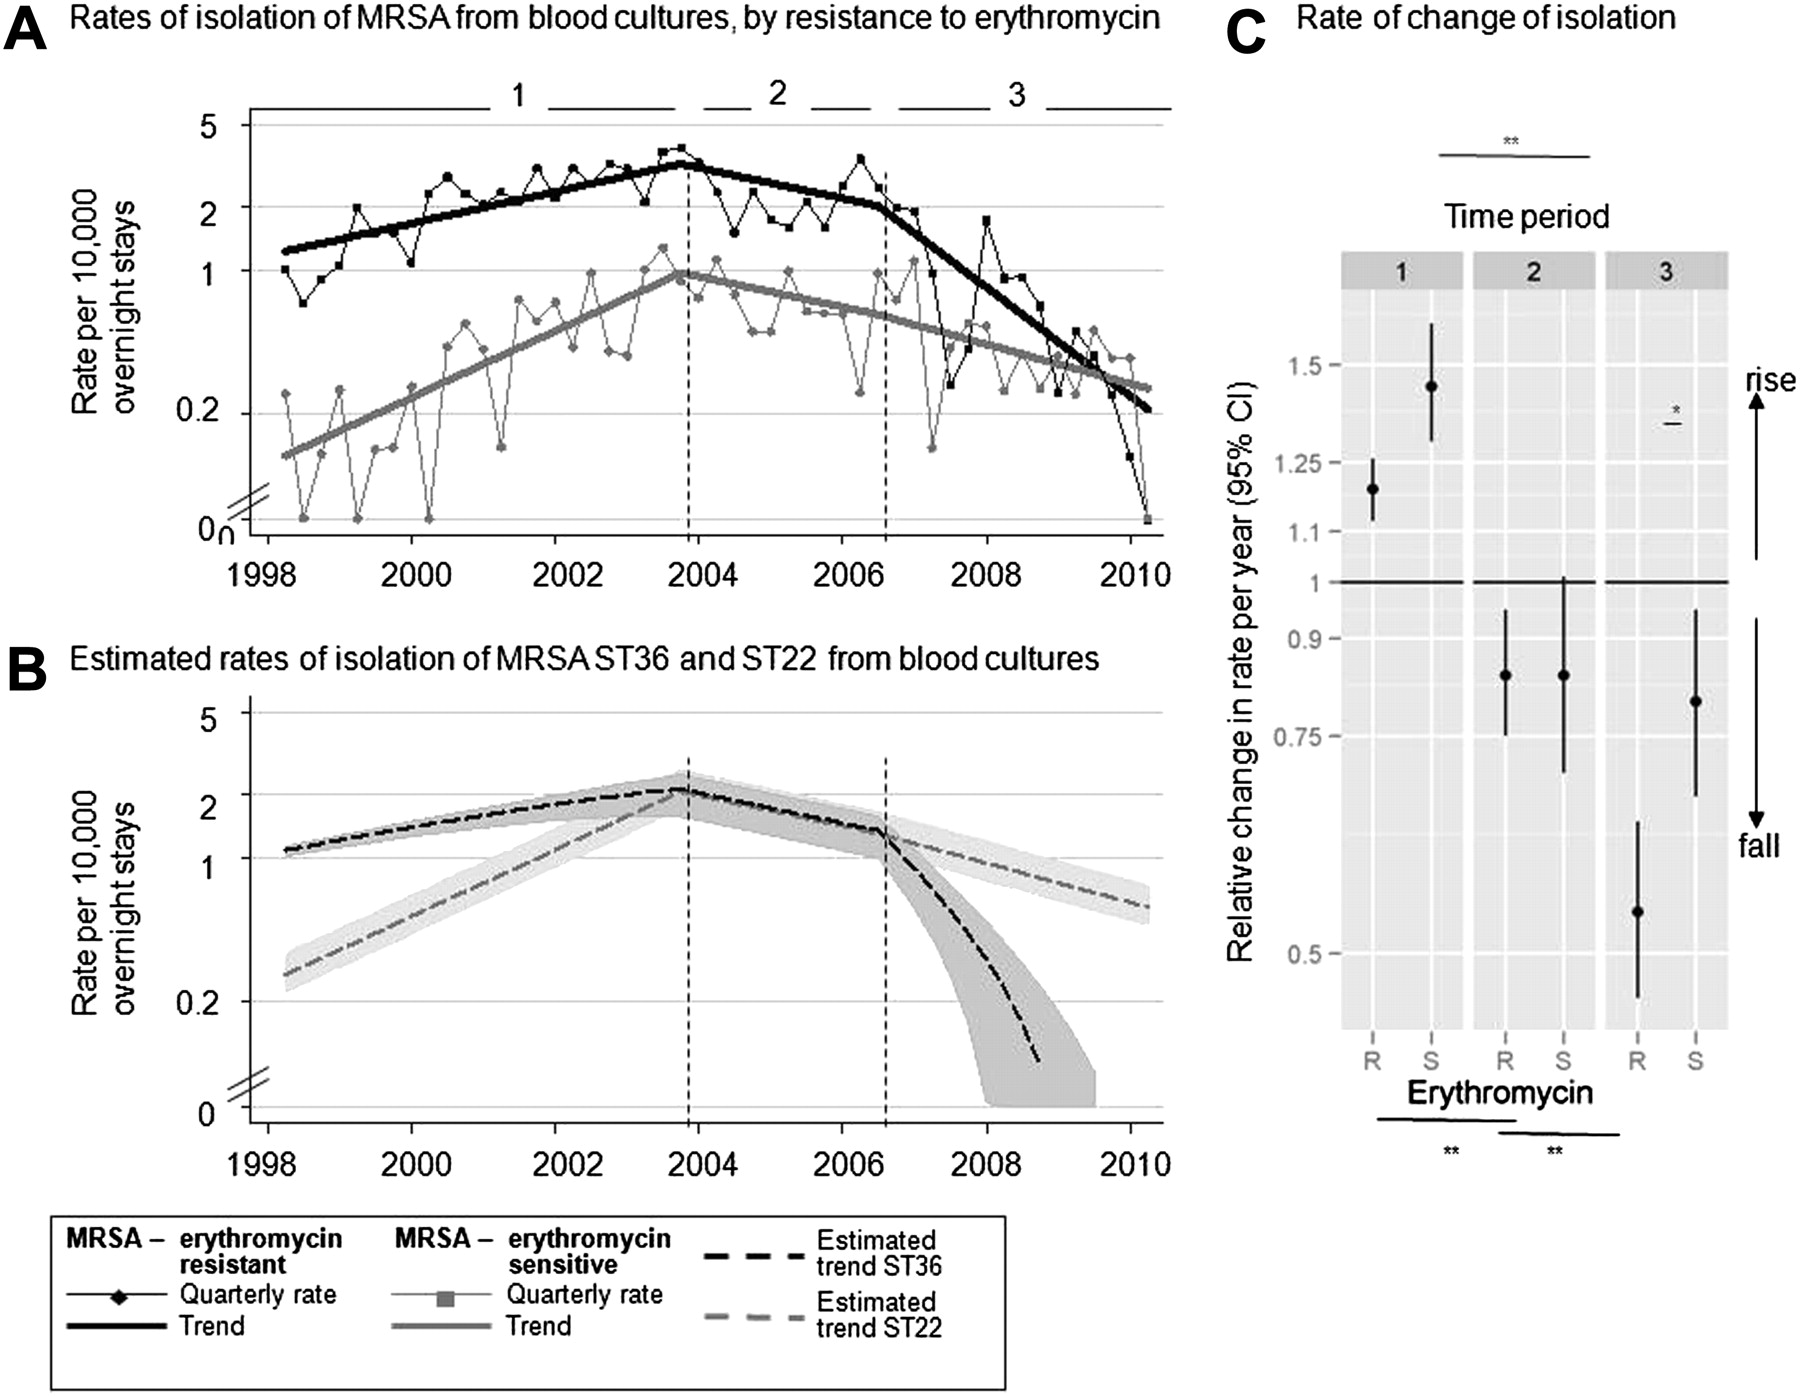
Rates of isolation of erythromycin-sensitive and meticillin-resistant Staphylococcus aureus (MRSA) in blood cultures (panel A). Points indicate quarterly rates of isolation of erythromycin-resistant and -sensitive MRSA: solid lines are trends in each period from negative binomial regression. Denominators are hospital KH03 overnight bed-stay statistics. Broken lines are estimated rates of isolation of MRSA ST22 and ST36 (see Results for assumptions). In (B), shaded areas show upper and lower estimates of ST22/36 rates based on the 95% CI around the proportion of ST22 isolates which are erythromycin-sensitive. Panel C shows relative change in each time period. Evidence for variation in trends in first versus second and second versus third periods respectively: erythromycin-resistant <0.0001, 0.001; erythromycin-sensitive <0.0001, 0.78 (*p<0.01 for the comparison shown). Evidence for variation between erythromycin-resistant versus sensitive in the first period p=0.002; second period p=1.00; third period p=0.002.

Rates of isolation of erythromycin-sensitive and resistant meticillin-resistant Staphylococcus aureus (MRSA) in (A) blood, (B) invasive, and (C) surface specimens. Points indicate quarterly rates of isolation of erythromycin-resistant and -sensitive MRSA: solid lines are trends in each period from negative binomial regression. Denominators are hospital KH03 overnight bed-stay statistics. Broken lines are estimated rates of isolation of MRSA ST22 and ST36 (see Results for assumptions). Comparison is made between macrolide-sensitive and -resistant isolation and estimated trends in ST22 and ST36 are shown in each panel.
Since it is known that two clones of MRSA, ST22 and ST36 have dominated the UK's MRSA epidemic,8 we considered whether these changes might reflect differential clonal expansion in MRSA. To do this, we estimated rates of ST22 and ST36 MRSA by comparing multilocus sequence types of two archival collections of nosocomial bacteraemia Oxford MRSA strains17 20 with erythromycin sensitivities from 1999 to 2007. As expected from national data,8 all but five of the 138 samples (4%, 1/29 (3%) in 1999, 4/114 (4%) in 2007) were ST22 or ST36: we therefore assumed that all MRSA strains were represented by ST22 and ST36 only. Only 1/51 erythromycin-sensitive samples was ST36 (1/5 in 1999, 0/46 in 2007; two and one being non-ST22/36 respectively): we therefore assumed all erythromycin-sensitive strains were ST22. Fifty-four of 101 (53%; 95% CI 43% to 63%) of ST22 were erythromycin-resistant (1/4 (25%) in 1999, 53/97 (55%) in 2007): we therefore assumed that 53% and 47% of ST22 were erythomycin-resistant and -sensitive respectively, with sensitivity analyses based on the 95% CI limits. With these assumptions, although estimated isolation of both ST22 and ST36 from blood cultures declined from 2006 onwards, declines in blood cultures were greater in ST36 than in ST22 (figure 2), with the steeper rate in 2006 appearing to be ST36-specific. Compatible with the pattern observed in blood, declines appeared largely restricted to ST36 (based on the relationships derived from analysis of blood-culture collections) in isolations from invasive samples and surface swabs (data not shown).
Discussion
The MRSA epidemic in acute Oxfordshire hospitals had three phases characterised by expansion, decline and rapid decline in isolations from blood cultures, invasive and surface sites. The transition from expansion to initial decline occurred significantly before the major anti-MRSA initiatives were deployed in these hospitals. More rapid declines occurred after the interventions but appeared to be driven by declines in erythromycin-resistant MRSA, estimated to be predominantly ST36. Throughout this period, isolations of meticillin-sensitive S aureus did not decline substantially; observed small increases in sensitive S. aureus from some sample types suggestive of invasive infection may reflect nationally reported trends.21 Importantly, a large body of disease remains across all specimen types, with rates of meticillin-sensitive S aureus isolation now about 10 times higher than those of MRSA.
The rise and fall of dominant MRSA clones appear very similar to the large, but unexplained, waves in isolation rate seen previously with other MRSA clones5 6, the ST22 wave following the ST36 wave. Indeed, such displacement has been noted with MRSA ST36 elsewhere in Europe22 and is suggested by a study of MRSA collected from multiple UK hospitals between 2001 and 2007.8
The study has several limitations. First, it is restricted to acute NHS hospitals in one city. However, the overall trends in isolations in both MRSA and MSSA observed are similar to those seen for bacteraemias in many other UK hospitals,10 21 23 although this detailed study allows us to look beyond blood cultures. Second, our estimates of incidence of MRSA strains rely on extrapolation from antibiotic sensitivity results. Reassuringly, differential macrolide resistance in ST22 and ST36 has been found previously elsewhere,8 and sensitivity analyses varying the relationship between susceptibility and strain were similar to the primary analysis. Further, although antibiotic resistance can develop within a strain,3 this is a rare occurrence and results in increased, not decreased, resistance.
During the study period, there was aggressive implementation of programmes expected to reduce S aureus disease irrespective of strain type and meticillin resistance, such as the enhanced infection-control profile in the Health Act 2006, widespread use of alcohol hand gels and alcoholic chlorhexidine, and focus on ‘high value interventions’ such as central and peripheral line insertion care bundles.13 It is concerning that an impact on both sensitive and resistant S aureus strains was not observed, although national24 and local audit suggested improvements and reasonably high compliance (80–90%) with all these interventions. In further work, we plan to investigate their impact in the defined, high-risk settings where they were most heavily used, aiming to estimate effects controlling for the observed waves in MRSA isolation rate.
We conclude that alterations in MRSA isolation rates are likely to have been influenced by biological factors which are incompletely understood; as with previous MRSA epidemics,5 6 at least part of the decline in the UK's nosocomial MRSA outbreak is probably spontaneous. Biologically driven changes in bacterial strains and their behaviour are well known, being documented before in Staphylococcus pyogenes,25 Streptococcus pneumonia26 Neisseria meningitidis27 as well as S aureus5 6; immune selection may mediate some of these changes.28
Given the absence of effect of the interventions on MSSA, the decline in MRSA prior to interventions, the strain specificity of the effect on MRSA and the difficulty of demonstrating the effect of an intervention package on MRSA isolation,14 we find it difficult to estimate how much, if any, of the observed decline in MRSA isolations is attributable to recent infection-control measures. Some components of the infection control package implemented are supported by trial evidence,29 but many are not.
Consequently, we suggest that the cost-effectiveness of high-cost MRSA-specific control measures, such as universal MRSA screening,13 should be re-examined, given assumptions of declining baseline prevalence. They should be costed relative to programmes with a robust evidence base,29 reducing intravascular catheter or surgical site S aureus disease. This and other recent studies2 imply that a greater emphasis on S aureus disease, irrespective of resistance profile, is required. A positive recent development in this area is the Department of Health's decision to institute mandatory surveillance of all S aureus bloodstream isolations.30
References
Footnotes
To cite: Wyllie DH, Walker AS, Miller R, et al. Decline of meticillin-resistant Staphylococcus aureus in Oxfordshire hospitals is strain-specific and preceded infection-control intensification. BMJ Open 2011;1:e000160. doi:10.1136/bmjopen-2011-000160
Funding This article presents independent research commissioned by the National Institute for Health Research (NIHR) under its Oxford Biomedical Research Centre Infection Theme, and the Program Development Grants funding scheme (RP-DG-1108-10125). The views expressed in this publication are those of the author(s) and not necessarily those of the NHS, the NIHR or the Department of Health.
Competing interests None.
Ethical approval Ethics approval was provided by the Oxford Research Ethics Committee and by the National Information Governance Board.
Contributors DHW and ASW performed the analyses and wrote the paper. DHW is guarantor. SW and IS performed the analyses; CM and RM genotyped the S aureus strains; DHW and JF constructed the Infection in Oxfordshire Research Database; LOC provided details of infection-control interventions; all authors reviewed the manuscript and critically analysed the work.
Provenance and peer review Not commissioned; externally peer reviewed.
Data sharing statement No additional data available.