Article Text

Abstract
Introduction Ageing-related processes such as cellular senescence are believed to underlie the accumulation of diseases in time, causing (co)morbidity, including cancer, thromboembolism and stroke. Interfering with these processes may delay, stop or reverse morbidity. The aim of this study is to investigate the link between (co)morbidity and ageing by exploring biomarkers and molecular mechanisms of disease-triggered deterioration in patients with pancreatic ductal adenocarcinoma (PDAC) and (thromboembolic) ischaemic stroke (IS).
Methods and analysis We will recruit 50 patients with PDAC, 50 patients with (thromboembolic) IS and 50 controls at Rostock University Medical Center, Germany. We will gather routine blood data, clinical performance measurements and patient-reported outcomes at up to seven points in time, alongside in-depth transcriptomics and proteomics at two of the early time points. Aiming for clinically relevant biomarkers, the primary outcome is a composite of probable sarcopenia, clinical performance (described by ECOG Performance Status for patients with PDAC and the Modified Rankin Scale for patients with stroke) and quality of life. Further outcomes cover other aspects of morbidity such as cognitive decline and of comorbidity such as vascular or cancerous events. The data analysis is comprehensive in that it includes biostatistics and machine learning, both following standard role models and additional explorative approaches. Prognostic and predictive biomarkers for interventions addressing senescence may become available if the biomarkers that we find are specifically related to ageing/cellular senescence. Similarly, diagnostic biomarkers will be explored. Our findings will require validation in independent studies, and our dataset shall be useful to validate the findings of other studies. In some of the explorative analyses, we shall include insights from systems biology modelling as well as insights from preclinical animal models. We anticipate that our detailed study protocol and data analysis plan may also guide other biomarker exploration trials.
Ethics and dissemination The study was approved by the local ethics committee (Ethikkommission an der Medizinischen Fakultät der Universität Rostock, A2019-0174), registered at the German Clinical Trials Register (DRKS00021184), and results will be published following standard guidelines.
- health informatics
- immunology
- thromboembolism
- molecular aspects
- stroke
This is an open access article distributed in accordance with the Creative Commons Attribution Non Commercial (CC BY-NC 4.0) license, which permits others to distribute, remix, adapt, build upon this work non-commercially, and license their derivative works on different terms, provided the original work is properly cited, appropriate credit is given, any changes made indicated, and the use is non-commercial. See: http://creativecommons.org/licenses/by-nc/4.0/.
Statistics from Altmetric.com
Strengths and limitations of this study
In-depth measurements of both relevant outcomes and potential biomarkers.
Comparatively low number of participants, for both patients and controls.
In-depth and detailed data analysis plan.
Investigation of the deterioration of health and (co)morbidities, not just of survival.
Two comorbid diseases investigated in almost identical ways in two substudies.
Introduction
Pancreatic ductal adenocarcinoma (PDAC) and ischaemic stroke (IS) are two ageing-associated diseases for which cellular senescence is suspected to play a role regarding their (co)morbidity. In the following, we outline an observational study of these two diseases. We describe the prevalence and outcomes of PDAC and IS, the known predictors of these outcomes, and the specific prevalence of comorbidity as well as known predictors for this comorbidity. Moreover, we discuss the role of cellular senescence in ageing and disease (specifically, see box 1), and the background of the cancerous and vascular comorbidity (specifically, see box 2). We will see that, despite differences in disease pathology, dynamics and prognosis, there is a lot of evidence that cellular senescence is an important contributor to disease aetiology, progression and consequences for both diseases.
Ageing and cellular senescence
Extra lifetime gained over the last century led to the widespread emergence of age-related diseases that are rarely seen in younger people. Older patients are thus more likely to display several comorbidities, making treatment difficult and expensive. Over the last years, strong evidence has accumulated that the presence of senescent cells (ie, non-dividing but secretory, damaged and metabolically active cells that escape apoptosis) is causally involved in diseases such as atherosclerosis, cancer, fibrosis, pancreatitis, osteoarthritis, Alzheimer disease and metabolic disorders.97 98 Evidence that senescent cells are not only correlated with ageing and diseases, but are also causally involved, comes from recent studies, which transplanted senescent cells from old into young mice.99 This resulted in persistent functional impairment as well as spread of cellular senescence to host tissues. Another strong line of evidence comes from experiments that actually removed senescent cells from aged mice by senolytics.99–101 In each case an increase in lifespan and a delay of typical age related diseases was observed. Most recently, the results of human pilot trials of putative senolytic treatments in case of idiopathic pulmonary fibrosis and osteoarthritis have been reported. One team102 treated idiopathic pulmonary fibrosis patients with dasatinib and quercetin and demonstrated safety as well as notable improvements in some physical abilities. Furthermore, a human phase 1 study demonstrated that a senolytic compound, which was applied locally in patients with osteoarthritis of the knee, was safe and well tolerated.103 A clinically meaningful improvement in several measures, including pain, function, as well as modulation of certain senescence-associated secretory phenotype (SASP) factors and disease-related biomarkers was observed after a single dose.
Cellular senescence and the comorbidity of cancer and vascular events
Some cancers such as PDAC can trigger vascular events by hypercoagulation, reflecting Trousseau’s syndrome first reported 150 years ago.9 In turn, strong associations between coagulation, cellular senescence and the SASP were recently demonstrated.94 104 While cellular senescence can suppress PDAC and cancerous proliferation in general, it also triggers tumour progression by fostering inflammatory processes, including the SASP, while on the other hand, after ischaemic stroke, it attenuates recovery.105–109 For both diseases, causal influences can be traced back to molecular determinants: PAI-1 (also known as SERPINE1 and part of the SASP) is involved in cancer-triggered thromboembolism106 108 and stroke recovery in animals.110 Other proteins involved in cellular senescence, specifically inflammatory cytokines such as IL6, and the lesser known osteopontin and gelsolin, are also markers for both PDAC and stroke.111–114 The cyclin-dependent kinase CDK5115 is implicated in the progression of PDAC as well as in the recovery from stroke.109 116 Moreover, apart from being genetic risk factors,117 118 the most prominent drivers of cellular senescence (p16/CDKN2A and p21/CDKN1A) also promote PDAC progression81 and endothelial embolic and arteriosclerotic mechanisms of stroke.119 Finally, two small-molecule interventions into cellular senescence, fisetin and quercetin, are both potential therapeutic agents of PDAC and stroke. In case of stroke, the blood–brain barrier is passed by quercetin which improves stroke outcome.120 In case of PDAC, it was observed that quercetin inhibits pancreatic cancer growth in vitro and in vivo.121 Fisetin is found in various fruits (especially strawberries) and it is chemically similar to quercetin, with strong putative senolytic effects, extending lifespan of mice even when intervention with fisetin started only at an advanced age.122 In a study involving nude mice implanted with prostate cancer cells, treatment with fisetin significantly retarded tumour growth.86 Also, in case of lung cancer, there is evidence for the beneficial effects of fisetin. One study showed that fisetin provides protection against benzo(a)pyrene [B(a)P]-induced lung carcinogenesis in albino mice123 and another in vivo study demonstrated the synergistic effects of fisetin and cyclophosphamide in reducing the growth of lung carcinoma in mice.124 Several other studies have also demonstrated its anticarcinogenic, neurotrophic and anti-inflammatory effects that are beneficial in numerous diseases, including pancreatic cancer and stroke.125
PDAC, pancreatic ductal adenocarcinoma.
PDAC: prevalence and outcomes
The incidence of pancreatic cancer is increasing; in 2017, the global incidence was 5.7 per 100 000 person-years.1 Age is the most important risk factor, and incidence peaks at 65–69 years in males and 75–79 years in females.1 PDAC is the most common histological type of pancreatic cancer.2 The disease is characterised by late clinical presentation,3 early metastases and poor prognosis, with a 1-year survival rate in Europe of only 15%.4 Many patients have unresectable disease at the time of diagnosis, either as locally advanced disease or already with metastases. In these cases, therapy is palliative consisting of chemotherapy and/or best supportive care. Disease deterioration with weight loss and low muscle strength, that is, cachexia and sarcopenia,5 will follow, for some patients rapidly (within a few weeks) and for others during a longer interval of 1 or 2 years. Recent developments in oncology have not shown much benefit in clinical trials of patients with PDAC.6 Inflammation, desmoplasia and early metastases are deemed responsible for the difficulties in targeting the disease. Moreover, vascular events are frequently observed in the course of PDAC and may contribute to disease deterioration or early death. Venous thromboembolism is the most common event occurring in up to 34% of patients with metastatic PDAC,7 8 but arterial ischaemic events, like stroke, are also reported9–14 (see also box 2). Therefore, deterioration and mortality in PDAC can be explained not only by tumour progression but also with other factors like sarcopenia/cachexia and vascular events. Furthermore, we suggest that the underlying cause of all these factors are ageing-related processes such as cellular senescence and chronic inflammation.
PDAC: known biomarkers and clinical scores
In patients with PDAC, there is a lack of established scores describing the risk of disease deterioration and the risk of sarcopenia/cachexia in particular. Referring to the endpoint of overall survival, some recent studies tried to establish inflammation-based scores to better characterise outcome in PDAC. In a retrospective analysis of 386 patients with PDAC of different stages, CRP/Alb ratio, neutrophil–lymphocyte ratio (NLR), platelet–lymphocyte ratio and Modified Glasgow Prognostic Score (mGPS) were studied.15 In patients with locally advanced and metastatic disease, the CRP/Alb ratio was an independent factor of poor survival.15 Another retrospective study evaluating carbohydrate antigen 19-9 (CA19-9), carcinoembryonic antigen (CEA), C reactive protein (CRP), lactate dehydrogenase (LDH) and bilirubin levels in patients with locally advanced and metastatic pancreatic cancer treated with chemotherapy showed an independent prognostic significance for overall survival only for CA 19-9 decline during treatment.16 Other studies have evaluated the risk factors for thromboembolic events in patients with pancreatic cancer and more generally in patients with cancer17 (see also box 2). The ‘Khorana score’, developed more than 10 years ago, is widely used to estimate venous thromboembolic risk in the population of patients with cancer.18 This score integrates standard laboratory parameters (platelet count, haemoglobin, leucocyte count), body mass index (BMI) and the cancer site (with pancreatic cancer and gastric cancer classified as very high risk). Still, its performance was questioned in a retrospective cohort of patients with pancreatic cancer19 and in a prospective cohort study of patients with different cancer types, among them 109 with pancreatic cancer.17 The clinical association of PDAC, sarcopenia/cachexia and thromboembolism is well described,9 but still not understood in its pathophysiology.20 Within the SASKit study, we aim to identify biomarkers and molecular mechanisms contributing to this clinical association, by investigating their relation to clinically relevant outcomes.
IS: prevalence and outcomes
IS occurs in the German population with an incidence of 236 per 100 000 per year.21 The mean age of patients with acute stroke is 73–74 years, with more than 80% of patients being over 60 years old. After a first stroke, nearly 5% of patients suffer a second stroke within a year. Mortality after IS is about 12% within 1 year and about 30% within 5 years.21 Mild to moderately disabled stroke survivors showed an elevated prevalence of sarcopenia >6 months after onset of stroke compared with non-stroke individuals (13.2% vs 5.3%).22 The mechanisms underlying sarcopenia include loss of muscle mass, reduction of fibre cross-sectional area and increased intramuscular fat deposition occurring between 3 weeks and 6 months after stroke in both paretic and non-paretic limbs.23 Comorbid, or subsequent cancer, may facilitate sarcopenia after IS. A US nationwide inpatient sample study reported that 10% of hospitalised patients with IS have comorbid cancer, 16% of them with gastrointestinal cancer and 1% with PDAC, and that this association may be on the rise.24 Additionally, within 2 years after IS, another 2%–4% of patients receive a new cancer diagnosis.25–27 Within the SASKit study, we aim to identify biomarkers to predict outcome after IS in terms of general health state (ie, sarcopenia, deterioration of clinical performance, cognitive functioning, frailty) and quality of life, as well as (co)morbidity, as we do for the PDAC cohort.
IS: known biomarkers and clinical scores
In an early study of 956 patients with acute IS, determinants of long-term mortality were age, obesity, cardiac arrhythmias, diabetes mellitus, coronary heart disease and organic brain syndrome at discharge from hospital; interestingly, hypercholesterolaemia and smoking did not affect long-term outcome.28 More recent studies uniformly identified age and stroke severity, usually assessed on the NIH Stroke Scale (NIHSS) or similar scales, as biomarkers of long-term functional outcome and mortality after stroke.29 30 Fibrinogen has been related to long-term outcome after stroke.31 32 There have been conflicting data on the predictive value of serum bilirubin levels on the long-term risk of cardiovascular disease. While some studies are in favour of a predictive value,33–35 others are not.36 Also, CRP levels have been reported to impact the functional long-term outcome after IS,37 and early neurological deterioration after IS has been related to decreasing albumin levels, elevated CRP and fibrinogen levels.38 Potential biomarkers for occult cancer in patients with IS include elevated D‐dimers, fibrinogen and CRP; infarction in multiple vascular territories; and poor nutritional status.39 Interestingly, IS patients with elevation of at least two of the following coagulation-related serum markers, that is, D-dimer, prothrombin fragment 1.2, thrombin-antithrombin complex and fibrin monomer, in the post-acute phase of stroke, were more likely to have occult cancer or recurrent stroke during follow-up for 1.4±0.8 years.40 In another study of patients with acute IS, high D-dimer levels at admission were independently associated with recurrent stroke and all-cause mortality during follow-up for up to 3 years.41 These findings underpin the idea of shared risk factors for unfavourable outcomes in IS as well as cancer and they suggest that there may be coagulation-related biomarkers indicating an early stage of carcinogenesis or stroke (see also box 2). Nevertheless, the clinical biomarkers that currently exist for predicting outcome are limited in their performance and clinical utility, and there is a need to overcome the limitations of current predictive models.42
Study rationale and aims
The primary aim of the SASKit (‘Senescence-Associated Systems diagnostics Kit for cancer and stroke’) study is to discover a set of molecular biomarkers for outcomes after PDAC and IS, which are specifically useful to predict disease-triggered deterioration of health (‘disease deterioration’ for short) in terms of probable sarcopenia,43 reduced clinical performance and quality of life (QoL). The outcomes also include the (co)morbidity of vascular events (here defined as stroke, myocardial infarction, and venous or arterial thromboembolism) in patients with PDAC, which are observed frequently apart from sarcopenia. Also included is the (co)morbidity of any kind of cancer and of cognitive decline. Moreover, we consider mortality as the most canonical outcome. Following up on the primary aim, we will investigate the nature of the molecular biomarkers to find out whether cellular senescence and other ageing-associated processes are contributing to disease deterioration. As a secondary aim, we will search for potential diagnostic biomarkers related to cellular senescence and other ageing-related processes that may differentiate healthy controls from patients with PDAC or IS. Avoiding unclear or circular terminology, we define a biomarker in a very general fashion, simply as a feature (data point) f1 that successfully predicts another feature f2 at a later time point,44 in a biomedical context. Here, features may be composites, based on the measurement of individual features. Often, feature f1 refers to molecular data, while feature f2 refers to phenotypic data, such as clinical outcomes. Ultimately, we aim to identify biomarkers that are easy to measure and that can then be validated in other studies to predict a clinically relevant outcome.
Methods
The presentation is based on the Reporting Recommendations for Tumor Marker Prognostic Studies (REMARK), that is, items (1 – 11) of the REMARK checklist.45 The study design is illustrated in figure 1, while the data analysis plan is summarised in figure 2.

Study design of the SASKit study. Predictor and outcome measurements along the time axis are described. NIHSS, NIH Stroke Scale; PDAC, pancreatic ductal adenocarcinoma.
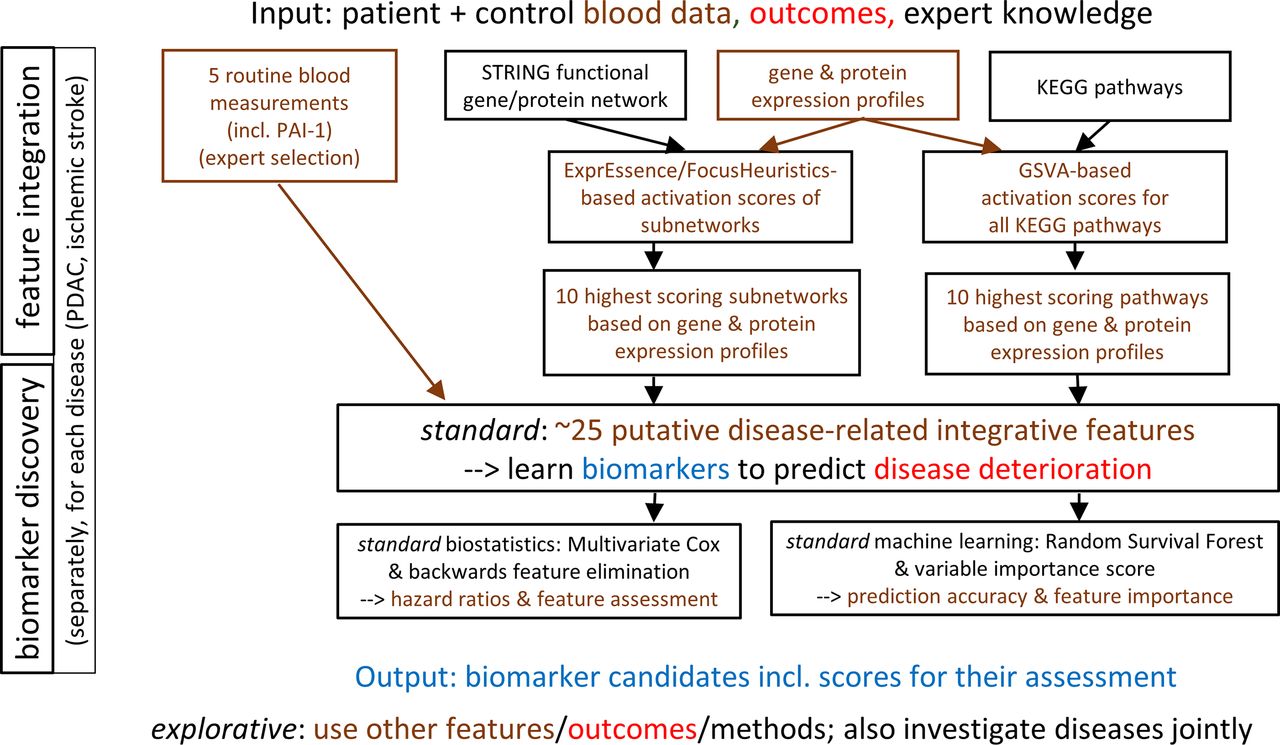
Data analysis plan of the SASKit study. Input, methods and output of the standard (but not the explorative) analyses based on biostatistics and machine learning are described in detail. PDAC, pancreatic ductal adenocarcinoma.
Study design
The SASKit (‘Senescence-Associated Systems diagnostics Kit for cancer and stroke’) study is designed as a prospective, observational, cohort study to identify biomarkers for disease deterioration in patients with PDAC or with IS and, specifically, for the (co)morbidities of these diseases including vascular events and sarcopenia following the diagnosis of PDAC as well as cancer and cognitive decline following IS. All patients will be treated for their diseases in accordance with current guidelines or therapy standards and at the physician’s discretion. Due to the observational study design, regular treatment of the patient is not affected apart from sampling blood (20–80 mL at up to seven time points over the next years). Assessment of disease deterioration will be based on standardised clinical performance measurements, and patient-reported outcomes based on questionnaires (see below for details). Additionally, data from clinical charts and information from the general practitioner will be collected. The SASKit study is divided into two subtrials with a common control group, both featuring essentially the same outcomes, predictor measurements and data analysis approaches.
Patient and public involvement
It was not possible to involve patients or the public in the design of the study.
Characteristics of participants (patients and controls)
In the first subtrial (PDAC subtrial), patients with an initial diagnosis of PDAC in locally advanced or metastatic stage without previous systemic therapy will be considered for enrolment, whereas patients with a (thromboembolic) IS of the supratentorial brain region within the past 3–10 days, with a definitive brain infarction volume >10 mL in an assessment by MRI will be considered for the second subtrial (IS subtrial). Except for some explorative analyses, the subtrials will be analysed separately.
Within both subtrials, eligible as controls are those without PDAC or IS and with no other malignant disease or other (haemorrhagic) stroke during the past 2 years. Potential controls will be recruited from persons who have lived in the same household as the patient within the last 2 years, have a maximum age difference of 12 years and are neither brothers nor sisters (ie, spouses, second-degree relatives or friends). The controls are selected so that the age and gender structure approximately reflects the age and gender distribution of the patients. Therefore, the age and gender of the patients will be continuously recorded, and the controls selected in such a way that their frequency distribution of gender at any time corresponds approximately to that of the currently recruited patients.
The following criteria lead to exclusion from participation in the study for both patients and controls, at time of recruitment:
Previous or current medical tumour therapy.
Other cancer within the past 2 years.
Previous stroke with persistent deficit.
Myocardial infarction within the past 2 years.
Therapeutic anticoagulation within the past 2 years for longer than 1 month.
Pre-existing dementia.
Chronic heart failure stage NYHA IV (New York Heart Association Functional Classification score of IV).
Terminal renal insufficiency with haemodialysis.
Known HIV infection.
Known active hepatitis C.
Pregnancy.
Age <18 years.
Both subtrials will be implemented according to the same standardised protocol. After written informed consent of each participant, patients will be followed up at 3, 12, 24, 36 and 48 months after their inclusion in the trial, whenever possible. The PDAC subtrial includes an additional time point for examinations at 6 months after inclusion, given that mortality due to PDAC is expected to be accelerated as compared with IS. Controls will be followed up at 12, 24, 36 and 48 months.
The study is expected to start in the second quarter of 2020 and will finish with the last participant’s follow-up at 48 months. Until that time, we expect that 50 patients with PDAC, 50 patients with IS and 50 controls participated in the trial. The study will be conducted at the Rostock University Medical Center (UMR), Germany at Clinic III—Haematology, Oncology, Palliative Medicine and at the Department of Neurology; the institutions of the other coauthors are supporting the study in a variety of ways. The study is registered at German Clinical Trials Register (DRKS00021184) and will be conducted following ICH-GCP (International Council for Harmonisation - Good Clinical Practice).
General health-related and disease-related and demographic data
General data of the study participants will be recorded at the beginning of the study (‘month 0’) and consist of the following: age, sex, BMI, temperature, blood pressure, heart rate (ECG). Furthermore, through interviews the following additional data will be recorded: vascular risk factors (arterial hypertension, diabetes, hyperlipidaemia, smoking habits), history of vascular events (stroke, myocardial infarction, venous or arterial thromboembolism), atrial fibrillation, history of cancer, current medication, surgery or blood transfusions in the past 3 months, and vascular or cancerous events affecting any first-degree relatives. These data may provide influential factors for explorative analyses, or be employed to interpret and discuss the results of the study.
Blood sampling
Blood sampling will be done in a standardised fashion, that is, fasting and between 08:00 and 10:00, for all assays. Routine blood parameters will be recorded at the time points described above (months 0 to 48). These consist of differential blood count, reticulocytes, INR (international normalised ratio of prothrombin time), partial thromboplastin time, D-dimers, fibrinogen, factor XII, albumin, bilirubin, LDH, high-sensitive CRP, CA19-9, cholesterol, and HbA1c. Among the standard measurements, we also measure the liver parameters alanine aminotransferase (ALT), aspartate aminotransferase (AST) and alkaline phosphatase (AP) as surrogate markers of liver disease.
Experimental blood analysis (PAI-1 and omics) will be done for patients at month 0 in case of PDAC, at month 0 or at month 3 in case of stroke (where the 3-month time point is taken if it reflects a better state of the patient as described by the NIHSS) (‘baseline’). It will furthermore be repeated at month 3 in the case of PDAC, and at month 12 in the case of stroke (‘landmark’). For controls, the experimental blood analysis will be carried out at month 0 and at month 12, assuming that for these, data do not change much in 3 months after baseline. The justification for taking the better clinical state in case of stroke is the maximisation of differences with the month 12 follow-up data. In terms of practicality (being able to calculate a biomarker signature sooner), however, the state at month 0 should be selected for all stroke patients. Since the blood sample will be taken preprocessed and frozen at month 0 in all cases, we are in principle able to perform the experimental blood analysis for all patients with stroke at month 0, and we can do this analysis in retrospect if deemed necessary. We also take blood of patients with PDAC at month 12, to have the option to do an experimental blood analysis based on these samples, if deemed useful. In the following, we will refer to the baseline time point (month 0, or month 3 in cases of patients with stroke that improved) and the landmark time point (month 3 for patients with PDAC and month 12 for patients with stroke and controls). The experimental blood analysis is done earlier for PDAC because of high expected mortality within the first year.
The experimental blood analysis includes PAI-1 (see box 2) as well as high-throughput (omics) analyses, that is, transcriptomics and proteomics analysis in T cells and proteomics of serum. T cells are of interest because these cells were reported to carry the strongest signal with respect to cellular senescence, based on marker p16.46 We intend to measure gelsolin and osteopontin as well, provided that sufficiently standardised assays become available in due time; the blood collected for this measurement shall otherwise be used to measure cytokines/chemokines such as interleukin (IL)6, IL8 and tumour necrosis factor ɑ, which are part of the SASP, by ELISA assays. At time of writing, we do not yet have reliable estimates on the amount of blood cells still available for measuring protein expression, so an antibody-based protein array (in case of low amounts), or mass spectrometry (in case of sufficiently high amounts) will be used alternatively. For the blood serum, we intend to use the same protein measurement method. In the default case of a protein array, we plan to use the novel but dedicated ‘Senescence Associated Secretory Phenotype (SASP) Antibody Sampler Kit’ (consisting of approximately 10 SASP-related proteins being measured; Cell Signaling Technology) for both cellular and serum proteomics. Further exploratory molecular analyses not (yet) funded but permitted based on the ethics approval include the following: single-cell analyses of blood, methylation assays for calculating epigenetic clocks,47 genetics by SNP array or whole-genome sequencing, and telomere length. A separate ethics approval was granted for an optional skin biopsy; skin microbiome analyses are planned as well. More specifically, participants have the option to provide a skin biopsy of 5 mm from an area that is not usually visible. We expect that about 30%–50% of the participants will opt in. We keep the biopsy in culture for several days and divide it into several pieces. Using these, we measure biomarkers of cellular senescence (specifically, senescence-associated β-galactosidase, which cannot easily be measured in blood) and we treat some pieces with compounds that may affect cellular senescence, such as quercetin or fisetin. Moreover, we plan to sample the microbiome of the forehead using a standard swab. This is a very simple procedure, motivated by the claim that a competitive epigenetic ageing clock can be based on such a sample.48
Blood sample processing for the experimental analysis will be performed according to standard operating procedures (SOP) at the research laboratory of Clinic III—Haematology, Oncology, Palliative Medicine. The procedures include flow cytometric control of the sampling quality including distribution of cell types and vitality as performed in routine diagnostics. Isolation of peripheral blood mononuclear cells will also be performed following the SOP used by the laboratory in routine diagnostics. T cell separation will be performed according to an established work flow based on magnetic bead purification via Miltenyi MACS following manufacturer’s instructions. T-cell fraction purity as well as vitality will then be verified by flow cytometric analyses as described above. Nucleic acid isolation as well as protein isolation will be further performed according to the SOP of the research laboratory performed using column separation (Qiagen, Hilden Germany). RNA integrity values (RIN) will be analysed using an Agilent Scientific Instruments Bioanalyzer as instructed by the manufacturer. RIN values above 6 will qualify for RNAseq or Clariom D Array analyses; for RNAseq, average reads per sample will be set at approximately 40×106.
Clinical performance measurements and patient-reported outcomes
At baseline and at each follow-up, handgrip strength (‘grip strength’ for short) is measured using a digital hand dynamometer (Jamar Plus). The test is performed while sitting comfortably, shoulder adducted, elbow placed on the tabletop and flexed to 90 degrees, with the forearm and wrist in a neutral position.49 The highest value of three measurements of maximal isometric contraction of the dominant hand, or if paralysed due to IS, contraction of the unaffected hand, is documented in kg. Further, the following clinical performance measurements are evaluated by the study physician or study nurse according to standard protocols: ECOG Performance Status (ECOG PS),50 Modified Rankin Scale (mRS),51 Canadian Study on Health & Aging Clinical Frailty Scale (CSHA-CFS),52 NIH Stroke Scale (NIHSS),53 Montreal Cognitive Assessment (MOCA).54 All raters are certified for the applicable scores (mRS, NIHSS, MOCA). Patient-reported outcomes (measured by questionnaires) are the following: EQ-5D-5L and EQ-VAS (generic evaluation of QoL in five domains and overall on a visual analogue scale (VAS)),55 HADS-D (evaluation of anxiety and depression),56 WHODAS 2.0 (WHO Disability Assessment Schedule),57 PASE (Physical Activity Scale for the elderly),58 and, for patients with PDAC, FACIT-Pal (evaluating QoL with focus on palliative symptoms and needs).59 60 All questionnaires are administered following the suppliers’ instructions.
Follow-up data
Apart from the clinical and patient-reported outcomes, further follow-up data are BMI, temperature, blood pressure, heart rate (ECG), atrial fibrillation, current medication, tumour treatment, comorbidity (any vascular or cancer event), hospital admissions or palliative care. Additionally, based on clinical charts and information from the general practitioner, we will record medication, (co)morbidity and mortality. Just like the general health-related and disease-related and demographic data recorded at time of recruitment, these data may provide influential factors for explorative analyses, or be employed to interpret and discuss the results of the study.
Endpoints
In both subtrials, the primary endpoint is a composite measure of ‘disease deterioration’ defined as the first occurrence within a follow-up interval of at least one of the following:
Sarcopenia, measured by grip strength less than 27 kg for males and less than 16 kg for females (according to the revised European consensus, EWGSOP2).43
Deterioration of clinical performance, that is, of the ECOG PS by at least two points (PDAC subtrial), or of the mRS by at least one point (IS subtrial).
Deterioration of QoL, described as a reduction of the EQ-5D-5L by at least 0.07 in the index score, and deterioration of at least seven points in the EQ-VAS (ranging from 0 to 100).
Deterioration will be considered between baseline (month 0) and the respective landmark (follow-up) investigation. As described above, for patients with IS who have improved their condition (measured by NIHSS) within the first 3 months, this time point (month 3) will be used as a baseline instead. Item (a) is the deterioration from ‘no sarcopenia’ to ‘probable sarcopenia’ as defined by current consensus.43 Grip strength has been widely used for assessing muscle strength, which is currently used as the most reliable measure of muscle function, loss of which indicating sarcopenia.43 ECOG PS is established in describing the general condition of patients with cancer, whereas mRS is established in patients with stroke. Death is reflected by both scores as ECOG PS of 5 or mRS of 6, and it will always consider death from any cause. The EQ-5D-5L evaluates QoL in five dimensions (mobility, self-care, usual activity, pain/discomfort and anxiety/depression), all relevant for patients with PDAC and IS. Furthermore, it is a generic score so that results will be comparable for different diseases (as recently described in patients with stroke61 and for the general population).62 Even though disease-specific scores might evaluate symptom burden in even more detail, the EQ-5D-5L was recently shown to be comparable to QoL scores developed specifically for pulmonary embolism and deep vein thrombosis (ie, PEmb-QoL, VEINES-QOL/Sym and PACT-Q2) in terms of acceptability, validity and responsiveness.63 A clinical deterioration in EQ-5D-5L is described as a minimal important difference in the range from 0.07 to 0.09 index points and in VAS from 7 to 10 points,64 which is the basis for the definition of item (c). Controls reach their endpoint by the same definition as the subcohort for which they serve as control; in any integrative analysis of both subtrials, a deterioration of the mRS by at least one point will be used as the criterion (instead of ECOG PS), because patients with stroke in general have a slower deterioration than patients with PDAC, and controls naturally have the slowest expected deterioration.
The primary composite endpoint and all secondary endpoints will be evaluated in a first analysis, based on data obtained until summer 2021, and in a second analysis, based on data obtained until summer 2023, and in a third analysis at the end of the study. The second analysis may be delayed until data of 90% of the study participants are available (at least including the month 12 follow-up) and it may then constitute the ‘main’ analysis of the study. To address potential impacts of COVID-19 on the primary and secondary endpoints, the typical COVID-19 symptoms as well as confirmed diagnosis of COVID-19 are recorded for all study participants at each study visit. In addition, at month 12, the presence of serum anti-SARS-CoV-2 IgG antibodies will be analysed.
The following secondary endpoints will be evaluated:
Each component of the primary endpoint (separately).
Occurrence of disease-specific (co)morbidities, as follows:
New vascular events (stroke, myocardial infarction, venous or arterial thromboembolism), specifically in patients with PDAC.
New cancer, specifically in patients with IS.
Probable sarcopenia (based on grip strength).
Cognitive decline (deterioration of MOCA by three points from best value at baseline).
Frailty, defined as a CSHA-CFS level of 6, 7 or 8.
All-cause mortality.
Further, a sum-score summarising all measurements of phenotypic variables (grip strength, clinical performance measurements, comorbid events, mortality) will be considered as a surrogate for ‘ageing’, normalising all continuous-scaled components in order to obtain a common scale with an average of 0 and SD of 1. The components of the sum score will all be given equal weight.
Predictors
While all phenotypic features (grip strength, clinical performance, patient-reported outcomes, comorbid events, mortality) are contributing to the definition of endpoints (as dependent variables/parameters), all routine and experimental blood features (PAI-1, omics) are considered to be potential predictors; these are also called the independent variables/parameters. This delineation is justified by (1) the paradigm that (clinical) relevance is tied to high-level phenotypes describing health and survival, specifically including QoL,44 and (2) the goal of developing a ‘senescence-associated systems diagnostics kit’ that includes a careful selection of biomarkers contributing, as much as possible, also to molecular-mechanistic insights into PDAC, IS and their (co)morbidity, which we hypothesise to be related to cellular senescence and ageing. Age and gender will be included as mandatory covariates (also termed confounders, ie, predictors that we do not aim to explore, or which we wish to improve on) in all statistical models. Further covariates are smoking, liver dysfunction or disease, the baseline NIHSS score in case of IS, as well as locally advanced versus metastatic PDAC and modality of treatment in case of PDAC. As described, the successful predictors identified by our study, following the statistical analyses outlined below, are called biomarkers; we wish to stress that these are only candidates for the ultimate goal of clinically validated biomarkers; in particular, they still need to be validated in further studies (based, eg, on other cohorts). A set of biomarkers is also called a biomarker signature.
Blinding and pseudonymisation
No blinding will be done during the study. However, the primary composite endpoint will be documented without subjective influence due to standardised definitions. Thus, detection bias will be kept at a minimal extent. Furthermore, information bias will be minimised as we will use simple measurements, which are applied in daily practice or are self-reported and easy to perform (eg, EQ-5D-5L). The rigorous inclusion of all eligible patients within the recruitment period will help to minimise selection bias. All patient data are pseudonymised to all investigators except for the attending physician and study nurse. Since all major data analyses are based on known information about the outcomes (eg, supervised machine learning with cross-validation), the data analysis will also be performed based on the pseudonymised data. Protection of personal and clinical data of all patients and controls will follow all relevant legal regulations.
Sample size
No formal sample size calculation was performed a priori for this observational study. The prevalence of PDAC combined with the requirement to complete the study within a reasonable timeframe implied a target of 50 patients per group (PDAC, IS and control group). Nevertheless, a power analysis revealed that a sample size of 50 patients will have 80% power to detect a significant difference by a non-parametric Wilcoxon statistic between an AUC of 0.75 for a particular biomarker signature compared with the null hypothesis value of 0.5 at a significance level of 5% under the assumption that about three times as many patients will reach the primary endpoint, compared with patients who will not reach the primary endpoint.65
Data analysis plan
General considerations
The guiding criteria for biomarker identification in the SASKit study are the maximisation of the predictive signal, clinical relevance/utility, biomedical/molecular/clinical interpretability and practicality/cost. Given the relatively low number of participants in this in-depth study, to maximise the signal for the endpoints and predictors given as outlined above, we must aim to use all available information. Regarding endpoints, whenever possible, we thus wish to consider the (censored) time-to-event information inherent in the baseline and follow-up examinations, and in the mortality data. The primary endpoint was defined to integrate expected clinical utility and maximum signal. In defining the (secondary) endpoints, we considered an array of clinically relevant single endpoints as well as a sum score of all phenotypic measurements; we hypothesise that the latter carries the largest amount of signal. Given the small sample, we cannot set aside an extra validation dataset. For the predictors considered to be covariates/confounders, please see the Predictors section. The data analysis plan is summarised in figure 2.
Data quality assessment and cleaning
The need for (and the amount of) data cleaning cannot easily be estimated beforehand; we plan to follow the MarkAGE guidelines66 to deal with missing values, and to detect and rectify outliers and batch artefacts.
Predictor/Feature integration
Regarding predictors (features), we first need to remember that we measure at baseline (at months 0 or 3) and at one landmark (main follow-up, ie, at months 3 or 12). While use of baseline features is unrestricted, use of landmark features is, of course, restricted to prediction of outcomes after the landmark. Further, we need to handle the high dimensionality of the omics features. Here, upfront feature integration, for example, by averaging measurements as described below, is considered preferable specifically for the high-dimensional omics data, for the following reasons.
A small feature space allows for an easier understanding and interpretation.67
Integrated features can be used as input for both the standard biostatistics and the standard machine learning parts of the analysis.
Use of few features is more time-tested than newer methods featuring the joint calculation of the prediction model and the selection of the features, although the latter are quite often claimed to be superior by their developers.
Naturally, feature integration avoids multicollinearity and overfitting, and multiple testing is less of an issue. This counters the ‘curse of dimensionality’ and ‘de-noises’ the data towards better prediction performance.67 68
Feature integration allows the handling of feature heterogeneity, which in our case refers to routine blood measurements as well as various omics data types.
In the explorative analyses, systems biology modelling and the parallelogram approach are both supposed to deliver further small sets of integrated, highly informative features, which may, for example, dominate systems behaviour, or which are believed to translate well from animal models to humans.
While most features will be available for the baseline and the landmark time point, using baseline data is clinically more useful, simply because the prediction for the endpoint is available much earlier. Nevertheless, in the explorative analyses, we will investigate the predictive power of changes in feature measurements from baseline to landmark, given that such changes may be more informative about future disease deterioration (and other endpoints) than just baseline values.
Specific omics data feature integration
Notably, we face a heterogeneous ‘multi-view’ dataset, usually referred to as ‘multi-omics’. Our feature integration approach (see above) is also known as a ‘late integration’ type of analysis, implying that measurements for different omics data types are reduced early on to activation scores for pathways or subnetworks that are then integrated at a ‘late’ level. To calculate the activation scores for subnetworks, we use, by default, the ExprEssence/FocusHeuristics linkscore,69 70 taking the links (gene/protein interactions) from a functional interaction network defaulting to STRING. Our experience with the linkscore motivates us to include this method as one of the approaches proposed for feature integration in the following, influencing the calculation of up to 10 features on which the standard biostatistics and machine learning shall be based. Specifically, we take the average expression measurement for all patients (as a list of expression values, one per gene) and the average for all controls (as a list of expression values, one per gene) to calculate a linkscore for each STRING interaction, and assemble a ‘condensed’ network including all interactions with a linkscore in that percentile for which the 50 highest-scoring interactions are shown. These interactions form subnetworks.71 We then take the average linkscore for each subnetwork as the subnetwork activation score. Alternative methods such as keypathwayminer will be used in the exploratory analyses, see below. For the pathways (in our case, the source is the Kyoto Encyclopedia of Genes and Genomes, KEGG), we will calculate pathway activation scores using gene set variation analysis (GSVA).72 This method calculates pathway activation scores from expression data, is suited for use with microarray as well as RNAseq data, and performed strongly in a recent benchmarking analysis.73 The GSVA-based pathway activation scores can subsequently be compared between patients and controls in the same way as normal gene expression data, calculating, for each pathway, a fold change of the pathway activation scores between patients and controls. Here, we average over all patients and over all controls, respectively, using the limma R package and adjusting for age and gender of the individual patient/control pathway activation. An example of this approach is given in the GSVA publication, where differential pathway activation was identified between acute lymphoblastic lymphoma and mixed-lineage lymphoma.72 The major downside of feature integration may be information loss; subsequent statistical and machine-learning-based analyses receive only a tiny fraction of the amount of information that is available in total.
Gene expression data (transcriptomics) will be our preferred omics data type. Nevertheless, proteins are closer to the phenotype than transcripts, so we wish to not ignore these. Therefore, we prepare to deal with both kinds of proteome data that we may expect (see the Experimental blood analyses section), as follows.
Large-scale data, likely based on mass spectrometry, in the order of hundreds or more proteins that can be identified and measured in all the conditions investigated.
Small-scale data, likely based on antibody arrays, in the order of 10 proteins or less.
Except for the raw data preprocessing depending on the platform, once log-fold changes describing differential expression are established, we thus expect to handle the large-scale proteome data essentially the same as the transcriptomics data, and the small-scale proteome data similarly to the blood routine data, for cells and serum alike. Overall, the omics data are expected to come along three main coordinates, that is,
As blood cell transcriptomics and proteomics as well as serum proteomics.
Longitudinal in time (for baseline and landmark).
For PDAC, IS and control.
All coordinates can be exploited for differential analyses, even though the PDAC and IS data will be analysed separately except for some integrative explorative analyses (see below). In the explorative analyses, the longitudinal transcriptomics of the patients and controls will also be analysed together, see below. For the standard biostatistics and machine learning analyses, we plan to employ five approaches to feature integration, each yielding a shortlist of five integrated features, as follows.
(five features) A first shortlist of features will consist of the following expert selection from the routine blood measurements (including PAI-1): neutrophil–lymphocyte ratio, fibrinogen, high-sensitive C reactive protein, albumin and PAI-1.
(five features) For the cellular gene expression measurements, we use ExprEssence/FocusHeuristics (see above) to calculate the top-5 subnetworks scoring highest.
(five features) Again for the cellular gene expression measurements, we use GSVA (see above) to calculate the top-5 most strongly changing pathways as features.
+5. (10 features)
(a) In case of dealing with large-scale serum proteomics data, we proceed as in (2.) + (3.);
(b) In case of dealing with small-scale serum proteomics data, we proceed as follows:
(i) If the number of features measured successfully is in the order of 10, we refrain from any processing.
(ii) If the number of features is in the order of around 10–100, we select the 10 features with the smallest p values indicating differences between the mean values of patient and control, based on a t-test.
For genomic features as per (2.), the feature measurements for an individual patient or control will then be the average linkscores of the five selected subnetworks, contrasting each patient with average control data, and each control with average patient data. For genomic features as per (3.), the feature measurements for each patient/control will be the GSVA scores of the five selected pathways. By construction, we expect the resulting features to reflect the up/downregulation of disease-related transcripts/proteins or pathways/subnetworks. Using the GSVA-based integrated features as input to the biostatistical analyses employing Cox proportional hazard models, we are in fact closely following the ‘Survival analysis in ovarian carcinoma’ example as described in the GSVA publication.72 Regarding the expert selection from the routine blood measurements, we are aware that some of these features may be considered to have an almost trivial relationship to outcome prediction for the diseases we study; for example, fibrinogen may correlate strongly with the size of the stroke-damaged brain area and may thus be considered a covariate. However, to our knowledge, none of these features are validated clinical biomarkers, and it is quite possible that a combination of simple biomarkers is key to the best possible prediction. We selected the neutrophil-lymphocyte ratio specifically because it is cheap to measure; it is, however, like many other blood-based features, easily influenced by acute infection.
Exploratory feature integration
Apart from the FocusHeuristics/ExprEssence linkscore, we employ alternatives such as keypathwayminer.74 Further, we calculate pathway activation scores for the following senescence-related KEGG pathways, which include PAI-1 (see the Introduction section) but do not refer to a specific disease, as of February 2020: Cellular senescence, HIF-1 signalling pathway, p53 signalling pathway, Apelin signalling pathway, Hippo signalling pathway, Complement and coagulation cascades. ‘Early integration’ by, for example, first averaging transcript and protein expression on a single-gene basis, is also planned.
Choice of data analysis methods for biomarker discovery
We will consider two main approaches of data analysis: one motivated by statistical methods, the other by machine learning approaches. While this delineation may ultimately be meaningless, we consider that regression is the core ingredient of the former, while supervised learning characterises the latter. We will apply standard methods (mostly in biostatistics) and explore novel approaches (mostly in machine learning; preserving signal implies a focus on supervised approaches in this case). Data analysis for biomarker discovery trials in a clinical setting is usually described with a biostatisticians’ mindset, who also developed methods to cope with the high dimensionality of omics data (see below). On the other hand, the challenges of omics data also spurred the recent publication of many methods adopting machine learning, which however did not yet make it into clinical trial analysis routine, but which we wish to test (see below). We will focus on methods readily available in SAS (current version is 9.4) or as R packages. Notably, the correct choice of method depends in part on known unknowns such as the strength of the signal (incl. the amount of missing data) in the routine blood measurements and the omics.
Prediction model quality measures
Unlike intervention trials with their highly standardised aim of establishing a statistically significant superiority (or non-inferiority) of one intervention compared with another (or to standard of care), observational biomarker trials are a more recent development with fewer precisely quantified criteria of success, and a stronger need to consider the effect size: even if a biomarker signature enables a significant improvement in predicting an outcome, raising the accuracy of the prediction, say, from 70% to 75% may not be clinically meaningful, depending on prevalence of the condition to be predicted, the cost of the biomarker measurement and so on. We thus aim to identify biomarkers making a maximum of difference in prediction accuracy, if we are able to compare to established scores (see also below). For the biostatistics part, the concordance statistics (c-index) will be used as an overall measure of predictive accuracy, and time-dependent receiver-operator characteristic (ROC) curves and area under the curve (AUC) will be used to summarise the predictive accuracy at different cut-off points in time. For the machine learning part, the cross-validated accuracy and AUC/c-index, following,67 are used, and to take care of a potential Simpson’s paradox we will either analyse the data stratified by gender, or we will add such an analysis and check for consistency. More generally, to investigate the role of confounders (and, if necessary, to correct for these) in the machine learning part, we wish to use the permutation technique described in Neto et al.75 We expect that we can identify a set of biomarkers that affords an accuracy of 75% or more or an AUC of 0.75 or more in correctly predicting the primary endpoint with a precision of ±12%.76 This estimate of precision is based on half the width of a 95% CI for a probability of 75%, by extension of item 6 of the tables of Sorzano et al,76 which shows precision up to a sample size of N=30.
Standard biostatistical analyses
A Cox proportional hazards regression model adjusted for age and gender will be used to estimate the HR and corresponding 95% CI to predict the primary composite endpoint separately within the PDAC cohort and IS cohort. The five shortlists of five features (see above) will be providing the canonical predictors, analysed together. For selection of the most important features that might be related to the primary endpoint, we will use a procedure proposed by Sauerbrei et al,77 as follows. First, 100 bootstrap samples will be generated. Then, a multivariate Cox proportional hazards regression model with backward elimination with selection level of 0.05 will be fitted to each replication of the original data set. In a second step, features with a relative selection frequency of 30% or less over all bootstrap samples will be eliminated. In a third step, each feature Xi for which the hypothesis of independence in combination with a feature Xj can be rejected will be eliminated if Xi is less important when Xj is included in the model, or if it does not gain importance when Xj is excluded from the model. All remaining features will be included in the final model. Graphical and numerical methods will be performed to establish the validity of the proportionality assumption78 in the final model. Results will be reported as p values, HRs and corresponding 95% CIs. A p value of p≤0.05 will be interpreted as indicating statistical significance. From the final model, a risk score will be calculated by multiplying the individual feature measurement of a patient with the estimated regression coefficient of each feature. The c-index will be used as an overall measure of predictive accuracy of the resulting score, a time-dependent ROC curve and AUC will be used to summarise the predictive accuracy of the score at specific times. All secondary endpoints will be evaluated using the same approach as for the primary endpoint except for the sum score used as a surrogate for ‘ageing’. For this endpoint, a linear mixed effects model with random intercept and spatial power covariance structure will be fitted to the data to estimate the progression of ‘ageing’. The covariance structure is chosen to reflect the unequal intervals of follow-up investigations. Model assumptions and model fit will be checked by visual inspection of residuals, and influence diagnostics. Missing values will be taken into account by a likelihood-based approach within the framework of mixed linear models with the assumption that missing values occur at random. Results will be reported as p value assessed at a level of significance of 5% accompanied by the value of the test statistic and df. In addition, 95% CIs for the progression (slope) will be provided.
Additional exploratory biostatistical analyses
Again, the primary composite endpoint as well as all secondary endpoints will be evaluated separately within the PDAC cohort and IS cohort of the respective subtrials. In a first approach, univariate Cox proportional hazard models adjusted for age and gender will be calculated for each omics feature (R package survival) using a cut-off of 0.05 on the false discovery rate. In a second approach, all omics features will be simultaneously considered in a multivariate Cox model, adjusted for age and gender. Towards this aim, a component-wise likelihood-based boosting algorithm proposed by Binder and Schumacher79 (R package CoxBoost) will be used to develop a biomarker signature.
Standard machine learning
For the machine learning part, the primary outcome and all secondary outcomes give rise to an assignment of predictor/feature lists to "survival" times, one such list per study participant, for which biomarkers are then learnt in a supervised fashion. As described, in the standard analyses, feature integration (see above) will precede the actual calculation of the model (‘deep’ learning approaches that take in ‘all’ features are part of the exploratory analyses, see below). In the same way as the standard biostatistics analyses, the same five shortlists of five features each (see above) will be providing the canonical predictors, analysed together. Exploiting time-to-event information, we will employ random survival forests (RSF) as described by80 with the following advantages.
RSF can now be considered a time-tested approach, and it was the subject of a recent extensive review81 and of a systematic comparison with LASSO approaches in the case without feature selection (see item 7 of the tables of Pi et al82 for its competitive performance which is not reflected in their abstract).
RSF can also work on essentially all features, without a preceding feature integration/selection step, and then be compared, in the explorative machine learning analyses described below, to survival support vector machines (SSVM) and to a novel method Path2Surv that ‘conjointly’ performs feature selection and model training, see previous work.67
RSF was recently compared with Cox-nnet,83 a neural network approach which we consider as very promising for the exploratory part, see also below.
RSF offers a considerable degree of interpretability, given that RSFs are derived from decision trees.
RSF is considered ‘completely data driven and thus independent of model assumptions’ and ‘in case of high dimensional data, limitations of univariate regression approaches such as overfitting, unreliable estimation of regression coefficients, inflated standard errors or convergence problems do not apply’.81
In the machine learning part, we calculate accuracy and AUC/c-index using cross-validation to make the best use of our limited sample size, following the setup of Dereli et al67 and Pi et al82 (who, however, set aside separate validation datasets), and we assess the features as biomarkers by ranking them by their variable importance score.
Additional exploratory machine learning
Apart from the more time-tested standard machine learning described above, we will also explore methods that were proposed recently, for which it is less straightforward to tell whether these methods are fit-for-purpose in our case, even though they are usually claimed to be superior by their developers based on some test/validation datasets. Specifically, as mentioned above, we expect to test Path2Surv and SSVM67 as well as Cox-nnet83 (without prior feature integration); the latter in particular promises a high degree of interpretability. We further explore CNet (employing the censored-data variant), for interpretable biomarkers. We also plan to employ the PASNet,84 SurvivalNet85 and SVRc86 packages. The longitudinal transcriptomics of the patients and the controls may also be analysed integratively based on the ‘optimal discovery procedure’,87 considering, however, that landmark feature data can only be used to predict events after the landmark. Finally, we will map the differential omics data onto a human ‘healthspan pathway map’,88 that is, a set of clusters/pathways based on health-related genetic data that we assembled recently.
Explorative systems biology modelling, explorative parallelogram approach and transfer learning
As mentioned, systems biology modelling and parallelogram89 90 extrapolation are supposed to deliver small sets of highly informative features, by contributing features that are dominating model behaviour or that are shown to translate from the SASKit animal model data. Given the comparatively small number of study participants (but in-depth measurements), we also wish to explore ‘transfer learning’, which aims to utilise large amounts of public knowledge in the form of latent variables. Specifically, we plan to use, and wish to develop further, the Multiplier91 approach motivated by the analysis of rare-disease data. Multiplier uses the RNASeq-based recount2 compendium, and apart from the functional network and pathway data that we use in the feature selection part, this compendium is expected to be a main source of biological knowledge that enters the calculations for biomarker discovery.
Miscellaneous exploratory approaches and discovery of diagnostic biomarkers
We will also use unsupervised machine learning to generate descriptive multi-omics correlation networks, as they were most recently employed by Schüssler-Fiorenza et al,92 there supplemented by linear mixed effects models using (un)restricted maximum likelihood approaches; in this very recent biomarker discovery trial of similar design as ours, but with many more longitudinal omics measurement time points than ours, we could not identify other biomarker discovery methods being used. If genetic data become available, we will include these in some analyses; specifically, we will investigate the added value of expression quantitative trait loci (eQTL) analyses. PDAC and IS data will be analysed together in some integrative exploratory analyses. In that case, the occurrence of specific endpoints will be evaluated according to the group membership (PDAC or IS). This means that in addition to the biomarker signature, a group variable, indicating PDAC or IS patients, will be included in the analysis, to assess the difference in the progression of the respective endpoints between patients with PDAC and patients with IS. We also wish to compare PDAC and IS patient data to data of healthy controls (adjusted for age and gender) by means of logistic regression models with the aim of identifying candidate biomarkers for the diagnosis of the respective disease; we then specifically investigate the association of these diagnostic biomarker candidates with cellular senescence and other ageing-related processes (see also the next paragraph).
Further analyses and comparison with existing biomarkers and biomarker signatures
Towards the end, we will investigate the overlap for the various biomarker identification approaches we employed, assuming that the most frequently found biomarkers may be the most robust and valid ones. Moreover, we will compare with existing biomarkers and signatures. Regarding the prediction of vascular events, we will specifically calculate the Khorana and related scores17 for comparison, and report the difference in performance. Further, for all biomarkers we find, we will check their association with cellular senescence, by manual inspection, literature investigation, comparison to CellAge93 and the SASP Atlas94 or by formal enrichment analyses if the number of biomarkers is sufficiently large to do this in a meaningful way. Also, in a final step, we plan to identify and filter out the biomarkers that are volatile in the controls. In addition, a comparison of the biomarker profiles before and after the comorbid event is aimed for. Finally, for publicly available data of other trials with a sufficient overlap with our predictors, we will use these as validation datasets.
Discussion
Limitations
Arguably, the most serious limitation of the SASKit study is the low number of participants. We mentioned above that in the 4-year timeframe of the entire study, at the Rostock University Medical Center we cannot expect to recruit many more than the 50 patients with PDAC to be included in this study; we could recruit more patients with stroke and more controls, but given the call for proposals that allowed this exploratory (not confirmatory) study to be applied for and funded, we considered that within a limited budget, in-depth omics characterisation, animal models (to be detailed in a follow-up publication) and a comprehensive data analysis plan including systems biology modelling were important aspects of our study that we did not want to exclude.
The two most obvious risks to the main goal of finding good biomarkers for the primary outcome based on the standard data analysis are the following. First, we found it hard to estimate the distribution of events as defined by the primary outcome; we cannot exclude that too many events take place already at the start of the study, or until the first follow-up, specifically in the PDAC subtrial, limiting the amount of information available to the subsequent time-to-event analyses. Then again, had we defined the primary outcome more conservatively, there would have been a chance that not enough events happen before the end of the study. Second, we could not identify role-model publications reporting results of biomarker explorations that made use of machine learning methods, except for, to some extent, Schüssler-Fiorenza et al,92 so that we enter unknown territory to some degree. The two most obvious risks to our goal of investigating the role of cellular senescence in the (co)morbidity of PDAC and IS could be an insufficient prevalence of comorbid events and the complex role of treatment in case of PDAC, where additional cellular senescence is most likely triggered by therapeutic intervention.95 Then again, all molecular high-throughput analyses are essentially explorative and we are open to discovering biomarkers of disease that do not relate to any of our prespecified hypotheses.
Implications
We designed the SASKit study to synergistically deliver on multiple aims that we consider to be of relevance for specific disease prognosis and treatment as well as for primary, secondary and tertiary prevention. Employing clinical performance measurements and patient-reported outcomes, we aim for clinical relevance and we suggest that prognostic biomarker signatures for general health and QoL are perhaps more important than (progression-free) survival, although there is much more data about the latter. Moreover, good disease treatment options are still lacking for PDAC as well as for stroke, and the more we find cellular senescence implicated in disease deterioration, at least in a subgroup of patients with a specific biomarker signature, the more confidently we can suggest, and further explore, senotherapeutic interventions for these two diseases.
Notably, we are in the process of starting a parallel human study testing, in healthy elderly people, interventions into cellular senescence, based on food rich in seno-interventional compounds, and we expect that many aspects of the study design presented herein will be adopted in that parallel study. That study will also investigate ageing-related and senescence-related outcomes, and as such it can be seen as a test of a cautious yet potentially very effective approach to primary prevention; if the diagnostic biomarkers we find in the SASKit study relate to cellular senescence, this observation would constitute further evidence for (cautious) seno-interventions, moving towards a kind of universal approach of disease prevention by tackling fundamental ageing-related processes (see boxes 1 and 2).
Secondary prevention, aiming to reduce the impact of a disease that has already occurred, can ultimately be supported by the SASKit study, if we can demonstrate, and (in follow-up studies) confirm, a distinctive role of cellular senescence (and/or other ageing-related processes such as inflammation/inflammaging96) in disease deterioration as defined here. Finally, evidence for tertiary prevention by senotherapeutic intervention, aiming to attenuate the impact of an ongoing disease, is also an option based on how accurate, relevant and specific our biomarkers will be.
Last but not least, we expect that the in-depth molecular analyses that we wish to conduct will provide mechanistic insights into the aetiology of the diseases we study here, which we just see as models for the investigation of the fundamental role of ageing in general, and of cellular senescence in particular, in disease and dysfunction.
Ethics and dissemination
The study protocol has been approved by the ethics committee of the UMR (Ethikkommission an derMedizinischen Fakultät der Universität Rostock, A2019-0174). Results shall be published after completion of the study, following standard guidelines.
References
Footnotes
Twitter @Limenian
LH and UW contributed equally.
Contributors Conception, writing and revision: LH, UW, HME, CJ, RJ, RK, FL, AS-Y, OW, MH, IB, DP, SM, AK, N, GF. Specific clinical considerations: LH, UW. Specific experimental considerations: HME. Data analysis plan: DP, NH, GF. Acquisition of funding: LH, UW, HME, CJ, RJ, RK, AS-Y, OW, GF. Project coordination: AK, GF.
Funding We acknowledge the financial support by the Federal Ministry of Education and Research (BMBF) of Germany for the SASKit study (FKZ 01ZX1903A). The funder had no role in the design of the study.
Competing interests UW reports personal fees from Ipsen Pharma, grants and personal fees from Merz Pharma, personal fees from Allergan, personal fees from Bristol-Myers Squibb, personal fees from Daiichi Sankyo, personal fees from Bayer Vital, personal fees from Boehringer Ingelheim, personal fees from Pfizer, personal fees from Thieme, and personal fees from Elsevier Press, all outside the submitted work. The other authors have nothing to disclose.
Patient consent for publication Not required.
Provenance and peer review Not commissioned; externally peer reviewed.