Article Text

Abstract
Introduction Bicycling is promoted as a transportation and population health strategy globally. Yet bicycling has low uptake in North America (1%–2% of trips) compared with European bicycling cities (15%–40% of trips) and shows marked sex and age trends. Safety concerns due to collisions with motor vehicles are primary barriers.
To attract the broader population to bicycling, many cities are making investments in bicycle infrastructure. These interventions hold promise for improving population health given the potential for increased physical activity and improved safety, but such outcomes have been largely unstudied. In 2016, the City of Victoria, Canada, committed to build a connected network of infrastructure that separates bicycles from motor vehicles, designed to attract people of ‘all ages and abilities’ to bicycling.
This natural experiment study examines the impacts of the City of Victoria’s investment in a bicycle network on active travel and safety outcomes. The specific objectives are to (1) estimate changes in active travel, perceived safety and bicycle safety incidents; (2) analyse spatial inequities in access to bicycle infrastructure and safety incidents; and (3) assess health-related economic benefits.
Methods and analysis The study is in three Canadian cities (intervention: Victoria; comparison: Kelowna, Halifax). We will administer population-based surveys in 2016, 2018 and 2021 (1000 people/city). The primary outcome is the proportion of people reporting bicycling. Secondary outcomes are perceived safety and bicycle safety incidents. Spatial analyses will compare the distribution of bicycle infrastructure and bicycle safety incidents across neighbourhoods and across time. We will also calculate the economic benefits of bicycling using WHO’s Health Economic Assessment Tool.
Ethics and dissemination This study received approval from the Simon Fraser University Office of Research Ethics (study no. 2016s0401). Findings will be disseminated via a website, presentations to stakeholders, at academic conferences and through peer-reviewed journal articles.
- natural experiment
- population health
- safety
- active transportation
- bicycling
This is an Open Access article distributed in accordance with the Creative Commons Attribution Non Commercial (CC BY-NC 4.0) license, which permits others to distribute, remix, adapt, build upon this work non-commercially, and license their derivative works on different terms, provided the original work is properly cited and the use is non-commercial. See: http://creativecommons.org/licenses/by-nc/4.0/
Statistics from Altmetric.com
Strengths and limitations of this study
This natural experiment study assesses impact using diverse methods, including population surveys, spatial analysis and health-related economic analysis.
The study is designed and conducted in partnership with intersectoral stakeholders, so as to inform research and practice on outstanding questions such as on ‘how much impact’ and ‘for whom’.
This study takes a unique focus on mid-sized cities, which may be more promising areas for change in bicycling due to shorter travel distances, as compared with larger urban centres.
The study will assess population-level impacts using repeat cross-sectional surveys, which will include both bicyclists and non-bicyclists.
There is a risk that the infrastructure intervention (the City of Victoria’s all ages and abilities bicycle network) will not be implemented as originally intended, or that similar infrastructure in control cities may be built during the study.
Introduction
Bicycling has been promoted as a transportation and population health strategy globally.1–3 As a form of physical activity, bicycling has the potential to reduce the risk for many of the chronic diseases of our time: heart disease, stroke, diabetes, dementia, certain cancers and depression.4 5 Perception of risks associated with bicycling is a deterring factor despite evidence that health benefits of bicycling outweigh risks, with estimates of median benefit-to-risk ratio of 9 (range: 2–360) in a recent review of 30 health impact studies.6
The potential for increasing active travel via bicycling is underscored by the difference in bicycling rates between North American cities and European cities with similar climates and demographics (1%–2% of trips vs 15%–40% of trips, respectively).7 8 Further, bicycling is an accessible transportation mode that provides mobility to individuals of all ages and economic circumstances. However, bicycling shows marked sex and age trends,7 9 with North American bicyclists typically being men, aged 20–40 years, which is in stark contrast to the even spread across age and sex for European bicyclists.7 10 North American and Australian research has also shown that bicycling rates, travel preferences and route choices vary by demographic characteristics (eg, women, parents with young children and older adults express more concerns about safety).11–13 There are also marked differences in safety outcomes, with higher bicycling injury rates for children, older adults and those with low income.9 14 15 Additionally, evidence from North America suggests bicycle infrastructure is sparse and typically in more advantaged areas.16 17
Growing evidence indicates that bicycle-specific infrastructure including off-street bike paths, residential bikeways and cycle tracks (facilities along major streets that physically separate bicycles from motor vehicles) offer substantial safety benefits and increase bicycling.18–20 This is a prevention approach with numerous benefits: it is population-based, rather than requiring individually oriented behaviour change initiatives; it is passive, rather than requiring active participation; and it is accomplished with a single action, rather than requiring repeated reinforcement.21 Of the bicycle-specific infrastructure types, cycle tracks may offer the most safety benefit.18 22 Further, bicycle-specific infrastructure also attract bicycling, as stated and revealed in preference studies indicating that bicyclists prefer separated routes and that inexperienced bicyclists, risk-averse individuals, women, people with children and younger bicyclists are less likely to ride where there is no infrastructure or poor separation.11 23 24 Thus, separated paths and protected lanes have been dubbed suitable for ‘all ages and abilities’. In addition to the independent impacts of bicycle facilities on both safety and bicycling, there is also evidence of a virtuous circle of interaction between them: cities with safer facilities attract more bicycling and cities with more bicycling are safer, a phenomenon referred to as ‘safety in numbers’.25 Reviews highlight that infrastructure investments are likely to be most effective if they are part of comprehensive packages involving engineering, education and enforcement.26 27
Transformations to urban form have potential to shift travel behaviour and impact population health and health equity. Leaders across transportation, planning and health are calling for rigorous assessments of such interventions,28 given the substantial investment required. There is a gap in knowledge related to the impact of interventions on population health (how much impact? for whom?) in domains that do not allow for randomisation or experimental control.29 As Petticrew et al indicate, in these realms, real-world, natural experiments “not only represent an important opportunity to collect information on effectiveness; they may also represent our best opportunity to collect evidence on the means of tackling health inequalities”.30
There has been limited evaluation of the population-level impacts of bicycle infrastructure interventions on ridership and safety outcomes. At this time, we are aware of only four natural experiment studies assessing the impacts of infrastructure on bicycling, all focusing on small changes (eg, a new bike lane) in large US cities.31–34 Reviews of the peer-reviewed literature assessing impacts of infrastructure on bicycling highlight the lack of well-designed prospective studies, particularly studies with comparison groups.28 34
We aim to examine an urban form transformation with potential to substantially increase bicycling in a mid-size Canadian city. We define mid-sized cities as a centre with a population of 50 000 to 500 000 and a population density of greater than 50/people km2, which includes about a third of all Canadian cities that are the home to about 6.8 million of the 35 million living in Canada. This natural experiment study addresses the gap in evidence on the impact of city-wide investments in bicycle infrastructure and employs diverse approaches (population surveys, spatial analysis and economic assessment) in response to the needs of intersectoral stakeholders who are partners in this research.
Methods and analysis
Study setting and aims
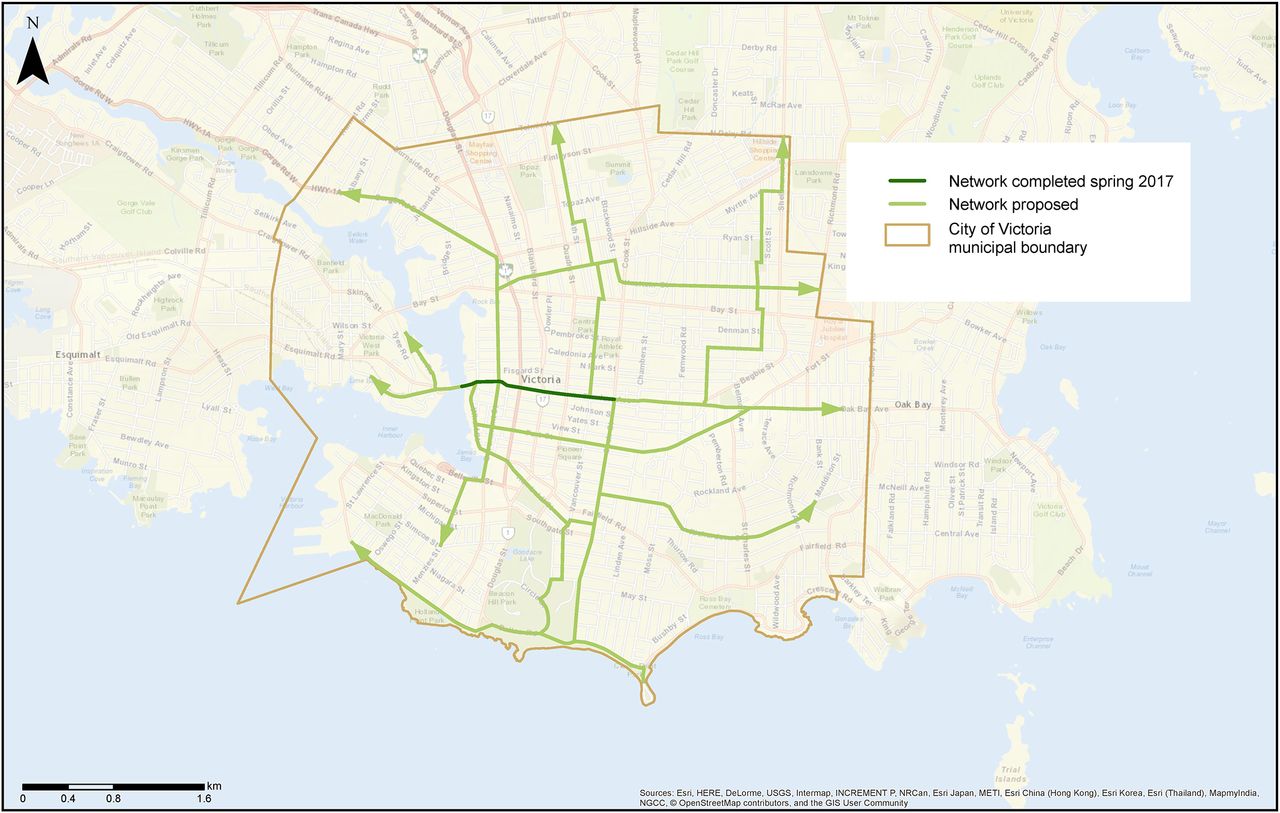
In 2015, the City of Victoria, British Columbia (BC), Canada, announced an investment to build a complete, connected network of bicycling infrastructure designed to attract bicyclists of all ages and abilities (AAA bicycle network) (figure 1). The City, along with the provincial government, have committed $C9 million to date. As of 2016, Victoria has 60 km of bicycle infrastructure, mainly on-street bike lanes.11 When complete, more than three quarters of Victoria’s land base will be within 400 m of an AAA bicycle facility, connecting every village centre with the downtown core. Construction is planned in several phases and the first protected bike lane opened 1 May 2017. Victoria is positioned to be a bicycling city (mild climate, moderate topography, compact density) and has ambitious targets: 25% of trips by bicycle, with a demographic that mirrors the population.35 The new corridors will consist of fully protected on-street facilities as well as shared road facilities. Research has shown the cyclists are willing to detour up to 400 m to ride on infrastructure.36

All ages and abilities active transportation network, city of Victoria, BC.
Impacts of Bicycle Infrastructure in Mid-Sized Cities (IBIMS) is a natural experiment study that examines the impact of the City of Victoria’s AAA bicycle network investment on active travel and safety outcomes. The specific objectives are to (1) estimate the impact of the intervention on changes in the use of active travel, perceived safety and bicycle safety incidents, at the population level and across demographic groups; (2) analyse the impact on spatial inequities in access to bicycle infrastructure and bicycle safety incidents across neighbourhoods; and (3) assess the health-related economic benefits of the intervention.
Study design
We use a quasi-experimental non-equivalent groups design with data collection in three mid-sized cities.37 Victoria, BC, is the intervention city (population: city 80 000, density: 4109 people/km2, bicycling mode share: 11.5%38 in 2011). Based on regional travel patterns and geographic scope, we have included adjacent municipalities of Esquimalt, Oak Bay and Saanich for the Victoria site (combined population 140 000). In observational studies, there is never a perfect comparison site. As such, we use two comparison cities: Kelowna, BC, and Halifax, Nova Scotia. These were selected based on size, urban layout and climate, as well as input from local governments indicating that these were ‘peer’ cities. Kelowna (population: 197 60038) is located in Interior BC, falls under the same provincial jurisdiction and has an urban core surrounded by lower density areas, similar to Victoria. Halifax is a regional municipality, but the metropolitan core (Peninsula, Mainland and Dartmouth) is a suitable comparator (population: 198 00038) to Victoria and adjacent municipalities. Both Halifax and Victoria are provincial capitals, coastal settings and share more moderate climates relative to other Canadian cities. Kelowna, although not on the ocean, also experiences climate moderation from being located along a large lake (Lake Okanagan, 361 km2).39
Our study area boundaries were defined in collaboration with partners in each city. To capture the function of the transportation network in mid-size cities, we were required to consider adjacent jurisdictions as most people live, work and move across multiple regions. We discussed with study partners which areas would likely be affected by current and planned bicycle infrastructure. Through this process were we able to select study boundaries for each city that made sense in local context, rather than reliance on conventional administrative boundaries. For Victoria, our study area included the adjacent municipalities of Esquimalt, Oak Bay and Saanich, as many residents in these municipalities travel into Victoria for daily activities. The planned network will connect directly into these municipalities. In Kelowna, the study area was the City of Kelowna proper. West Kelowna, the adjacent municipality, is separated by a lake and the bridge connecting the two is long and used almost exclusively by cars—and thus was not included. For Halifax, we included the downtown peninsula, mainland Halifax and Dartmouth and excluded the many rural areas within the Halifax Regional Municipality administrative boundary.
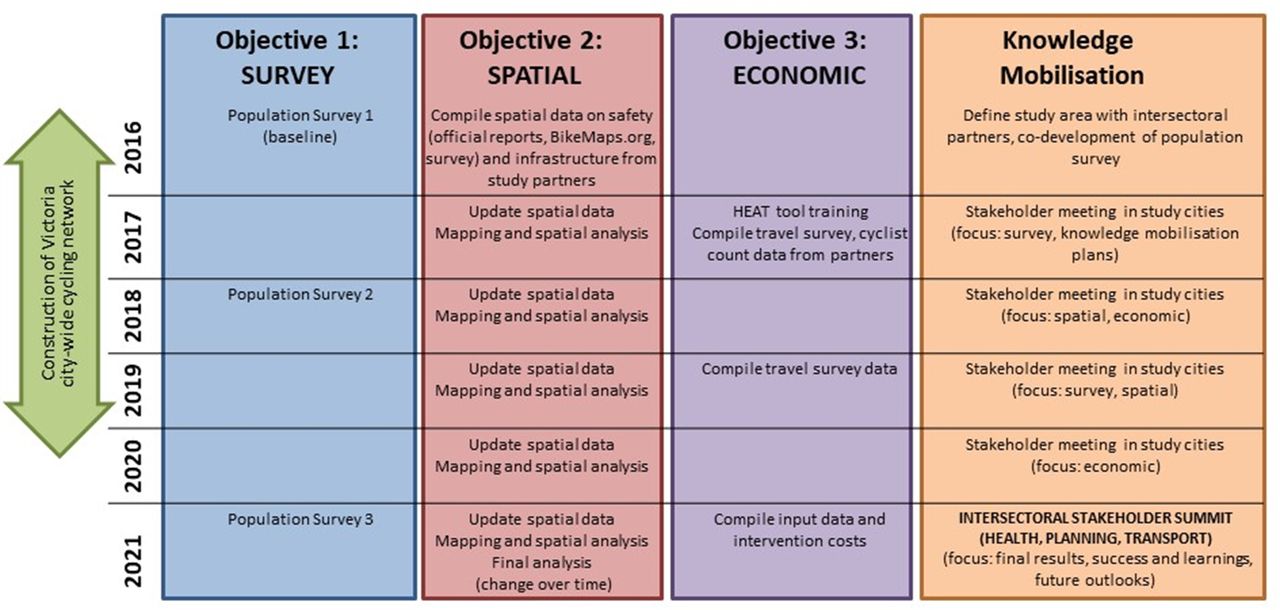
Aligned with the three specific objectives of the study, we will undertake population surveys, spatial analysis and economic analysis over the course of the 5 years (figure 2). Using an integrated knowledge translation approach, this study was designed to be conducted together in close consultation with intersectoral stakeholders (regional health authorities, local governments, cycling advocacy groups and other non-governmental organisations). At the design stage, stakeholders provided input on the study area, the survey questions and local administrative data. Throughout the study, we are connecting with stakeholders at least quarterly to share progress and findings and will visit each city annually. To date, these events have included diverse presentations to the general public as well as more intimate discussion with location and provincial government and advisory bodies. The IBIMS website (www.sfu.ca/ibims) has been created as a growing repository of our knowledge translation products, in response to stakeholder needs.

Impacts of Bicycle Infrastructure in Mid-Sized Cities study activities. HEAT, Health Economic Assessment Tool.
A recent review of the risk of bias in natural experiment studies highlights the importance of rigour and transparency in research in this domain.40 In natural experiment studies where the implementation of the intervention is outside of the control of the researchers, timing and enactment are inherent risks.34 40 Infrastructure changes may be completed in phases (as in Victoria) rather than an abrupt change. Throughout this study, we will continually collect data on cycling infrastructure and map these changes across time. Additionally, real-world interventions are not always implemented as intended. For political reasons, budgetary reasons or other, changes may be delayed or modified, which can impact the suitability of a study design. We have established strong relationships in each study city such that we will be able to respond to delays or changes. If design plans change and less desirable route types are built (eg, on-street bike lanes), cycling uptake may be lower among less confident cyclists. It is also possible that comparison cities will build high-quality cycling facilities during the project.
Population surveys—sampling
The study includes repeat cross-sectional surveys in fall 2016, 2018 and 2021, season-matched to control for variation in travel. We will recruit a random sample of adults (>18 years) using a landline telephone list supplemented with cellphone random-digit dialling, applying age and sex quotas. We will recruit 1000 residents/city/year. We used G*Power to estimate that ~700 residents/city/year provides 80% power to detect small changes (2%) in the mean difference in outcomes (eg, percent who bicycled) between cities with α=0.05 and a SD of 15% in the percent who bicycled (ie, a Cohen’s d of 0.17).41 The percentage of people cycling in the past year in the study cities is 35%–50% and the ability to detect small changes is crucial.
Population surveys— questionnaire
The questionnaire (online supplementary file) includes questions related to travel behaviour and physical activity, bicycling behaviours, motivators and deterrents to bicycling, bicycle safety incidents and demographics. Questions were derived from our own and others’ previous surveys and were selected with input from partners. We use a travel diary to capture trip purpose, mode and travel time for all trips made in the previous day. We also ask about leisure and work-related physical activity to measure total physical activity to address potential substitution effects. We ask questions regarding bicycling frequency (≥1/week, ≥1/month, ≥1 year, never11), confidence and comfort,42 and attitudes towards bicycling. Questions regarding perceptions of bicycling safety and the influence of key factors to bicycling (cost, location, facilities, safety, legislation, climate, etc) are based on previous studies.43 We also ask respondents to report details of bicycle safety incidents within the past 3 months, including location, injury severity and reporting (insurance, police, other).44 45 Demographic questions include age, gender, employment, income, education, ethnicity, access to a car, bicycle ownership, household characteristics and home and work/school postal code, using items from the Canadian Community Health Survey.46
Supplementary file 1
Early discussions with our municipal study partners indicated that it was crucial to identify routes used by bicyclists, before and after infrastructure changes, to indicate changes in route choices and mode shifts, as well as public awareness and support for infrastructure changes. As such, we worked with municipal staff in each city to identify corridors where infrastructure changes were expected within the study period and created city-specific questions to assess current route choices (if respondents currently use any of the identified corridors), awareness (if respondents had heard of any bicycle infrastructure plans), attitudes (if respondents thought building more bicycle infrastructure was a good or bad idea) and likelihood for behaviour change (if respondents would bicycle more in the future if more bicycle infrastructure was built). As the wording varies slightly depending on local initiatives, these questions would not be directly compared across cities; however, such population-level data on public awareness and support are important for political decision-making locally.
Population surveys— weighting
Survey weights will be applied to the survey data in order to adjust for potential differences between the survey sample and the population.47 Weights will be calculated by comparing the age and sex distribution in the sample to the age and sex distribution of the relevant study area derived from Census data.48
Population surveys— analysis
Our primary outcome will be the proportion of the population that reports any bicycling in the past year. We will also conduct and subanalyses for frequency of bicycling (eg, weekly bicycling). Secondary outcomes include the proportion that report their city as safe for bicycling and the proportion that report a bicycle safety incident (collision or fall) in the past 3 months.
In order to model associations between the bicycle infrastructure and any differential changes in outcomes over time, the analysis will use a difference-in-differences approach. The difference-in-differences technique is commonly used for evaluating outcomes of natural experiments in economics49 and one that we have used previously.50 This compares the change over time in the outcome (eg, percent bicycling) in the intervention city with the change observed in comparison cities. It accounts for unmeasured confounders and historical trends that do not differ between the intervention and comparison cities, which can be important biases in quasi-experimental studies. We will create multivariable regression models for each dependent variable, using either logistic (for dichotomous data, eg, reporting a collision) or negative binomial (for count data, eg, minutes of bicycling) models, where appropriate. To test whether a change in the outcomes of interest can be attributed to the intervention, all models will have independent effects from time (survey year), treatment (intervention or comparison city) and an interaction term (time ×treatment). A significant interaction will indicate that the intervention is associated with a differential change in the outcome. Other covariates (eg, age, sex, employment, income, education, ethnicity, access to a car, bicycle ownership and population density) will be included to control for potential confounding. We will also examine whether the change is greater in specific subgroups by conducting stratified analyses, heeding cautions to prespecify subgroups.51 Given the rationale for all ages and abilities, we will run stratified analyses by sex, age (<35, 35–54, >55) and people with children under the age of 18 living at home.
Population surveys— baseline data collection
We engaged a market research firm to administer a telephone survey in the three cities. Survey programming was led by this firm and pilot testing by the research team. Screening questions included age, sex and municipality of residence (as per list above). We used Census-based age and sex quotas.
Survey administration occurred from 19 to 31 October 2016. The survey was voluntary and no incentive was provided. Overall, 80% of the participants were reached contacted on cell phones and 20% on landlines, reassuring results for telephone surveys in this era of research as landlines decrease in popularity. Age and sex quotas were reached and sampling weights varied from a low of 0.68 (men aged 65–74 years) to 1.79 (women 75 years or older). The cooperation rate (completed surveys/completed surveys+refusals) was 15.7% overall (14.9% in Victoria, 13.6% in Kelowna, 19.8% in Halifax). For each city, we calculated poststratification weights based on age and sex. Participant characteristics by city and primary and secondary outcomes are in table 1. There were significant differences between cities in transportation behaviours (primary mode of transport, bicycle use in the past 12 months, frequency of bicycle use) and perceptions of safety at baseline (2016). However, given that IBIMS is interested in change over time (through difference-in-differences analysis), baseline differences are interesting context but not problematic.
Characteristics of respondents* for 2016 survey of the Impacts of Bicycle Infrastructure in Mid-Sized Cities study
Our baseline data collection provided insights on the challenges of geographically based sampling. As a screening question, we asked respondents ‘in which municipality do you live in?’ and only those providing a response options that matched the municipalities and/or neighbourhoods within the study area boundaries were invited to participate. Within the demographic section of the survey, we also asked the location of their home and primary place of work (postal code or cross streets) to enable geographic analyses. When we geolocated each respondents’ home and work location and compared it with the study area boundaries (figure 3), we found that a fifth of respondents neither lived nor worked within the boundaries despite their saying so in screening questions (23.4%, 17.6% and 15.7% of the sample from Halifax, Kelowna and Victoria, respectively). Our analyses will exclude these participants as they do not meet geographic-based inclusion criteria. For future studies, our experience suggests the importance of screening by specific geographic data (address or postal-code based), although asking personal information may be a deterrent to participation. Alternatively, address or postal-code data should be gathered, mapped and applied as a filter to the dataset. This approach may require oversampling.

Survey respondents’ home locations geocoded by valid postal codes, address or cross-streets for (A) Victoria, (B) Kelowna and (C) Halifax.
Spatial access
Equity impacts of active transportation planning and policy are often overlooked, leading to disparities in who benefits.52 Our second set of objectives are to assess how access to bicycle infrastructure changes with the investment (how much change?) as well as equity in access to the infrastructure (which types of neighbourhoods is it in?). To provide context about equity in access and safety, we examine the outcomes of spatial access to bicycle infrastructure and local bicycling risk (actual and perceived) across area-level equity indicators.
Spatial access—data
To track the implementation of bicycle infrastructure over time, spatial data on bicycle infrastructure will be compiled for each city annually. In order to measure access to infrastructure across the intervention and control cities, bicycle infrastructure data must be standardised. Spatial data on bicycle infrastructure tend to be managed by local and regional governments. Data formats, frequency of updates and categorisation of bicycling-specific infrastructure vary by city. In this study, we are applying standard categories developed in a previous study across Canadian and US cities.53 We will work in concert with municipal staff in each of our study cities to ensure accurate and consistent categorisation of infrastructure across study cities and to capture changes to urban form over the course of the study. We are also conducting analyses to examine whether bicycling data from OpenStreetMap,54 a crowdsource project to create and maintain global street mapping data, is valid relative to data maintained by local and regional governments. We are aware of only one study on OpenStreetMap data in US cities55 and expect validity may vary spatially given the different user base.
For safety outcomes, we will integrate geolocated bicycle safety incident data from three sources: (1) the population survey, (2) official insurance or police reports, and (3) citizen-contributed data from BikeMaps.org, a web-based global mapping tool for bicycling safety developed by our team.56 The use of multiple data sources addresses the issue that there are differences in bicycle safety incident reporting systems across settings. In BC, the Insurance Corporation of British Columbia (ICBC) is the primary source of road safety data provincially. Through this source, Victoria and Kelowna will have comparable data. In Nova Scotia, however, the official source of road safety data is police reports. We do not know how comparable reporting practices are to insurance records and police reports. ICBC captures only bicycle–motor vehicle crashes, not single-bicycle crashes, or crashes with pedestrians or with infrastructure. Police reports typically over-represent bicycle crashes that involve motor vehicles.45 57 Past analyses show that both insurance and police reports only capture a small proportion of bicycling crashes that occur and that these are the crashes that result in more severe injuries.45 57 58 Given there is not a single complete source of bicycle safety incident data, we will also gather incident data through the survey and draw on citizen-science data collection efforts through BikeMaps.org.
In order to measure equity, we will use area-level indicators from the Census (2016, 2021 (pending release); eg, median income) and the Pampalon Material Deprivation Index (derived from Census data on education, employment and income),59 which has been widely used in research and policy settings on inequities.
Spatial access—analysis
We will access spatial outcomes at baseline in 2016 in each city and then assess change over the study period annually. We will use dissemination areas as the spatial unit, the smallest area with Census data. To test whether bicycle infrastructure and bicycling investment vary based on deprivation, we will run city-specific multivariable regression models to determine associations between bicycle infrastructure access and area-level equity indicators at each time point. Normalised metrics for bicycle infrastructure (distance/area) will be calculated for all bicycle infrastructure and separately by type (off-street paths, signed bike route, bike lanes and cycle tracks). To model change over time, we will model the change in access for each dissemination area and, where appropriate (ie, where there is a change), the respective association with area-level equity indicators. To test whether bicycle safety incidents vary based on deprivation, we will model associations between safety and area-level equity indicators in each city. We will also generate maps to visualise the bicycle infrastructure investment (access) and bicycling safety across area-level equity indicators (quintiles).
Exposure is critical to studying risk,28 yet there is no spatially resolved ridership data. In this project, we will aim to draw on available data, including commute mode from the National Household Survey,60 Strava61 and bicyclist count programme and origin–destination surveys conducted by municipal and regional partners in our study cities. These will provide estimates of bicycling volumes to track change over time and contextualise safety trends.
Economic analysis
Formal assessments of economic costs and benefits are critical to decision-makers in all areas of policy and planning.28 To meet this need, our third objective is to evaluate the health-related economic impact of the bicycle infrastructure investment at baseline (2016) in each city and the value of changes in bicycling across the study period (2016–2021). We will use WHO’s Health Economic Assessment Tool (HEAT) to quantify the economic value of the health benefits that result from the reduction of mortality associated with bicycling (mortality rate) and a value of a statistical life.62 63 HEAT is a user-friendly tool that has been widely used in Europe and by health authorities and consultants in North American cities.6 64 HEAT can be used to assess current benefits (ie, at a single point in time) or the value of a change in circumstance (ie, resulting from an intervention). We will use the travel diary component of our survey as inputs to the tool, as well as data from our city and regional partners’ origin–destination surveys, following the methodology outlined in the HEAT User Guide.62 Sensitivity analyses will be used to explore the robustness of the study findings to different future scenarios and to variations in the key inputs.62 64
Study contributions and limitations
Findings from IBIMS will provide evidence to inform decision-making on public investment in active transportation in mid-sized cities. This is an applied public health study, designed in partnership with intersectoral stakeholders, so as to generate the data and evidence they need to answer questions on ‘how much impact’ and ‘for whom’. Our focus on mid-sized cities is unique. The vast majority of research has focused on large urban centres and may not be generalisable to other settings. Few mid-sized cities have substantial bicycling infrastructure, but short travel distances make them promising areas for change. Evidence from such cities is needed to inform investments that promote active travel and subsequently the health of populations.
Natural experiment studies such as IBIMS are enabled by relationships beyond academia. Members of the IBIMS team began working with the City of Victoria through a citizen-science project on cycling safety, and this created the opportunity to design the applied research on the bicycle network investment. The development of the research protocol cemented relationships and initiated new relationships with stakeholders in the study cities. These conversations were critical to understand the policy and planning context in each city, in cycling infrastructure but also sustainable mobility more generally.
Pragmatic evaluations will always have resource limitations, and by design, IBIMS focuses on population-level impacts using surveys and administrative data. IBIMS uses repeat cross-sectional surveys that are suitable for the aim to study population-wide change. They provide some advantages over cohort studies,65 as they not subject to loss to follow-up and allow for sampling of both bicyclists and non-bicyclists. One strength of the repeat cross-sectional design assumes that the sample is representative of the population. Using cell phone sampling, age and sex quotas and weighting improves our population representativeness. While our response rates were moderate, we achieved age and sex targets, and 80% of participants were contacted on cell phones. However, limitations inherent to telephone surveys include that certain populations not owning cellular or landline phones would be included. In practice, working with a market research firm for sampling also meant we were not able to follow a cohort over time. Depending on the size of the effect and of the various strata, it is possible our study will be underpowered for subgroup analysis examining social inequalities.51 To limit the length of the survey, we did not ask specifically about children’s trips, although the planned cycling infrastructure should be suited for all ages and abilities. Likewise, the survey asks about collisions and falls but not near misses. IBIMS uses self-report data, but in a complementary study (INTErventions, Research and Action in Cities Team, INTERACT66), we have recruited a cohort of cyclists and are using mobile sensing (mobile apps, GPS/accelerometry) to capture route choices and how these may change as infrastructure is built.
Although economic and cost analyses are needed by decision-makers, such studies face considerable challenges. With the assistance of our municipal partners, we aim to record the total costs associated with bicycle infrastructure investment over the study period, including planning, design and construction. However, these costs will certainly only be estimates. In practice, total investment will be difficult to accurately identify because costs are often distributed across multiple budgets and departments within the local government, while other costs may be external to local governments (eg, volunteer-based bicycling count programme, bicycling promotion events) and difficult to value. For the assessment of economic benefits in this study, we focus only on the quantification of benefits through the HEAT. Limitations of the HEAT tool include that it measures health outcomes based solely on all-cause mortality and it is applicable to adult populations only. Models such as the Integrated Transport and Health Impact Modelling Tool67 explicitly model physical activity benefits against air pollution and injury risk and generate age-specific and sex-specific impacts in terms of disability-adjusted life-years, but such tools require much more detailed data inputs. Finally, there are also economic impacts outside of health. Some consultants and municipalities have focused on business-related impacts of new bicycle infrastructure, in response to public concerns.68 69 Such studies require different methods and address a research question that is not within the scope of our study.
Ethics and dissemination
Survey participants provide consent to participate at the beginning of the telephone survey. No participant names were collected. Within the analytic dataset participants are only identified by study ID. Aggregate data are presented in reports and shared with partners. Our dissemination activities will include a website, blog posts, public outreach (facilitated through intersectoral partners) and dissemination to the academic and practitioner community through conference presentation and publications.
Acknowledgments
We acknowledge Jaimy Fischer for geocoding and mapping supporting this work. We also acknowledge partners at Vancouver Island Health Authority, the City of Victoria, the Capital Regional District, the City of Kelowna and the Halifax Regional Municipality for informing the design of this study protocol and sharing spatial data on bicycle infrastructure.
References
Footnotes
Contributors MW, MB-C, DF, LG, DGTW and TN all contributed to the development of this protocol. ST manages this study and MB-C has contributed to data analysis. All authors read and contributed to the final manuscript.
Funding This study was funded by the Canadian Institutes of Health Research (Awards #365011 and #377333).
Competing interests None declared.
Patient consent Obtained.
Ethics approval This study received ethical approval from the Simon Fraser University Office of Research Ethics (study no. 2016s0401, minimal risk).
Provenance and peer review Not commissioned; externally peer reviewed.
Data sharing statement Original participant data are protected as per ethics board guidance. Aggregate results will be published and shared with the academic audiences, stakeholders and the public.