Article Text

Abstract
Background Pandemics often precipitate declines in essential health service utilisation, which can ultimately kill more people than the disease outbreak itself. There is some evidence, however, that the presence of adequately supported community health workers (CHWs), that is, financially remunerated, trained, supplied and supervised in line with WHO guidelines, may blunt the impact of health system shocks. Yet, adequate support for CHWs is often missing or uneven across countries. This study assesses whether adequately supported CHWs can maintain the continuity of essential community-based health service provision during the COVID-19 pandemic.
Methods Interrupted time series analysis. Monthly routine data from 27 districts across four countries in sub-Saharan Africa were extracted from CHW and facility reports for the period January 2018–June 2021. Descriptive analysis, null hypothesis testing, and segmented regression analysis were used to assess the presence and magnitude of a possible disruption in care utilisation after the earliest reported cases of COVID-19.
Results CHWs across all sites were supported in line with the WHO Guideline and received COVID-19 adapted protocols, training and personal protective equipment within 45 days after the first case in each country. We found no disruptions to the coverage of proactive household visits or integrated community case management (iCCM) assessments provided by these prepared and protected CHWs, as well as no disruptions to the speed with which iCCM was received, pregnancies were registered or postnatal care received.
Conclusion CHWs who were equipped and prepared for the pandemic were able to maintain speed and coverage of community-delivered care during the pandemic period. Given that the majority of CHWs globally remain unpaid and largely unsupported, this paper suggests that the opportunity cost of not professionalising CHWs may be larger than previously estimated, particularly in light of the inevitability of future pandemics.
- COVID-19
- Health policy
- Community child health
Data availability statement
No data are available. The data that support the findings of this study are available from Ministries of Health in Kenya, Malawi, Mali and Uganda. Restrictions apply to the availability of these data, which were used under licence for this study.
This is an open access article distributed in accordance with the Creative Commons Attribution Non Commercial (CC BY-NC 4.0) license, which permits others to distribute, remix, adapt, build upon this work non-commercially, and license their derivative works on different terms, provided the original work is properly cited, appropriate credit is given, any changes made indicated, and the use is non-commercial. See: http://creativecommons.org/licenses/by-nc/4.0/.
Statistics from Altmetric.com
Strengths and limitations of this study
This study directly assesses the presence and magnitude of a possible disruption in care utilisation at the community level since the onset of COVID-19 in 27 districts across four countries in sub-Saharan Africa employing the intrinsic advantages of routine monthly data: high coverage and frequent observations over extended periods (January 2018–June 2021).
The study is an interrupted time series analysis, the strongest and most commonly employed quasi-experimental design in cases where randomisation is not feasible.
Given that the analysis does not include exhaustive data from health facilities, it is only a partial picture of overall changes to service delivery.
Likewise, while this analysis provides critical insight into the role community health workers (CHWs) played in continuing essential services and supporting the health of their communities during the pandemic, these services alone do not capture the full impact of the work done by all community-based cadres.
Given the ongoing COVID-19 pandemic, inevitability of future pandemics, and reality that the majority of CHWs globally remain unpaid and largely unsupported, the findings of this analysis are timely.
Background
Pandemics often precipitate declines in essential health service utilisation, which can ultimately kill more people than the disease outbreak itself. Meta-analysis indicates that during the 2013–2016 West African Ebola outbreak, healthcare utilisation declined 18%.1 Similar results were observed during the 2003 severe acute respiratory syndrome epidemic: ambulatory care in Taiwan decreased by 23.9%.2 Disruptions in health utilisation and child well-being have already been captured during COVID-19.3–5 Declines in the delivery of essential health services threaten global progress towards Sustainable Development Goals to reduce morbidity and mortality.6
In the context of a pandemic, changes in access to essential health services may be driven by several forces. On the supply side: a depleted health workforce,7 resource reallocation to the pandemic response8 or strained supply chains9; on the demand side: lockdowns or other mobility restrictions,10 financial pressure/loss of insurance11 and fear.12
Community health workers (CHWs) have long been heralded as an integral part of primary healthcare (PHC) strategies and of the health system.13 There is some evidence that the presence of adequately supported CHWs—lay workers trained to provide promotive, preventative and curative medical care to their neighbours—may blunt the impact of health system shocks.14 Yet, adequate support for their work (eg, as outlined in the WHO CHW Guideline: financial remuneration commensurate with job demands, ongoing training, regular performance evaluation, adequate supplies, etc) is often missing or uneven across countries.15 This study assesses whether adequately supported CHWs can support the continuity of essential health services during the COVID-19 pandemic.
Methods
Intermittent community surveys continue to be the ‘gold standard’ for assessing health service utilisation despite their high cost and low frequency. Routine data collected as part of programmatic care delivery are often overlooked for evaluating causal effects of health programmes due to concerns regarding ‘completeness, timeliness, representativeness and accuracy’ particularly when collected by CHWs.16 17
In cases where data are available and quality is assured via strong data management (eg, use of electronic data systems and quality control measures), however, the intrinsic features of routine data (high coverage, frequent observations over extended periods) allow for robust evaluations of health service delivery.18
We used quality-assured routine data to analyse community healthcare utilisation in 27 districts across four countries in sub-Saharan Africa 26 months prior to and 15 months during the COVID-19 pandemic. Data were reported following the Framework for Enhanced Reporting of Interrupted Time Series (FERITS) reporting guideline for interrupted time series studies.19
Study population
Routine CHW programme data were regularly pooled as part of a quality improvement project undertaken by members of the Community Health Impact Coalition, a multicountry network of health practitioners that exists to accelerate the uptake of high-impact community health systems design.20 We pooled aggregate monthly data extracted from CHW and facility reports from January 2018 to June 2021 (ie, the full time series).
All sites participating in the quality improvement project were eligible for inclusion in the study; sites self-excluded based on bandwidth to participate in the research study (ie, non-probability-based sampling). Data collection varied slightly in collection methods and scope across regions and is summarised in table 1.
Data collection and quality assurance at each site
Measures
Continuity of services
This study seeks to establish whether adequately supported CHW programmes supported the continuity of essential health services during the COVID-19 pandemic. Multiple metrics of service utilisation were chosen to (1) obtain balance across speed and coverage and (2) be indicative of a broad swath of CHW PHC activities across sites (ie, maternal, neonatal and child health). Given that catch-up campaigns are not possible for these maternal and child health interventions, metrics capturing delivery of these services were the focus for our analysis (table 2).
Metrics included in the analysis
Preparedness and protection
In order to contextualise the findings about continuity of services, we also collected data on CHW programme implementation. The degree to which CHWs were supported in line with WHO Guidelines was captured via programme self-assessment using the Community Health Worker Assessment and Improvement Matrix (CHW AIM): Updated Program Functionality Matrix for Optimizing Community Health Programs,21 an evidence-based tool to identify design and implementation gaps in CHW programmes.
The degree to which CHWs were prepared and protected to respond to COVID-19 was captured via COVID-19-related metrics extracted from CHW monthly summary reports (table 3).
COVID-19-related metrics
Analysis
Descriptive analysis, null hypothesis testing, and segmented linear regression analysis were used to assess the presence and magnitude of a possible disruption in care utilisation after the earliest reported cases of COVID-19.
Descriptive analysis
The monthly reported PHC data were first graphed for each metric across all sites. All metrics were calculated as proportions in order to avoid confounding with programme size. While the number of children under 5 assessments was initially reported as a count, the study team converted the metric to a proportion using the number of registered households in the catchment area as the denominator.22 The trend in the indicator data for 2018, 2019, 2020 and 2021, including any possible seasonal patterns, was described using descriptive statistics and limited to reported data for each month since January 2018 or the start of data reporting.
Testing the null hypothesis
The study team intended to compare data from the 26-month period before March 2020 and the 15-month period after March 2020. These time periods were selected because March coincided with the first cases of the COVID-19 pandemic in most regions as well as the start of lockdowns and January 2018–July 2021 were the months for which data were available. The magnitude and direction of the difference were assessed using the Wilcoxon signed-rank test.
Modelling disruption
The particular characteristics of time-series data—non-stationarity, seasonality and auto-correlation—mean it is not sufficient to compare average utilisation data before and during the pandemic.23 The risks arising from these specific properties were accounted for by using a segmented regression analysis.24
Monthly PHC data from January 2018 to February 2020 were used as a baseline against which to compare utilisation rates for April–June 2021. The segmented linear regression model was:

Where Yt is the outcome variable at time t; time (in months) is a continuous variable indicating time from January 2018 up to June 2021, the end of the period of observation. Pandemic (ie, the COVID-19 pandemic) is coded 0 for pre-pandemic time points and 1 for post-pandemic time points, with March 2020 as null, while postslope is coded 0 up to the last point before the pandemic phase and coded sequentially thereafter. β0 captures the baseline level of the outcome at time 0 (January 2018, beginning of the period); β1 estimates the structural trend or growth rate in utilisation, independently from the pandemic; β2 estimates the immediate impact of the pandemic or the change in level in the outcomes of interest after the start of the pandemic; and β3 reflects the change in trend, or growth rate in outcome, after the start of the pandemic.24 Region is a dummy variable for each of the five regions. The analysis relies on the assumption that the flexibly modelled trends observed before March 2020 would have persisted in the absence of the pandemic.
Auto-correlation was controlled by performing a Durbin-Watson test to test the presence of first-order auto-correlation and because auto-correlation was detected, using the Prais-Winsten generalised least squares estimator to estimate the regression coefficients.
Given that the WHO declared COVID-19 a global pandemic in mid-March (11 March 2020), sensitivity analysis was conducted in which the month of March 2020 was coded as post, rather than null.
Data management and confidentiality
Data were analysed using R V.4.0.3 and RStudio V.1.3.1093. No individual-level or identifiable patient data were used. Nonetheless, a Health Insurance Portability and Accountability Act (HIPAA)-compliant database and cloud-based data transfer processes were used.
Patient and public involvement
Patients or the public were not involved in the design, or conduct, or reporting, or dissemination plans of our research.
Results
Sample characteristics
Twenty-seven sites across four countries in sub-Saharan Africa participated in the study. Data were collected from 5 districts in Western and Central Kenya, 1 district in Southern Kenya, 19 districts across Central-Eastern Uganda, 1 district in the capital region of Mali and 1 district in Malawi (table 4). The sites had a total catchment population >5.2 million served by 7845 CHWs. The catchment area population of each site varied from 85 000 to 3.5 million. The CHW to population ratio ranged from ~1:200–900, reflecting differences in local geography, transport availability and cost, and other factors noted in the WHO Guideline and CHW AIM tool.15 21 Each country included in the analysis had its index case of COVID-19 in March 2020, save Malawi (table 4).
Site profiles
Preparedness and protection
Sites self-assessed the level of functionality of different CHW programme components using the evidence-based CHW AIM tool. Across all sites included in this study, CHWs are generally supported in line with the WHO CHW Guideline in that they receive fair pay, ongoing training, supportive supervision and adequate supplies (see online supplemental table 1).25
Supplemental material
Within 45 days of the first case in their country, all CHWs’ service delivery protocols and accompanying data collection tools were adapted to the COVID-19 context (see table 5 for a list of protocol modifications) and CHWs at each region received training on COVID-19 (including: how COVID-19 spreads; common symptoms; how to protect themselves; how to talk with community members about COVID-19; and roles they will take in combating the spread of the virus, including protocol additions and modifications). The vast majority of CHWs (>85%) received personal protective equipment (PPE) in the first 45 days and nearly all CHWs were equipped with PPE for the duration of the pandemic period. There were no CHW deaths reported (table 6 and online supplemental table 2).
Mobility restrictions and COVID-19 service adaptations across five sites
COVID-19 preparedness across sites
Descriptive analysis
Figure 1 shows the fluctuation in the monthly values for each of the six PHC indicators from January 2018 to June 2021.

Descriptive trends in PHC metrics by month, January 2018–June 2021. PHC, primary healthcare; PNC, postnatal care.
The graph indicates the per cent of deliveries at a health facility (deliveries coverage) and per cent of women with home delivery receiving first postnatal care (PNC) visit within 48 hours of delivery (PNC Speed) were largely consistent over time. The ratio of assessments of children under 5 to households registered in the CHW catchment area (U5 Coverage) improved until early 2019 at which point it remained largely consistent over the period under study until a slight drop in June of 2021. The per cent of households visited at least one time per month (where family was home—Proactive Coverage) also increased over the examination period before a slight drop in June 2021, while the per cent of pregnancies registered in first trimester (Pregnancy Speed) and per cent of children under 5 assessed with a symptom of malaria, diarrhoea or pneumonia, within 24 hours of symptom onset (iCCM Speed) experienced a slight drop in the second quarter of 2020 before quickly rebounding to their previous highs. The study team also examined quarterly trends across metrics and sites, which yielded similar insights to those outlined above (see online supplemental table 3 for mean values for all metrics by quarter, online supplemental table 4 for descriptive trends in numerator and denominator by metric and month, online supplemental table 5 and online supplemental table 6 for data coverage for PHC and COVID-19 metrics, and online supplemental figures 1 and 2 for visualised trends by quarter and month for PH and COVID-19, respectively).
Null hypothesis testing
Five of the six metrics were not significantly different in the pre-pandemic (January 2018–February 2020) and pandemic (April 2020–June 2021) periods. Proactive coverage statistically significantly improved compared with the period before the pandemic (table 7 and figure 2).
Results of null hypothesis testing

Box plots for PHC metrics, before and during COVID-19 from January 2018 to June 2021, metrics 1–6. PHC, primary healthcare; PNC, postnatal care.
Modelling disruption
Table 8 illustrates that no immediate negative effect of the pandemic was identified across any of the metrics included in the analysis (β2 p>0.05, see also online supplemental figure 3). For one metric, iCCM Speed, the growth rate in outcome declined slightly following the pandemic (β3=−0.69). This indicates that the per cent of children under 5 assessed with a symptom of malaria, diarrhoea or pneumonia, within 24 hours of symptom, decreased faster during the pandemic than before the pandemic, though by less than 1% per month.
Results of regression, including estimates, SE and p values across six metrics
Three alternative, exploratory regression models were run for the purpose of sensitivity analysis in which the model above was modified by: (1) removing the region term, (2) adding a preslope term and (3) adding a year term, respectively (see online supplemental tables 7 and 9, figures 4–6). Given some variability across regions, the region term was ultimately retained in the final model, whereas the preslope and year terms were excluded in favour of capturing the secular trend with a simple time variable (β1). In any case, like the model above, none of these three alternative models found a significant immediate negative effect of the pandemic on the community health services assessed.
Discussion
CHWs supported in line with the WHO Guidelines (eg, paid, in-stock, consistently supervised) and consistently equipped with PPE were able to maintain continuity of community-based maternal and child health services across five regions in sub-Saharan Africa during the COVID-19 pandemic. While pandemics often cause severe disruptions to health service provision, we found no disruptions to the speed and coverage of community-based iCCM assessments, proportion of women receiving timely pregnancy registration and PNC, or the coverage of facility-based deliveries or proactive, monthly household visits. These results indicate that health systems with well-supported CHWs who were equipped and prepared for the pandemic were able to maintain speed and coverage of community-delivered care, even during a pandemic.
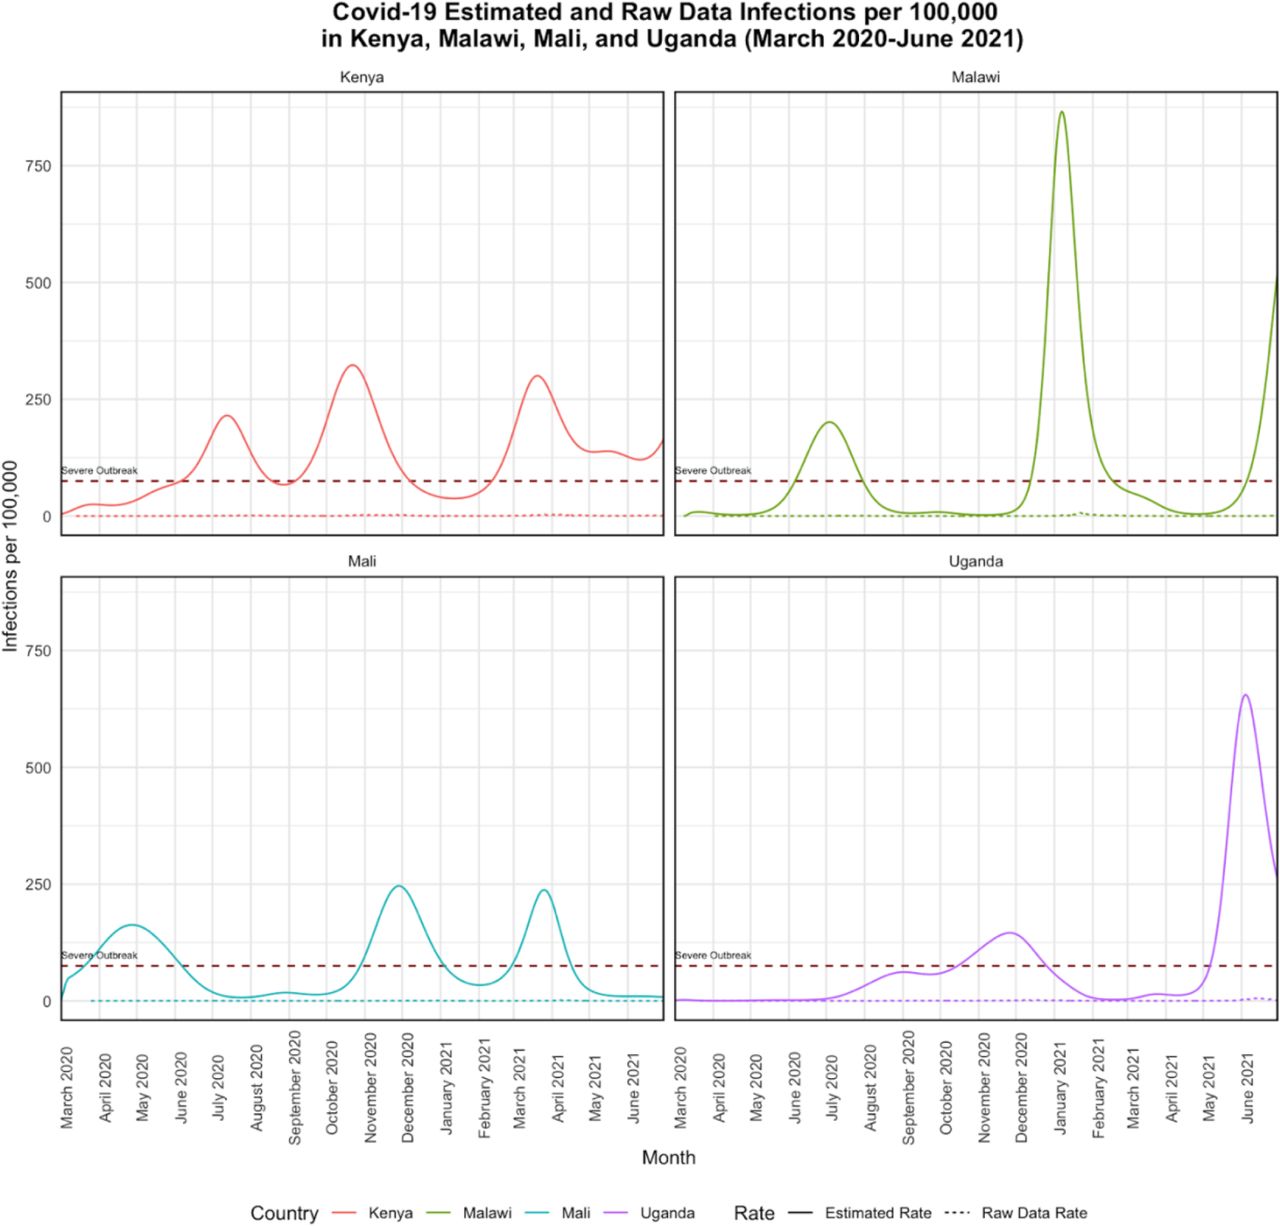
As indicated in the introduction, there are a number of supply-side and demand-side reasons a pandemic may have an impact on service delivery. When interpreting these results, it is important to emphasise that multiple supply-side and demand-side factors likely to interrupt service delivery were present in all study areas during the study period. On the supply side, each of the four countries studied experienced three ‘waves’ of COVID-19 during the period of observation, with at least one-third and up to one half of the post-March 2020 observation period in each country qualifying as a ‘severe outbreak’ (figure 3).25

Descriptive trends in estimated and confirmed COVID-19 infections for March 2020–June 2021 for five sites using Institute for Health Metrics and Evaluation (IHME)’s COVID-19 estimates.
As noted elsewhere, these case numbers are likely to be under-reported.26 Data from regions with equivalent caseloads suggest disruption to health service provision was widespread. In a 2021 WHO national pulse survey on continuity of essential health services during the COVID-19 pandemic, 66% of 112 responding countries reported disruptions to essential health services due to unavailability of health workers.27 On the demand side, mobility restrictions were present for substantial portions of the period under observation in each of the four countries (table 5). In the aforementioned WHO pulse survey, 57% of countries reported disruptions to essential health services due to community fear or mistrust in seeking healthcare.27 The presence of this fear (in terms of patients ceasing to seek care for fear of contracting COVID-1928–30 and avoidance of and discrimination against health workers31) was documented in each of the four study countries, even prior to the first wave.32
In the absence of a control, well-supported CHWs cannot be isolated as the sole reason health service delivery was maintained without serious disruption for more than a year during the COVID-19 pandemic in the areas under study. However, well-supported CHWs unfortunately remain rare and this paper presents robust outlier evidence across 4 countries and 27 districts of the maintenance of essential health service delivery in places where such prepared and protected CHWs delivered care. The community-based care analysed in this paper was provided by CHWs supported in line with the WHO Guideline on health policy and system support to optimise community health worker programmes33; each programme scored highly on the UNICEF/U.S. Agency for International Development (USAID) quality tool and CHW AIM (see online supplemental table 1).21 Over 85% of CHWs were equipped with PPE and trained on COVID-19 response within 6 weeks of the first case appearing in their country and remained equipped with PPE for the duration of the period studied.
Our results provide an important counternarrative to the prevailing discourse on COVID-19 and essential health service delivery in which critical disruptions were expected, identified and even understood as inevitable.
The large sample size of the proposed study, both in terms of records aggregated and long retrospective review, contributes to the robustness of any findings. Nonetheless, limitations of these findings include: (1) not all regions were able to report all data for all metrics (full coverage of tables can be found in online supplemental tables 5 and 6). (2) This analysis does not include exhaustive data from health facilities and thus is only a partial picture of changes to service delivery. (3) Despite measures taken to ensure accuracy, data quality can vary across and within sites (eg, reporting errors, oversights in verification). (4) The pandemic may have precipitated changes in reporting that do not capture actual changes in the services provided. (5) Proportions can mask decreases in raw counts. We mitigate this by presenting raw numbers across all metrics included in this analysis. In examining these numbers, we observed multiple instances of increasing raw counts during the pandemic period, even as rates remained constant (see online supplemental table 4). (6) While this analysis provides critical insight into the role CHWs played in continuing essential services and supporting the health of their communities during the pandemic, these services alone do not capture the full impact of the work done by community-based cadres.
CHWs who were prepared and protected were able to maintain essential services for 5.2 million people across five regions in four different country contexts. Given that the majority of CHWs globally remain unpaid34 and largely unsupported, this paper suggests that the opportunity cost of not professionalising CHWs may be larger than previously estimated, particularly as we look to better prepare for future pandemics.35
Data availability statement
No data are available. The data that support the findings of this study are available from Ministries of Health in Kenya, Malawi, Mali and Uganda. Restrictions apply to the availability of these data, which were used under licence for this study.
Ethics statements
Patient consent for publication
Ethics approval
The study team received an IRB exemption from the University of Washington’s Human Subjects Division.
Acknowledgments
The study authors would like to acknowledge the CHWs and CHW supervisors across all five regions for their continued service. We thank the monitoring and evaluation team in Kenya, Mali (especially Lassina Malle and Mohamed Bana Traoré), Uganda and Malawi (especially Basimenya Nhlema, Moses Aron, Emilia Connolly and Chiyembekezo Kachimanga) for their role in quality assurance and improvement. We are grateful to Lucas Goldstone and Dr Aaron Baum for their support with the regression analysis. We thank the Ministries of Health in all four countries for their collaboration. Thanks also to Ishma Iqbal and Laura Solia Shellaby for their copyedit.
References
Supplementary materials
Supplementary Data
This web only file has been produced by the BMJ Publishing Group from an electronic file supplied by the author(s) and has not been edited for content.
Footnotes
Twitter @DrMBallard
Contributors MB set up the collaborative network with vital early support from HEO and AY and serves as the guarantor. MB, HEO and AM designed the study with critical input from all authors. AM did the coding and ran the statistical analysis. MB, HEO and AM took the lead in interpretation of the results and drafting of the manuscript. AN, MC, DJR, WOO, DL, CWhidden, JY, DP, DT and FM led data collection and provided substantial contributions to interpretation of the results and drafting of the manuscript. CWhidden, CWestgate and JY made significant content contributions to the final draft of the report. All authors critically reviewed and approved the final version.
Funding This research was funded by Focusing Philanthropy (no grant number) and Patrick J McGovern Foundation (no grant number).
Competing interests None declared.
Patient and public involvement Patients and/or the public were not involved in the design, or conduct, or reporting, or dissemination plans of this research.
Provenance and peer review Not commissioned; externally peer reviewed.
Supplemental material This content has been supplied by the author(s). It has not been vetted by BMJ Publishing Group Limited (BMJ) and may not have been peer-reviewed. Any opinions or recommendations discussed are solely those of the author(s) and are not endorsed by BMJ. BMJ disclaims all liability and responsibility arising from any reliance placed on the content. Where the content includes any translated material, BMJ does not warrant the accuracy and reliability of the translations (including but not limited to local regulations, clinical guidelines, terminology, drug names and drug dosages), and is not responsible for any error and/or omissions arising from translation and adaptation or otherwise.