Article Text

Abstract
Objectives To perform a systematic review on the characteristics of participants who attended screening programmes with blood glucose tests, lipid profiles or a combination of them, respectively.
Design Systematic review following the Meta-analysis Of Observational Studies in Epidemiology checklist.
Data sources PubMed and Medline databases for English literature from 1 January 2000 to 1 April 2020.
Eligibility criteria Original observational studies that reported baseline characteristics of apparently healthy adult participants screening for diabetes and lipid disorders were included in this review.
Data extraction We examined their sociodemographic characteristics, including age, gender, body mass index (BMI) and lifestyle habits. The quality of the included articles was evaluated by the Appraisal of Cross-sectional Studies.
Results A total of 33 articles involving 38 studies in 22 countries were included and analysed in this systematic review. Overall, there was a higher participation rate among subjects who were female in all screening modalities (female vs male: 46.6%–63.9% vs 36.1%–53.4% for diabetes screening; 48.8%–58.4% vs 41.6%–51.2% for lipid screening; and 36.4%–76.8% vs 23.2%–63.6% for screening offering both). Compared with the BMI standard from the WHO, participants in lipid screening had lower BMI (male: 23.8 kg/m2 vs 24.2 kg/m2, p<0.01; female: 22.3 kg/m2 vs 23.6 kg/m2, p<0.01). Furthermore, it is less likely for individuals of lower socioeconomic status to participate in diabetes or lipid screening in developed areas.
Conclusions We identified that individuals from lower socioeconomic groups were less likely to take up programmes for diabetes and/or lipid screening in developed areas. These populations are also likely to be at higher risk of non-communicable diseases. Future studies should investigate the barriers and facilitators of screening among non-participants, where targeted interventions to enhance their screening uptake are warranted.
- Diabetes Mellitus
- Lipid Metabolism Disorders
- Mass Screening
- Population Characteristics
- Systematic Review
Data availability statement
All data relevant to the study are included in the article or uploaded as supplemental information. All data generated or analysed during this study are included in the article (and its supplemental information files).
This is an open access article distributed in accordance with the Creative Commons Attribution Non Commercial (CC BY-NC 4.0) license, which permits others to distribute, remix, adapt, build upon this work non-commercially, and license their derivative works on different terms, provided the original work is properly cited, appropriate credit is given, any changes made indicated, and the use is non-commercial. See: http://creativecommons.org/licenses/by-nc/4.0/.
Statistics from Altmetric.com
- Diabetes Mellitus
- Lipid Metabolism Disorders
- Mass Screening
- Population Characteristics
- Systematic Review
Strengths and limitations of this study
To our knowledge, this is the first systematic review that presented the characteristics of screening participants in one-step diabetes and lipid screening programmes.
Due to the descriptive manner, we cannot quantify the association between patients’ characteristics and screening participation.
We included articles that used different screening tests for diabetes, and this might pose challenges on comparison across studies.
There are differences in the organisation of different screening programmes in terms of the tests offered, subsidy amount and accessibility of the screening centres, and these could influence the screening uptake rate.
Introduction
Cardiovascular disease (CVD) represents the major cause of mortality, accounting for 17.9 million deaths or 32% of all global deaths in 2019.1 It caused more than half of all deaths across the European region, and the death rates were higher in the Russian Federation, Bulgaria and Romania than in other European regions.2 3 Most Asian countries had higher age-adjusted mortality than Western countries.4 Patients with CVD have a high risk of complications, including ischaemic heart disease, stroke and chronic kidney diseases.5 The modifiable risk factors for CVD included smoking, inadequate physical activity, elevated blood pressure, increased body weight, increased plasma lipid (cholesterol and triglyceride), as well as diabetes.6 Diabetes is not only the risk factor for CVD but is also associated with significant morbidity and mortality. About 1.6 million deaths were directly caused by diabetes mellitus in 2016. In addition, diabetes may lead to long-term complications, such as kidney failure, lower limb amputation, blindness, heart attacks and stroke.7 8 Worldwide, there were 108 million patients with diabetes in 1980, and the number has increased to 422 million in 2014.8 The global prevalence of diabetes has been predicted to rise to 10.2% (578 million) by 2030 and 10.9% (700 million) by 2045.9
Globally, ischaemic heart disease and stroke ranked the first and second causes of disability-adjusted life years (DALYs) in 2016, which were responsible for 12.8% of total DALYs lost.10 Diabetes caused 65.7 million DALYs lost and 2.5% of the total global DALYs lost in 2016.10 In addition, dyslipidaemia also poses a serious threat to the health of populations. Overall, elevated cholesterol was estimated to contribute to 4.5% of total deaths and 2.0% of total DALYs.11 Disease screening is regarded as an effective approach for the early detection and prevention of diabetes and dyslipidaemia. It was demonstrated that cholesterol screening can save 14 300 quality-adjusted life years (QALYs) over 100 000 person-years incurring a cost of $33 800 per QALY in the USA.12 Diabetes screening has been shown to be more cost-effective for individuals aged 55–75 years as compared with younger subjects.13
According to international guidelines for screening (online supplemental table 1), in the USA,14 the UK,15 Australia,16 Canada17 and Singapore,18 cholesterol screening is recommended for adults, and the proposed age of onset for screening ranged from 35 to 45 years—or earlier for patients with CVD risk factors. Furthermore, Australia,16 Canada19 and Singapore20 suggested diabetes screening for average-risk adults above 40 years old, and the USA recommended screening for adults aged 40–70 years who are overweight or obese.21
Supplemental material
However, previous studies have shown that the uptake rate for diabetes and lipid screening was suboptimal. According to a cross-sectional study performed in the USA between 2005 and 2012, the diabetes screening rates for ‘screening-recommended’ and ‘screening-not-recommended’ participants were 46.2% and 29.6%, respectively.22 Participation rates of the health examinations for CVD and diabetes ranged between 48% and 67% in Sweden.23 Although the attendance rate for National Health Service health check in England quadrupled from 5.8% in 2010 to 30.1% in 2012, the uptake rates were still relatively low when compared with findings from other studies.24 To our knowledge, there are no systematic reviews that explored the socioeconomic and demographic characteristics of participants who take up screening programmes for diabetes and lipid disorders, knowing their characteristics could help to target individuals who were less likely to receive screening and improve their participation. These results may help to provide a basis for future studies to examine the enablers and barriers for diabetes and lipid screening. Therefore, we performed a systematic review of the existing literature to evaluate the characteristics of participants who received screening tests for diabetes and lipid disorders.
Methods
Search strategy
We followed the Meta-analysis Of Observational Studies in Epidemiology checklist to conduct this systematic review.25 We searched the PubMed and Medline databases for English literature from 1 January 2000 to 1 April 2020. The characteristics of participants were influenced by health literacy, health development, health policy, etc, which are changing over time. The older articles showed limited quality to be involved in this study, so we included the studies of recent 20 years to conduct this review. The following keywords were used for the search: (1) AND (2) NOT (3): (1) “fasting plasma glucose test” OR “postprandial plasma glucose” OR “oral glucose tolerance test” OR “random plasma glucose test” OR “glycated hemoglobin” OR “lipid test” OR “cholesterol test” OR “triglyceride test” OR “lipid panel” OR “lipid profile” (2) “uptake” OR “participate” (3) “pediatric” OR “gestational” (online supplemental table 2).
Inclusion and exclusion criteria
Studies were included if they: (1) were cross-sectional or reported baseline characteristics of participants in cohort studies; (2) were conducted among adults without a known history of diabetes, pre-diabetes or CVD; (3) adopted one-step fingerstick or blood glucose (including fasting plasma glucose (FPG), oral glucose tolerance tests (OGTTs), glycated haemoglobin (HbA1c) and random blood glucose (RBG)) or blood lipid tests as screening tools; and (4) reported participants’ characteristics. The exclusion criteria included the following: (1) conference abstracts, systematic reviews or studies published in languages other than English; (2) screening programmes for pregnant women, the paediatric population, and/or patients who were previously diagnosed with diabetes, pre-diabetes or CVD; (3) studies whose target population focused on obese or overweight subjects, people with a family history of diabetes or CVD; (4) studies that involved the measurements with multiple steps/stages; and (5) studies performed before 2000.
Data extraction and quality assessment
Two reviewers (HD and VL) independently searched and screened each title and abstract. Disagreements were solved by discussion. Once the title and abstract of each citation were assessed as eligible, two reviewers reviewed and appraised the full text. We used the Appraisal of Cross-sectional Studies (AXIS) to assess the quality of included articles, which consists of 20 questions and answers recorded ‘yes’, ‘no’ or ‘don’t know’.26 AXIS does not involve a numerical scale that can be used to calculate and produce a quality assessment score. We extracted the following data from all included articles: the first author’s name, publication year, country, region/city, project period, study type, subsidisation, the age range of the population, number of participants; the screening tests used (fingerprick, FPG, OGTT, HbA1c, RBG, fasting lipid profile, waist circumference, hip circumference, blood pressure and other relevant tests); participant characteristics: gender, age, body mass index (BMI), marital status, educational status, occupational status, other indicators of socioeconomic status (SES) (including household wealth index, social deprivation index and household income), family history, cigarette smoking, alcohol consumption, physical activity and the reason for non-participation.
Statistical analysis
We summarised and descriptively reported the socioeconomic and demographic characteristics of the population attending the screening in the included studies. Based on our findings in the initial literature review, we also selected gender as a subgroup to explore the difference in age and BMI of the study participants. Means±SDs of these parameters were obtained from included studies. Figures were plotted using R software V.3.6.3 with the ggplot package.
Results
From the literature search, 6407 citations were identified, of which 5658 were from PubMed and 749 were from Medline (online supplemental figure 1). There were 5723 citations after the removal of duplicates. We retrieved 122 full-text articles to assess for eligibility after 5536 citations were excluded during the title or abstract screening with the predetermined criteria. We excluded 89 articles which were duplicate studies (n=1); performed before the year 2000 (n=9); had absence of full text or lack of sufficient data for extraction (n=22); had the presence of known diabetes, pre-diabetes or CVD (n=44); or target population whose subjects reported family history of diabetes, pre-diabetes or elevated BMI (n=13). Finally, we included 38 studies from 33 articles in the present systematic review.27–59
Regarding the AXIS for evaluating each included study, most studies presented with the following limitations: the sample size not being justified (23 of 33); absence of characterisation and categorisation of non-participants (29 of 33); a lack of control for non-response bias (30 of 33); and absence of description of non-participants (27 of 33). Overall, all studies (33 of 33) met the following criteria: appropriate objectives and study design; appropriate risk factors and outcome variables; clear and sufficient description of methods; adequate description of the participants’ characteristics and internally consistent presentation of results (online supplemental table 3).
The characteristics of all eligible studies were presented in table 1. Among these 33 manuscripts, 15 were from Asia (China, Vietnam, Sri Lanka, Pakistan, Palestine, Thailand), 7 were from Europe (Spain, England, Ireland, Netherlands, Lithuania, Sweden, Portugal), 6 were from Africa (Mauritius, Cameroon, Uganda, Nigeria, Tunisia, South Africa), 4 were from Americas (USA, Ecuador) and 1 was from Oceania (New Zealand). Ten studies were from developed countries, and the other 23 studies were from developing countries. According to screening items, 11 studies only implemented diabetes screening, 4 studies only conducted lipid tests, and the rest of the 18 studies performed both diabetes and lipid screening.
Characteristics of included studies
Diabetes screening
Eleven studies adopted OGTT, HbA1c, FPG or RBG to screen for diabetes.32 36 39–41 43 44 46 48 53 55 OGTT and HbA1c were the commonly used modalities (in seven articles), followed by FPG (in five articles) and RBG (in one article). Two of these studies evaluated combinations of FPG, OGTT and HbA1c. A total of four studies simultaneously took blood pressure during screening.41 44 48 53 Except for three studies,32 36 46 all the others included anthropometry measurements (body weight, height, waist and hip circumference). Nearly half of the studies were from developed countries (5 out of 11).39 40 43 46 53 Among these 11 articles, 1 reported findings from workplace screening insured by employers,39 2 were national health surveys and fully subsidised by government organisations,40 53 5 were funded by research institutes or funding agencies,32 41 44 46 55 1 was supported by a pharmaceutical company for free metres and strips,43 and 2 did not mention their financial support36 48 (table 1).
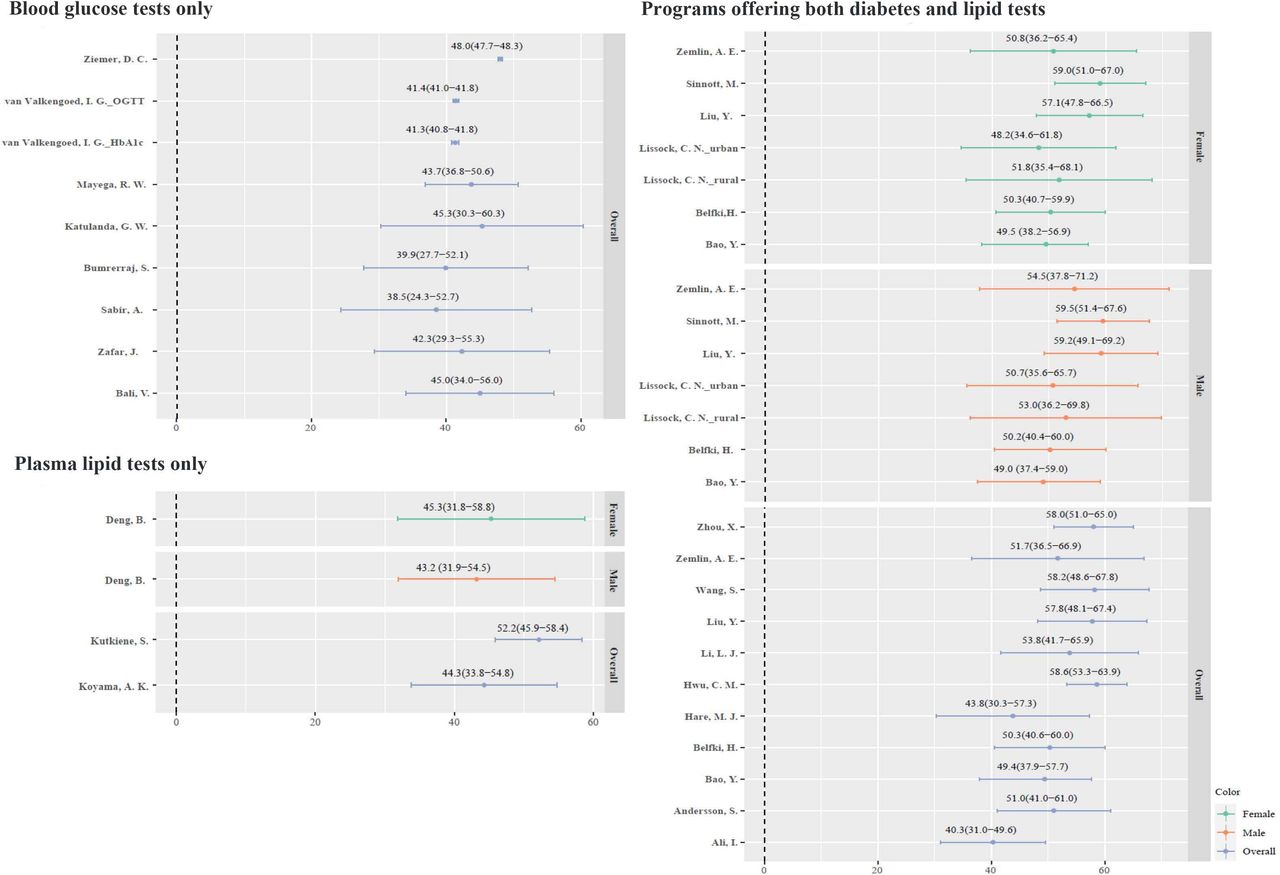
The range of participation rate of female and male subjects in the diabetes screening programmes was 46.6%–63.9% and 36.1%–53.4%, respectively (online supplemental figure 2). More female participants participated in screening than men in 12 studies. Only two studies showed more male participants in Uganda (52.4%) and Nigeria (53.4%). The mean age of the participants ranged from 38.5 to 48.0 years in all included studies (figure 1). The studies varied in terms of participant age, where the average age of most studies was more than 40 years. We extracted the national mean BMI of adults in various jurisdictions reported by the WHO,60 and compared these with the participants’ average BMI (figure 2). The average BMI of participants tended to be higher than the national mean, in particular from studies performed in the Netherlands (26.1 kg/m2 vs 25.4 kg/m2, p<0.01),46 Thailand (24.3 kg/m2 vs 24.1 kg/m2, p=0.39)55 and the USA (30.2 kg/m2 vs 28.8 kg/m2, p<0.01).53

The mean age of screening participants.

The body mass index of screening participants.
The sociodemographic information of the screening participants was shown in table 2. For educational status, different studies adopted different classification methods for educational levels. Mayega et al reported that 39.6% of participants had a higher primary level, followed by a lower primary (21.9%), none (17.5%), secondary (16.5%) and tertiary (4.5%) educational level in Uganda.41 Zafar et al showed more than half of participants had matriculation level (same as the 10th grade) or above (52.5%).48 They also investigated the household income and found that 72.5% of the participants had <30 000 Pakistani rupee (PKR) income (approximately US$300 in 2014).40 Mainous et al reported the trend (2003, 2006, 2009, 2011) of the social deprivation index, which is a composite index based on income, employment, health deprivation and disability, education, skills and training, barriers to housing and services, crime and disorder, and living environment.40 The most deprived quintile had the lowest participation percentages in all the years (16.5%–17.7%), and the other four levels of fewer deprivation quantities presented similar proportions (18.1%–23.1%). In addition, the proportions of single, divorced or widowed status were also lower than that of married participants.48
Sociodemographic characteristics of participants in all included studies
Apart from age, gender, BMI and sociodemographic information, we also extracted data on family history and lifestyle habits (table 3). A study from the Netherlands reported that around 70% of participants had a family history of type 2 diabetes,46 whereas this uptake rate was under 40% in diabetes screening in Pakistan.48 Of the two studies including smoking status, Sabir et al and Zafar et al reported low rates of participation among current smokers (9.7% and 13.4%, respectively).44 48 Sabir et al also reported a very low proportion of screening uptake among alcohol drinkers (0.3%) in Nigeria.44
Family history and lifestyle habits of participants
Lipid screening
A total of four studies offered lipid screening33 34 51 57: one cross-sectional screening survey was covered by research funding,57 one study was workplace-based screening and insured by employers33 and the other two studies were for national screening programmes supported by government organisations.34 51 Only one study was from a developed country33 (table 1).
In these four articles, two articles reported body weight and height,33 57 and one study stated both waist and hip circumference.57 For participants, the proportion of women ranged from 48.8% to 58.4%. Only one study that targeted rural residents of Yunnan China showed a higher percentage of men (51.2%) among participants (online supplemental figure 2). The mean age of the screening participants was older than 40 years (figure 1). Turning to mean BMI, however, both male and female subjects had lower than the national mean BMI reported by the WHO (male: 23.8 kg/m2 vs 24.2 kg/m2, p<0.01; female: 22.3 kg/m2 vs 23.6 kg/m2, p<0.01) (figure 2). Studies from Deng et al and Koyama et al reported the highest proportion of individuals having a higher educational level in China and the USA (38.4% and 58.3%, respectively)33 57 (table 2).
Deng et al reported the smoking, drinking and physical activity habits of their lipid screening participants in China.57 One-third of them were current smokers. Moreover, 39.4% of subjects reported that they were current drinkers. For physical activity, 57.0% of them took exercise or participated in physical labour activities more than twice per week for at least 30 min each (table 3).
Participants receiving both diabetes and lipid screening
The studies that presented the characteristics of screening participants in programmes that offered screening for both diabetes and lipid profiles were listed in table 1. Fourteen of these papers adopted FPG to evaluate blood glucose.27 30 31 35 37 38 45 47 49 50 52 54 56 58 Ten studies used HbA1c,28 29 35 38 42 47 49 50 52 58 nine studies used OGTT,28 29 31 38 47 49 50 52 59 while five of the included studies offered all three tests.38 47 49 50 52 Only four studies were from developed countries.28 42 45 58 Two were organised by the government,29 42 and one was offered by a private health insurance provider for their members.45
For comparison of diabetes and lipid screening participation between men and women, only one study reported having more male than female subjects joining the screening programme in Hainan, China35 (online supplemental figure 2). Five studies indicated that male participants were older than female participants,37 38 45 49 while the other two studies reported female participants being older50 54 (figure 1). Turning to the mean BMI of participants, most of the studies reported a higher number than the national BMI levels, including those conducted in China (24.7 kg/m2 vs 23.9 kg/m2, p<0.0152; 25.1 kg/m2 vs 23.9 kg/m2, p<0.0147; 24.9 kg/m2 vs 23.9 kg/m2, p<0.0138; 24.8 kg/m2 vs 23.9 kg/m2, p<0.0135; 25.4 kg/m2 vs 23.9 kg/m2, p<0.01)31; South Africa (29.1 kg/m2 vs 27.3 kg/m2, p<0.01)49; Sweden (29.0 kg/m2 vs 25.8 kg/m2, p<0.01)28; and Tunisia (27.8 kg/m2 vs 26.8 kg/m2, p<0.01)54 (figure 2). Overall, women had higher BMI levels than their national average as reported in most studies, while only two studies showed a higher BMI among male participants when compared with the WHO report.37 38 Some other screening tests were also included in other literature, such as skinfold thicknesses,56 renal function,58 uric acid,35 liver function,35 blood count42 and heart rate.37 52
For educational status, we found a substantial difference in participants’ educational status across different studies. Belfki et al showed that 77.2% of participants had a low educational level in Tunisia.54 However, Wang et al reported that around 64.6% of the individuals had an educational level at higher school or above in Shanghai.47 For occupational status, Belfki et al indicated more than half (56.6%) of the participants were retired or had no current jobs.54 The corresponding proportion was only 24.2% in Cuong et al’s study.56 Cuong et al also measured the household wealth index of participants and showed similar proportions among male (18.6%–21.2%) and female participants (18.8%–21.7%) across all levels of the index56 (table 2).
Of the six studies that reported family history, one study described that 27.9% of the participants had a family history of dyslipidaemia,27 another study indicated the proportion of a family history of CVD was 2.6%,54 and the other four studies mentioned that 9.4%–31.9% of the participants with a family history of diabetes joined the screening programmes45 47 52 58 (table 3).
Of the 10 studies with information on the smoking status, 3 reported high rates of current smoking,27 54 56 which were 37.1%, 28.6% and 30.7%, respectively. Four studies stated the participants’ alcohol consumption; one reported a higher rate (79.8%),45 compared with that reported in two studies (10.5%–13.64%).47 52 Among the five studies which included physical activity, three of them reported that more than half of the participants performed adequate physical activity (60.5%–71.2%)29 47 58 (table 3).
The reasons for non-participation
Four studies mentioned the reasons for non-participation. Two studies on diabetes screening assessed reasons for non-participation. Mayega et al reported 5.4% of subjects refused to participate due to travel distance and 4.2% of non-participants declined the blood tests.41 Valkengoed et al described that ‘no time’ and ‘no interest’ were the major reasons among prospective eligible participants.46 Regarding lipid screening, Deng et al explained that 1.0% of subjects declined screening tests due to time constraints.57 Nunes et al showed that 43.9% of individuals participated in the first Portuguese National Health Examination Survey involving both diabetes and lipid screening.42 Furthermore, they found that work-related issues (26.6%) and lack of time (26.6%) were the most frequently mentioned reasons for not joining.
Discussion
This systematic review provided socioeconomic and demographic characteristics of participants who received screening tests for diabetes and lipid disorders, including age, gender, BMI, sociodemographic status, family history and lifestyle habits. We found a higher proportion of women among the screening participants when compared with the male gender in most studies, irrespective of the tests offered. Participants who joined diabetes screening tended to have higher BMI values, while those who received lipid screening tended to have lower BMI values. Regarding screening programmes offering both diabetes and lipid tests, female participants had higher BMI values and male participants had lower BMI values than the national means reported by the WHO.
Sargeant et al conducted a stepwise programme to screen diabetes, and they reported male gender was significantly associated with lower uptake of RBG testing, which is consistent with our findings on diabetes screening.61 A serial study of cross-sectional data (1992–2008) evaluated the utilisation of preventive health assessments in the UK, and found that the participation rate of lipid tests increased with age, but they reported an absence of association between gender and participation in lipid tests.62 They also showed that smokers (vs non-smokers) had significantly lower uptake of lipid tests. In our review, around one-third of participants were current smokers in lipid tests and programmes offering both diabetes and lipid tests. A longitudinal study indicated that current smokers had limited health literacy and lower cognitive ability than ever smokers,63 which may explain their lower screening uptake rates. Interventions to address the health literacy of prospective participants are needed to improve screening participation, which at the same time could also help to change their lifestyle habits for the prevention of chronic diseases.64
A postal survey investigated the participation rate of women’s health check-ups, including identification of CVD risk factors, as well as examinations for type 2 diabetes and kidney disease in Germany in 2004.65 Its adjusted model showed that single, divorced, separated or widowed women (OR=0.63, 95% CI: 0.57 to 0.71) were less likely to receive a preventive health check-up when compared with married women. The proportions of single, divorced or widowed status were also lower than that of married participants in our review, except for a study performed in Italy. This may be due to peer effects where family members may exert a motivational influence on chronic disease screening. It is well recognised that SES influenced disease risk, health behaviour and healthcare of individuals. These health inequities have been affirmed by the WHO.66 Researchers in Germany found that there was a significant association between women with lower SES (estimated based on educational status, occupational position and household income) (OR=0.82, 95% CI: 0.74 to 0.92) and lower participation rate of health screening attendance.65 This is consistent with our finding that health inequities might exist as the most deprived population had the lowest participation rates in England, where only blood glucose tests were provided. Meanwhile, participants of studies in Spain and China (Shanghai) had higher educational status, whereas studies in Tunisia, Mauritius and Ecuador recruited more participants with lower educational level. Health inequities are more likely to be found in developed areas,67 yet they also exist in developing countries due to differential health literacy and access to primary care services. For the non-participation of screening programmes among those with lower educational levels, health literacy plays an important role in screening participation. The American Heart Association highlighted that low health literacy is a barrier to healthcare screening and basic services for diabetes and CVD.68 A systematic review included studies that evaluated the effectiveness of health literacy interventions using pre-programme and post-programme assessment, and concluded their positive impact on enhancing screening uptake.64
Hypertension is also a risk factor that contributes to CVD, but we did not include it as a target measurement, because the blood tests had more obstacles than the blood pressure tests, for example, the fear of needles, fear of pain, and cost of test strips and needles.69 Thus, in this study, we focused on the blood glucose tests and lipid profiles to explore the characteristics of participants.
To our knowledge, this is the first systematic review that presented the characteristics of screening participants in diabetes and lipid screening programmes. The findings inform population groups where interventions to enhance screening uptake should be targeted. Nevertheless, there are several limitations. First, this is a systematic review of literature presented in a descriptive manner. Therefore, we cannot quantify the association between patients’ characteristics and screening participation. In addition, we included articles that used different screening tests for diabetes, and this might pose challenges on comparison across studies. The American Diabetes Association proposed that FPG is the best screening test and also a component of the diagnostic test for diabetes.70 FPG is more convenient and acceptable to patients since it is easier and faster to perform, and is less expensive than OGTT. There are differences in the organisation of different screening programmes in terms of the tests offered, subsidy amount and accessibility of the screening centres, and these could influence the screening uptake rate. In addition, the prevalence of risk factors in screening participants who take up the tests might be different from those who do not.
Overall, the present study systematically summarised the characteristics of screening participants in diabetes and lipid screening programmes. A higher proportion of female participants was found in diabetes and lipid screening programmes than men in most studies. For diabetes screening, participants tended to have higher BMI, while it was the opposite for subjects who participated in lipid screening. Meanwhile, women tended to have higher BMI and men tended to have lower BMI in screening programmes offering both diabetes and lipid tests. Participants with lower SES were less likely to undergo screening in developed areas. Around one-third of participants were current smokers in lipid screening and a combination of lipid and diabetes screening programmes. The proportion of participants using alcohol and performing regular physical activity varied substantially among included studies. Our findings could inform future studies to investigate the enablers and barriers to screening among participants and non-participants based on their characteristics, and also interventions to enhance their screening uptake.
Data availability statement
All data relevant to the study are included in the article or uploaded as supplemental information. All data generated or analysed during this study are included in the article (and its supplemental information files).
Ethics statements
Patient consent for publication
Ethics approval
Not applicable.
Acknowledgments
We appreciate the invaluable contributions of Ms. Xiao Chen and Ms. Veeleah Lok.
References
Supplementary materials
Supplementary Data
This web only file has been produced by the BMJ Publishing Group from an electronic file supplied by the author(s) and has not been edited for content.
Footnotes
Contributors HD—formal analysis, investigation, data curation, writing (original draft). JH—writing (review and editing). YD—validation, writing (review and editing). PSPT—writing (review and editing). MC-SW—methodology, supervision, project administration, guarantor. EKY—conceptualisation, supervision, guarantor.
Funding The authors have not declared a specific grant for this research from any funding agency in the public, commercial or not-for-profit sectors.
Competing interests PSPT is from Our Hong Kong Foundation. The other authors declare no competing interests.
Patient and public involvement Patients and/or the public were not involved in the design, or conduct, or reporting, or dissemination plans of this research.
Provenance and peer review Not commissioned; externally peer reviewed.
Supplemental material This content has been supplied by the author(s). It has not been vetted by BMJ Publishing Group Limited (BMJ) and may not have been peer-reviewed. Any opinions or recommendations discussed are solely those of the author(s) and are not endorsed by BMJ. BMJ disclaims all liability and responsibility arising from any reliance placed on the content. Where the content includes any translated material, BMJ does not warrant the accuracy and reliability of the translations (including but not limited to local regulations, clinical guidelines, terminology, drug names and drug dosages), and is not responsible for any error and/or omissions arising from translation and adaptation or otherwise.