Article Text

Abstract
Objectives To identify available literature on prevalence, severity and contributing factors of scan-associated anxiety (‘scanxiety’) and interventions to reduce it.
Design Systematic scoping review.
Data sources Ovid MEDLINE, Ovid EMBASE, Ovid PsycINFO, Ovid Cochrane Central Register of Controlled Trials, Scopus, EBSCO CINAHL and PubMed up to July 2020.
Study selection Eligible studies recruited people having cancer-related non-invasive scans (including screening) and contained a quantitative assessment of scanxiety.
Data extraction Demographics and scanxiety outcomes were recorded, and data were summarised by descriptive statistics.
Results Of 26 693 citations, 57 studies were included across a range of scan types (mammogram: 26/57, 46%; positron-emission tomography: 14/57, 25%; CT: 14/57, 25%) and designs (observation: 47/57, 82%; intervention: 10/57, 18%). Eighty-one measurement tools were used to quantify prevalence and/or severity of scanxiety, including purpose-designed Likert scales (17/81, 21%); the State Trait Anxiety Inventory (14/81, 17%) and the Hospital Anxiety and Depression Scale (9/81, 11%). Scanxiety prevalence ranged from 0% to 64% (above prespecified thresholds) or from 13% to 83% (‘any’ anxiety, if no threshold). Mean severity scores appeared low in almost all measures that quantitatively measured scanxiety (54/62, 87%), regardless of whether anxiety thresholds were prespecified. Moderate to severe scanxiety occurred in 4%–28% of people in studies using descriptive measures. Nine of 20 studies assessing scanxiety prescan and postscan reported significant postscan reduction in scanxiety. Lower education, smoking, higher levels of pain, higher perceived risk of cancer and diagnostic scans (vs screening scans) consistently correlated with higher scanxiety severity but not age, gender, ethnicity or marital status. Interventions included relaxation, distraction, education and psychological support. Six of 10 interventions showed a reduction in scanxiety.
Conclusions Prevalence and severity of scanxiety varied widely likely due to heterogeneous methods of measurement. A uniform approach to evaluating scanxiety will improve understanding of the phenomenon and help guide interventions.
- adult oncology
- diagnostic radiology
- anxiety disorders
Data availability statement
Data are available on reasonable request. All data relevant to the study are included in the article or uploaded as supplemental information. The additional data are the data extraction forms for each study.
This is an open access article distributed in accordance with the Creative Commons Attribution Non Commercial (CC BY-NC 4.0) license, which permits others to distribute, remix, adapt, build upon this work non-commercially, and license their derivative works on different terms, provided the original work is properly cited, appropriate credit is given, any changes made indicated, and the use is non-commercial. See: http://creativecommons.org/licenses/by-nc/4.0/.
Statistics from Altmetric.com
Strengths and limitations of this study
This is the first scoping review on scanxiety.
A comprehensive search strategy and broad inclusion criteria have resulted in an extensive summary of all available literature.
Summary statistics for prevalence and severity of scanxiety were not possible due to heterogeneity in the type and timing of measurement tools between the studies.
Introduction
Anxiety may increase when people have scans to screen for, diagnose, or stage cancer, or to monitor cancer for recurrence or progression. Scan-associated anxiety, or the distress before, during or after a scan, was first dubbed ‘scanxiety’ by a patient writing for the Time Magazine in 2011.1
Qualitative research on the experience of having a scan has shown some people experience dread in the weeks before a scan,2 perceive scans as dehumanising, unpleasant or causing claustrophobia,2–5 and find scans trigger fear of the unknown and fear of cancer recurrence.2 3 6 Scanxiety is recognised as a common clinical concern on social media and public forums, and is acknowledged by international cancer institutions7 8 and cancer-specific support networks.9–11 Despite this, scanxiety is not uniformly recognised or measured in published studies. We conducted a systematic scoping review to identify the available literature on scanxiety in people having cancer-related scans.
Methods
We conducted a systematic scoping review based on the six-step methodological framework developed by Arskey and O’Malley12 and modified by Levac et al,13 and guided by the Preferred Reporting Items for Systematic review and Meta-Analysis protocols extension for Scoping Reviews (PRISMA-ScR) checklist.14 The study protocol and amendments are available (online supplemental files 1 and 2).
Supplemental material
Supplemental material
Step 1: research question
Our aim was to increase the understanding of scanxiety by: determining the prevalence and severity of scanxiety; identifying contributing factors to scanxiety; identifying interventions to reduce scanxiety in people having cancer-related scans; and, exploring patient experiences with scanxiety.
Step 2: search strategy
Published studies were identified from seven electronic databases: Ovid MEDLINE (1946 onwards), Ovid EMBASE (1947 onwards), Ovid PsycINFO (1806 onwards), Ovid Cochrane Central Register of Controlled Trials (1991 onwards), Scopus (any year), EBSCO CINAHL (any year) and PubMed (any year). The search strategy combined the subject headings and keywords of cancer, imaging and anxiety. An example is provided in figure 1. Reference lists of included articles were hand-searched for additional studies. All references were imported into Endnote V.9.

Search strategy used for Ovid MEDLINE (1946 onwards).
The initial search was conducted on 11 April 2019 and updated on 3 July 2020.
Step 3: study selection
Inclusion criteria were full-text original research studies that recruited adults (≥18 years old) who had a non-invasive scan for a cancer-related reason, and which quantitatively assessed the prevalence or severity of scanxiety, reported a statistical comparison between prescan and postscan scanxiety, reported a statistical comparison between scanxiety and possible contributing factors, or evaluated the impact of an intervention on scanxiety.
Cancer-related reasons included screening (detection of cancer in asymptomatic person), diagnosis (detection of cancer in symptomatic person), staging (determining extent of cancer in person with confirmed or suspected cancer), surveillance (detection of recurrence in person with cancer treated with curative intent) or monitoring (detection of progression in person with cancer treated with non-curative intent).
The measurement of scanxiety was defined as any measure of anxiety, distress or worry occurring around the time of a scan. This included any period before, during or after a scan where the scan was used as a reference point for the measurement of scanxiety. All non-invasive imaging modalities were accepted. No date restrictions were applied. Foreign language material was included if an English translation was available.
After initial review of citations and based on increasing familiarity with the literature, and in line with recommendations on scoping review methodology,12 exclusion criteria were developed post hoc. Exclusion criteria were: studies involving invasive scans (eg, transvaginal ultrasound, ultrasound with fine needle aspirate or endoscopic ultrasound) due to differences in scan preparation and risk of adverse events and studies of scans performed to investigate a positive initial screening result because the psychological experiences of asymptomatic persons facing a potential new cancer diagnosis may lead to higher anxiety than is attributable to scanxiety. Due to feasibility of conducting quantitative and qualitative analysis with the volume of literature identified, studies reporting only a qualitative assessment of scanxiety were also excluded, and the objective to explore patient experiences was abandoned.
After removal of duplicate citations, two authors (KTB and RL) independently reviewed and screened publication titles and abstracts based on the eligibility criteria. Of the studies deemed potentially eligible, full texts were evaluated for final inclusion. Discrepancies were resolved by discussion between the two authors (KTB and RL) and were escalated to all authors if a consensus could not be reached.
Step 4: charting the data
Relevant data were independently extracted by two authors (KTB and RL) into an electronic data extraction form in Microsoft Excel, which included study demographics and methodology, scanxiety measurement tools, and the outcome measures of prevalence and severity of scanxiety, contributing factors to scanxiety, and interventions to reduce scanxiety.
Step 5: collating, summarising and reporting the results
Study data were tabulated to assist with a descriptive numerical summary of the range of cancer types, imaging modalities, study methodology and scanxiety measurement tools. Associations between scanxiety and potential contributing factors were tabulated if three or more studies reported a statistical comparison.
The prevalence of scanxiety was identified in two ways:
The percentage of people who scored above the prespecified clinically important anxiety threshold, if reported.
The percentage of people who scored any degree of anxiety, if no prespecified threshold was reported.
Severity of scanxiety was defined in three ways:
Any mean score of the anxiety measure above the prespecified clinically important anxiety threshold, if reported.
Any mean score of the anxiety measure that was at least half the total score, if an anxiety threshold was not reported.
At least ‘moderate’ anxiety (or its equivalent) on a descriptive range.
The definitions of prevalence and severity were purposed-designed to allow descriptive comparisons between the studies as we anticipated heterogeneity in scanxiety measurement would preclude meaningful summary statistics.
The components of intervention studies and their effect on scanxiety were summarised and reported descriptively.
Step 6: consultation
Medical oncologists (PB and BEK), a behavioural scientist (HD) and a statistician (CB) were consulted for content expertise to develop the study objectives and to improve clarity on clinically relevant interpretations of the data.
Patient and public involvement
This research did not directly involve patients and public. Our research was initiated by repeated observations of scanxiety in oncology patients.
Results
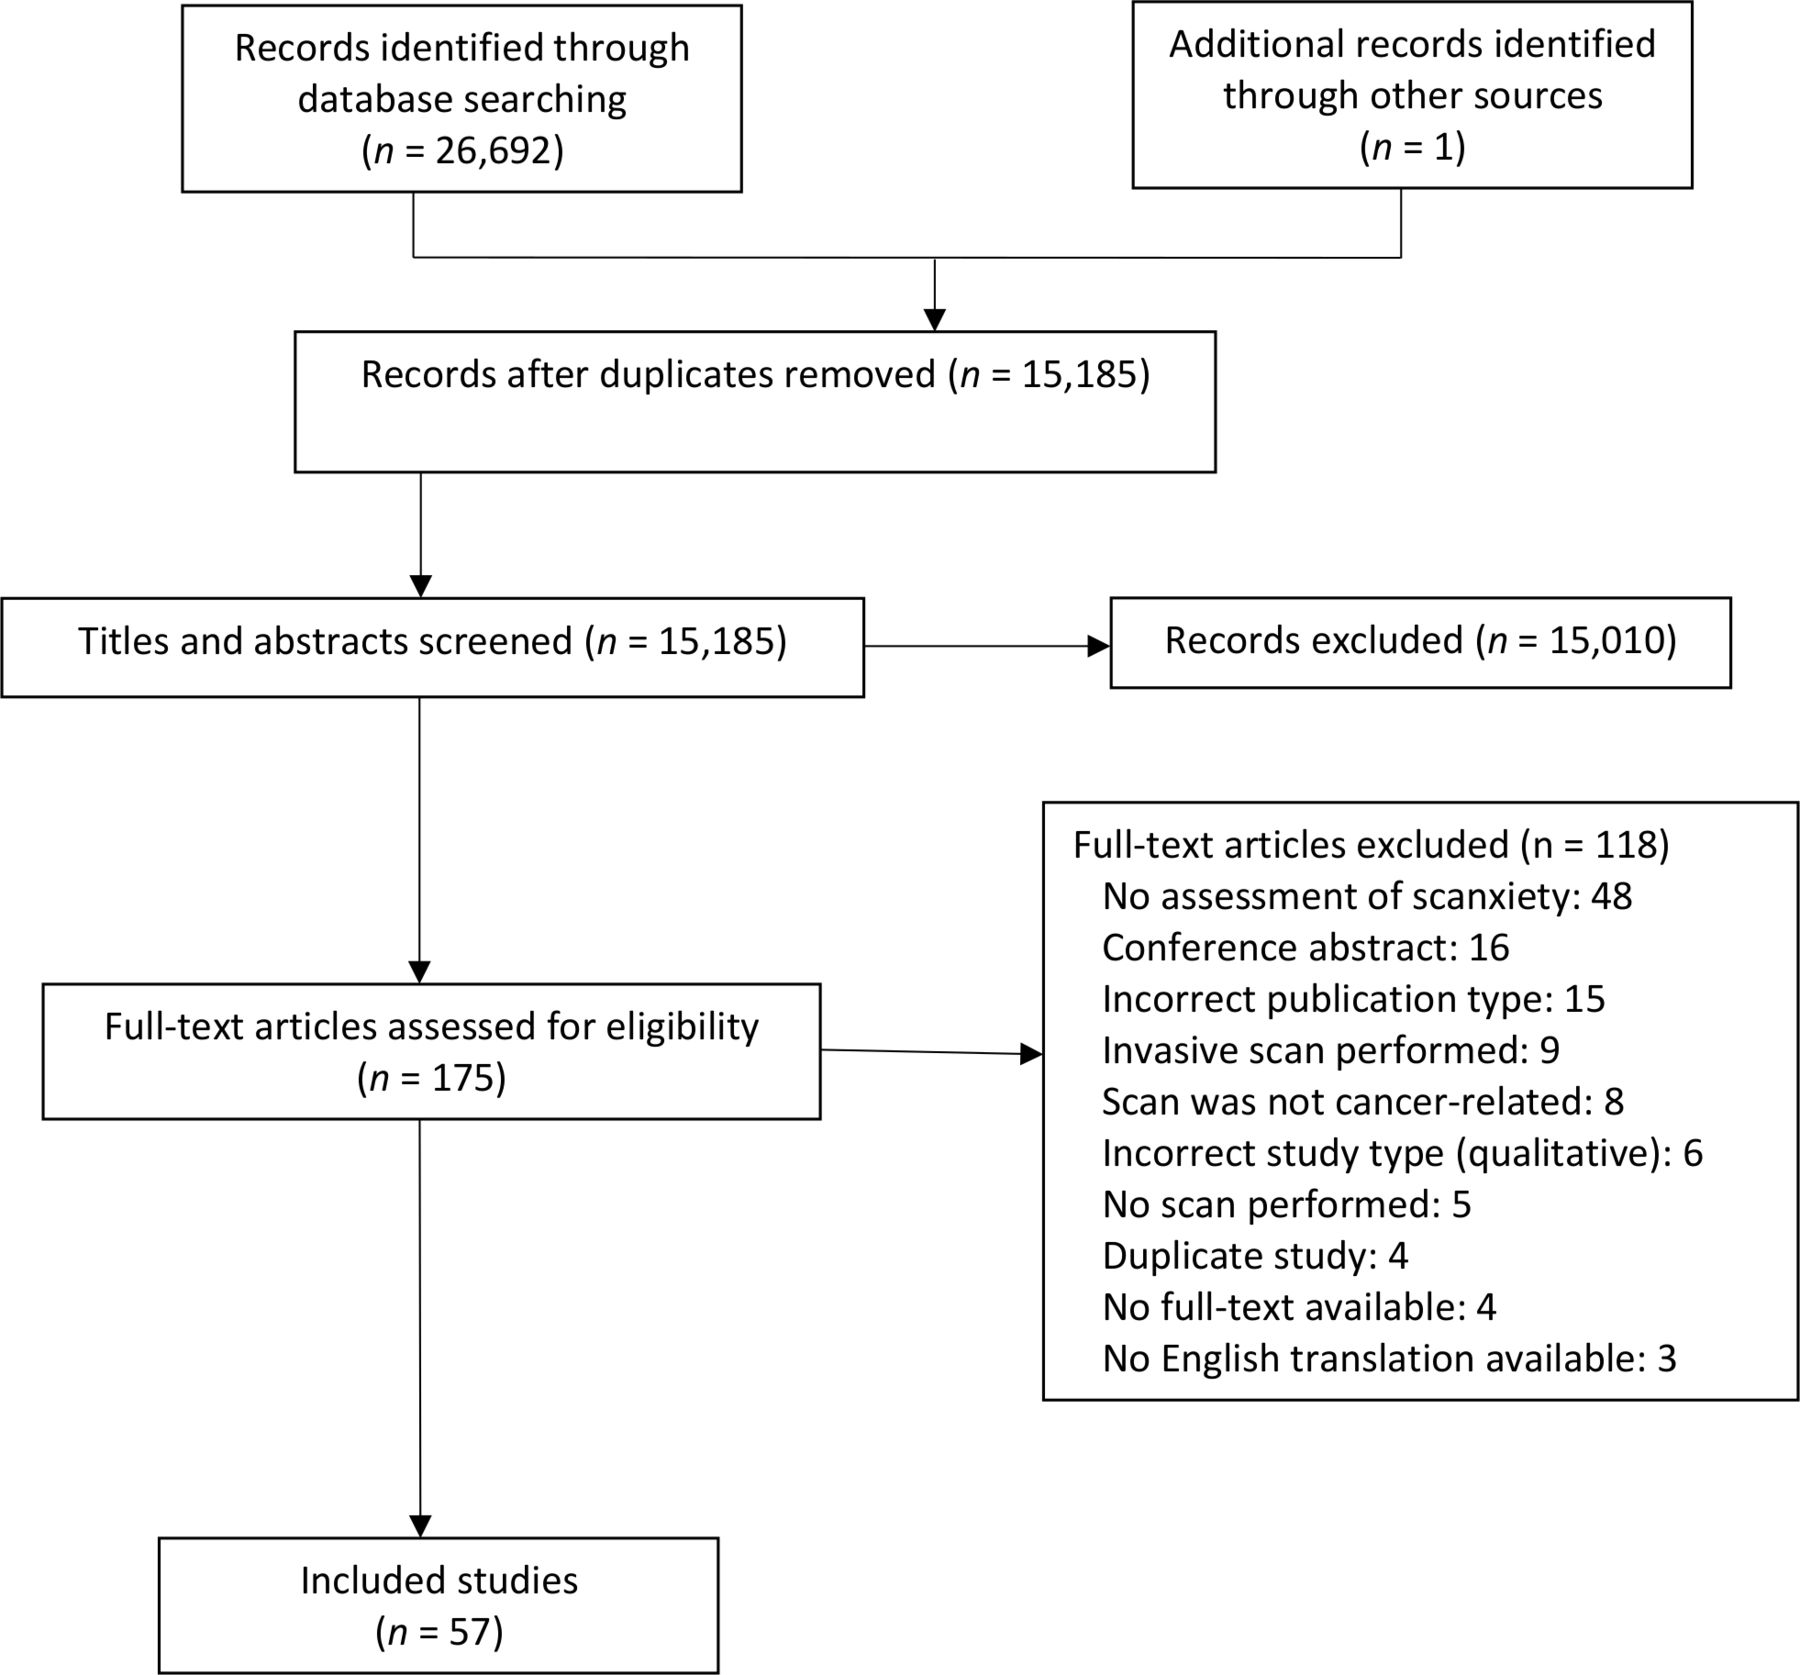
The study search identified 26 693 citations. The selection process is outlined in figure 2. After removal of duplicates, abstract and title screening, and full-text review, 57 eligible studies involving 21 352 people were included.
Study search and selection flow diagram.
Demographics and study details
Observational studies
There were 47 observational studies (table 1) involving 19 498 people.15–61 Participants most commonly had scans for breast cancer (22 studies, n=14 338 women16 18–27 29 31 36 38 40 42 43 45 48 56 58), the most common scans were mammograms (21 studies16 18–27 29 31 36 38 40 42 43 45 48 56), and most studies used self-report surveys to assess scanxiety (40 studies15 16 18–36 38 40–54 56 58 59).
Demographics and study details for the 47 observational studies
Twenty-one studies were conducted in people having scans for screening.15 16 18 20 21 24–27 29–32 35 38 43 45 54 57 58 61 In the remaining studies, reasons for scanning included diagnosis,23 48 staging,34 44 52 monitoring,49 55 60 surveillance to detect recurrence28 37 56 or a combination of reasons in people with known or suspected cancers (17 studies17 39 41 46 47 50 51 53 59). Five studies permitted scans for both screening and non-screening reasons (namely, diagnosis22 36 40 or surveillance19 42).
The mean age of participants, reported by 33 studies, was 56.9 years (range 38–66 years).20 21 25 26 28–33 35 36 39 41–48 50–61 The majority of participants were women (87%).15 16 18–61 When studies involving scans for breast cancer were excluded, there were similar proportions of men and women (women 49% and men 51%).15 27 28 30 32–35 37 39 41 44 46 47 49–55 57 59–61 There was variation in the reporting and proportion of participants who were married (22 studies, range 34%–97%20 21 24–26 29 31 32 34–38 41 45–49 54 56 58), who received at least secondary education (29 studies, range 10%–99%20–22 24–29 31 32 34 36 37 41–43 45–47 49–51 54 55 57–60) and who were attending their first scan (18 studies, range 0%–100%17 21 24 27 29 32 36 38 39 41 45 46 48 50 51 55 56 59).
Intervention studies
There were 10 intervention studies (table 2) involving 1854 people.62–71 This included people having scans for breast cancer (six studies, n=1449 people62–65 69 70) and lung cancer (one study, n=16 people68). Scans included mammogram (five studies62–64 69 70), positron emission tomography (PET) with CT (three studies66 67 71), MRI,65 CT68 and ultrasound70 (one study each). Four studies involved scans for screening,63 64 68 69 one for diagnosis,65 three for any reason in people with known or suspected cancers66 67 71 and two where scans for screening, surveillance and/or diagnosis were permitted.62 70
Demographics and study details for the 10 intervention studies to reduce scanxiety
The mean age of participants was reported by five studies and ranged from 47 to 65 years.63 65 68 69 71 The majority were women (94%62–66 68–71). There was variation in the reporting and proportion of participants who were married (two studies, 73% and 75%64 65), received at least secondary education (six studies, range 28%–100%62–65 68 69) and participants attending their first scan (five studies, range 4%–54%62–64 66 71).
Eight studies allocated participants to an intervention or control group,63–69 71 one study compared two interventions62 and one study delivered the intervention to all participants.70 Two interventions were multifaceted.64 65 Types of interventions included: relaxation, distraction and/or meditation (six studies62 63 66 69–71); education (four studies62 64 65 68); emotional or psychosocial support (two studies64 65); or adjustments to routine logistics of the scan (one study67).
Scanxiety measurement
Anxiety measurements varied across the studies, with different measurement tools, variants of the same tool, and different range and thresholds applied to tools.
Observational studies
The 47 observational studies (table 3) used a total of 81 measures of anxiety, with 30 studies using one measure only,15–19 21 22 25–28 30 33 34 36 39 40 43 44 46 48–51 53 55–57 59 61 and 17 studies using at least two measures.20 23 24 29 31 32 35 37 38 41 42 45 47 52 54 58 60
Prevalence and severity of scanxiety
The most common measures used were: purpose-designed Likert scales (17 studies); the State-Trait Anxiety Inventory (STAI) (14 studies); the anxiety subscale of the Hospital Anxiety and Depression Scale (HADS) (nine studies); the Impact of Event Scale (IES) (six studies); the Psychological Consequences Questionnaire (PCQ) (three studies), the Cancer Worry Scale (three studies); and the Perceived Stress Scale (two studies). There were 17 measures used by one study only.15 20 22 26 31 32 35 52 54 56 58 60
Likert scales were varied, with a numerical lower range limit of 0 or 1, and an upper range limit between 3 and 12.17 20 24 25 33 40 44 46 48 50 52 53 Seven studies used a descriptive range.21 25 27 28 33 34 55 Two studies used both a numerical and a descriptive range.25 33
The STAI compromises state and trait anxiety subscales with a possible subscale range of 20– 80. It has no validated anxiety threshold and is usually calculated as a sum of four-point response options.72 Included studies used and reported the STAI as a total score,37 39 using one or both subscales,20 23 36 37 41 42 47 51 57 59 or as a variant (eg, STAI-632 38 58). There were different ranges: none reported47 57 ; no reported lower limit41 ; no reported upper limit36 ; 0– 60;39 51 or based on a mean of individual item scores.20 Some studies prespecified an anxiety threshold of 39,57 40 and37 41 46,42 calculated based on the relationship between the anxiety and trait subscales,39 or based on investigator-determined categories.36 One study used a different method to calculate scores (ie, subtracting the points of reversed statements from direct statements, which were valued at 1, 2, 3 and 20, and then added to a constant of 5036).
The HADS anxiety subscale has a range of 0–21 and a validated anxiety threshold of 11.73 One study reported a range of 0–14,38 one study reported anxiety categories rather than a threshold,60 two studies reported an anxiety threshold of 841 43 and one study reported an anxiety threshold of 10 (though there was overlap the ‘tendency to anxiety’ and ‘anxiety’ categories, classified as scores of 8–10 and 10 or more, respectively).47
The IES was used in its original form30 32 38 42 58 or as a variant (IES-649) and was reported as a total score30 32 38 49 or as intrusion and avoidance subscale scores.42 58 The two studies using subscale scores reported threshold levels of 20 or 2142 and 8.5.58 When using the PCQ, researchers used either the emotional subscale18 or the negative consequences subscale.24 29 The Cancer Worry Scale and the Perceived Stress Scale were used in original45 61 or variant29 54 58 forms. The Symptom Checklist-90-Revised score could not be interpreted because the authors did not report a range,31 and a raw score or a transformed score could have been used.74
Intervention studies
The 10 intervention studies (table 4) used 19 measures of anxiety, with five studies using one measure only,62 66 67 69 70 and five studies at least two.63–65 68 71 The measures included subscales of the STAI (seven studies), Likert scales (five studies), a variant of the Psychological Consequences Questionnaire (one study68) and the Crown Crisp Experimental Index (one study65).
Effect of interventions to reduce scanxiety
Likert scales were varied, with a lower range limit of 0 or 1, and an upper range limit between 5 and 10.62 63 69–71 The STAI was used and reported using one or both subscales,63–65 67 68 71 or as a variant (eight-item STAI66). There was variation from the usual STAI parameters, with studies using a different range (ie, not reported,63 65 0–60,64 or 18–3266) or prespecified anxiety thresholds of 4068 or 16.66
Scanxiety outcomes
Prevalence and severity of scanxiety for each study are provided in table 3. Summary statistics for prevalence and severity were not calculated due to heterogeneity in the type and timing of measurement between the studies.
Prevalence of scanxiety
Twenty-four of the 47 studies reported the prevalence of scanxiety. The prevalence of scanxiety above prespecified anxiety thresholds ranged between 0% and 64% across the 16 measures,16 19 31 38 41 43 45 52 54 58 though eight of these measures came from only two studies.41 58 In the 14 measures without a prespecified anxiety threshold, the prevalence of any degree of scanxiety ranged between 13% and 83%.15 21 22 24 27 28 32–34 37 39 41 48 49
There were insufficient numbers to compare the prevalence of scanxiety using measures with prespecified anxiety thresholds of people having scans for screening (11 measures16 31 38 43 45 54 58), reasons other than screening (four measures41 52) and for screening or non-screening reasons (one measure19). When no threshold was reported, the prevalence of scanxiety had a similar range (screening 23%–81%, five measures15 21 24 27 32; reasons other than screening 14% to 83%, eight measures28 33 34 37 39 41 48 49 ; either screening or reasons other than screening 40%, one measure22).
Severity of scanxiety
Severity of scanxiety was reported in 44 of 47 observational studies. Mean severity scores appeared low in almost all measures, which quantitatively measured scanxiety (54/62, 87%).
The mean severity scores were below prespecified anxiety thresholds on 17 of the 19 measures where a threshold was reported.16 31 37 38 41–43 45 47 54 57 58 The two exceptions were observed in a study comparing people with TP53 mutations (‘carriers’) to controls, with all participants undergoing screening scans. In carriers, mean scores were maximally 11.4 (IES intrusion subscale, threshold 8.5) and 13.3 (IES avoidance subscale, threshold 8.5). Mean severity scores for controls were below the thresholds.58
Of the 43 measures without a prespecified threshold, the majority had mean scores that were less than half the total scores.15 18 20 23–26 29 30 32 33 35 37 38 44–46 49 52–54 56 58 60 61 There were six exceptions, which reported maximal mean severity scores of: 5.5 out of 10 (Likert scale)17; 6.4 out of 10 (Likert scale)50; 4.1 out of 7 (Likert scale),40 33 out of 60 (STAI state anxiety subscale),51 8.1 out of 14 (Health Questionnaire)58; and 51.75 out of 80 (STAI).59 Four of these scores occurred in studies where scans were performed for reasons other than screening,17 50 51 59 one allowed scans for diagnosis or screening40 and one allowed scans for screening only.58
Eight measures used a descriptive range of severity, with more severe levels of scanxiety in 4%–28% of participants.21 22 25 27 28 33 34 55
Four measures could not be interpreted because they failed to report a range and anxiety threshold.31 36 47
Scanxiety before and after a scan
Of the 20 studies that reported a prescan and postscan scanxiety measurement, 14 studies reported a statistical comparison16 18 20 29–32 35 38 50 51 57–59 and six did not23–26 42 60 (table 3). There was variation in the timing of scanxiety measurement before a scan from 4 weeks before the scan until immediately before the scan, and after a scan from immediately after the scan until 1 year after the scan. Five studies reported a postscan reduction in scanxiety severity compared with prescan levels.16 29 30 32 50 59 Two studies reported an increase in postscan scanxiety severity51 57 and two studies no difference in prescan and postscan scanxiety severity.18 31
Four studies reported mixed findings on the change in scanxiety severity across different measures (table 5).
Studies with discrepant results on prescan and postscan scanxiety severity using different measures
Although Bancroft et al58 reported a reduction in scanxiety severity using HADS (anxiety subscale), there was no difference in scanxiety prevalence.
Contributing factors to scanxiety
Multiple comparisons were made between scanxiety and possible contributing factors across the included studies (table 6).
Contributing factors to scanxiety
In summary, higher scanxiety severity was associated with people with:
Lower education (compared with higher education, eight of 14 studies22–24 27 36 37 42 43 49 51 59 62 63 69).
A history of smoking (compared with non-smoking, three of five studies40 43 47 49 54).
Higher pain levels during the scan (compared with no pain, all six studies22 23 25 27 62 69).
Higher perceived risk of cancer (compared with lower perceived risk of cancer, all three studies27 30 42).
Diagnostic scans (compared with screening scans, all three studies36 41 62).
The prevalence or severity of scanxiety was not consistently affected by age (13 of 19 comparisons20 22 24 27 28 36 37 41–43 45 49–51 59 62 63 70), gender (6 of 11 comparisons28 37 39 41 47 49–51 57 59), ethnicity (five of seven comparisons22 24 27 37 40 49 63), income (all three comparisons27 37 49), marital status (five of six comparisons24 36 37 42 49) or having children (all three comparisons24 37 43).
Inconclusive results occurred in the following comparisons:
Employment (unemployed compared with employed, four of six comparisons23 27 37 41–43).
Scan-naivety (first scan compared with subsequent scans, six of 13 comparisons19 24 25 27 36 38 39 41 50 51 62 66 67).
Risk of cancer (higher compared with lower risk of cancer, 7 of 19 comparisons15 24 27 36 37 40 42 45 58).
Although nine studies reported differences in scanxiety between different imaging modalities, the number of comparisons between specific scans were insufficient to draw conclusions.33 34 41 42 44 48 52 53 59
Interventions that reduce scanxiety
Five of the 10 intervention studies showed a reduction in scanxiety compared with controls.64–67 71 Four studies reported no difference in scanxiety between the intervention arms.62 63 68 69 The study where all participants received the same intervention showed a reduction in anxiety.70 Details of these results are listed in table 4.
Both multifaceted interventions studies incorporating education and emotional or psychological support showed a reduction in scanxiety.64 65
Of the six studies with relaxation, distraction and/or meditation components, three studies showed a reduction in scanxiety,66 70 71 while three studies did not.62 63 69
Interventions with only educational components did not show a reduction in scanxiety.62 68
A reduction in scanxiety severity was also observed when a handheld device was available to communicate with radiology staff. This reduction was observed in the subgroup of participants who had had a previous scan but not in participants having their first scan.67
Discussion
This is the first systematic scoping review aimed at quantifying the phenomenon of scanxiety in people having cancer-related scans. Scanxiety is a common and important clinical problem, as supported by the large number of studies identified by our search. There is a wide range of reported scanxiety prevalence (0%–83%), and scanxiety is generally not severe. Severity of scanxiety may be lower after a scan and is higher in people who have a lower education, currently smoke, experience pain during a scan, have higher perceived risk of cancer and who are having diagnostic (rather than screening) scans. Interventions may be more likely to reduce scanxiety if they involve active participation (eg, psychological and emotional support, meditation or a handheld communication device) rather than passive participation (listening to music or education only).
Firm conclusions about prevalence and severity could not be drawn due to considerable methodological heterogeneity of the included studies, especially in relation to scanxiety measurement tools. None were designed and validated for scanxiety, and some tools and their thresholds were not designed and/or validated for anxiety. This review did use purpose-designed definitions of prevalence and severity to allow some comparison between studies; however, the lack of a universal definition or specific measurement tool for scanxiety limits confidence in the interpretation of the results and interstudy comparisons. This highlights the need for a universally accepted measure to quantify scanxiety and evaluate scanxiety interventions in the future. A recent literature review by Al-Dibouni75 provided a narrative overview of scanxiety in people having scans for any reason and also recognised the lack of a specific measurement tool for scanxiety and variable scanxiety prevalence among studies.75
Given the STAI and Likert scales were the most common tools used, we propose that future studies use the state anxiety subscale of the STAI, with a range of 20–80 and no specific anxiety threshold72 (or variants, such as the STAI-676), and/or the distress thermometer, with a range of 0–10 and a clinically significant threshold of ≥4,77 to measure scanxiety. These tools can be combined with other validated anxiety measures, such as the HADS, to further refine the relationship between tools. Using existing measures rather than developing a scanxiety specific tool allows scanxiety assessment to occur immediately and broadly in clinical research.
Strengths of this scoping review include the rigorous methodology using a published framework,12 13 two independent researchers for study selection and data extraction and the implementation of a comprehensive search strategy and broad inclusion criteria to achieve an exhaustive review of the available literature. Limitations include the use of purpose-designed definitions of prevalence and severity and the limited generalisability of the results due to heterogeneity in cancer type, reason for scan, imaging modality and timing of scanxiety measurement between the studies and because the search strategy was restricted to English language databases. Finally, scanxiety in people who were recalled after an abnormal screening result were excluded from this review due to confounding and feasibility. These populations may be at higher risk of scanxiety, and further research may provide further insight about the scanxiety experience in this population.
Additional research implications of our review include the need for research into high-risk populations for scanxiety, including people with advanced cancer. This population was included in only three studies49 55 60; however, people with cancer have higher rates of anxiety compared with the general population.78 As they may be more likely to develop scanxiety, experience more severe scanxiety, or have higher postscan scanxiety while waiting for scan results, longitudinal assessment of scanxiety is required. Further research into effective and feasible interventions is also required, though these will face implementation challenges due to variations in health systems and available resources.
Conclusions
Prevalence and severity of scanxiety varied widely, although heterogeneity in scanxiety measurement interpretation. A uniform approach to evaluating scanxiety will improve understanding of the phenomenon and help guide the development of interventions to high-risk populations.
Data availability statement
Data are available on reasonable request. All data relevant to the study are included in the article or uploaded as supplemental information. The additional data are the data extraction forms for each study.
References
Supplementary materials
Supplementary Data
This web only file has been produced by the BMJ Publishing Group from an electronic file supplied by the author(s) and has not been edited for content.
Footnotes
Twitter @ktambui
Contributors KTB, PB, BEK, HD and CB contributed to the concept and design of this review. KTB developed and implemented the search strategy. KTB and RL independently screened and reviewed titles, abstracts and full-text articles for inclusion. KTB and RL independently extracted data from the included studies. PB, BEK, HD and CB contributed content expertise to ensure clinically relevant interpretation of the data. KTB drafted the initial manuscript, and RL, PB, BEK, HD and CB reviewed and approved the manuscript prior to submission.
Funding The authors have not declared a specific grant for this research from any funding agency in the public, commercial or not-for-profit sectors.
Competing interests None declared.
Provenance and peer review Not commissioned; externally peer reviewed.
Supplemental material This content has been supplied by the author(s). It has not been vetted by BMJ Publishing Group Limited (BMJ) and may not have been peer-reviewed. Any opinions or recommendations discussed are solely those of the author(s) and are not endorsed by BMJ. BMJ disclaims all liability and responsibility arising from any reliance placed on the content. Where the content includes any translated material, BMJ does not warrant the accuracy and reliability of the translations (including but not limited to local regulations, clinical guidelines, terminology, drug names and drug dosages), and is not responsible for any error and/or omissions arising from translation and adaptation or otherwise.