Article Text

Abstract
Objectives Evaluate the accuracy of the Breast Cancer Risk Assessment Tool (BCRAT), International Breast Cancer Intervention Study risk evaluation tool (IBIS), Polygenic Risk Scores (PRS) and combined scores (BCRAT+PRS and IBIS +PRS) to predict the occurrence of invasive breast cancers at 5 years in a French-Canadian population.
Design Population-based cohort study.
Setting We used the population-based cohort CARTaGENE, composed of 43 037 Quebec residents aged between 40 and 69 years and broadly representative of the population recorded on the Quebec administrative health insurance registries.
Participants 10 200 women recruited in 2009–2010 were included for validating BCRAT and IBIS and 4555 with genetic information for validating the PRS and combined scores.
Outcome measures We computed the absolute risks of breast cancer at 5 years using BCRAT, IBIS, four published PRS and combined models. We reported the overall calibration performance, goodness-of-fit test and discriminatory accuracy.
Results 131 (1.28%) women developed a breast cancer at 5 years for validating BCRAT and IBIS and 58 (1.27%) for validating PRS and combined scores. Median follow-up was 5 years. BCRAT and IBIS had an overall expected-to-observed ratio of 1.01 (0.85–1.19) and 1.02 (0.86–1.21) but with significant differences when partitioning by risk groups (p<0.05). IBIS’ c-index was significantly higher than BCRAT (63.42 (59.35–67.49) vs 58.63 (54.05–63.21), p=0.013). PRS scores had a global calibration around 0.82, with a CI including one, and non-significant goodness-of-fit tests. PRS’ c-indexes were non-significantly higher than BCRAT and IBIS, the highest being 64.43 (58.23–70.63). Combined models did not improve the results.
Conclusions In this French-Canadian population-based cohort, BCRAT and IBIS have good mean calibration that could be improved for risk subgroups, and modest discriminatory accuracy. Despite this modest discriminatory power, these tools can be of interest for primary care physicians for delivering a personalised message to their high-risk patients, regarding screening and lifestyle counselling.
- breast tumours
- epidemiology
- genetics
- preventive medicine
- public health
Data availability statement
Data may be obtained from a third party and are not publicly available. The data that support the findings of this study are available from CARTaGENE but restrictions apply to the availability of these data. Data are, however, available directly from CARTaGENE (http://cartagene.qc.ca; access@cartagene.qc.ca; +1 514-345-2156).
This is an open access article distributed in accordance with the Creative Commons Attribution Non Commercial (CC BY-NC 4.0) license, which permits others to distribute, remix, adapt, build upon this work non-commercially, and license their derivative works on different terms, provided the original work is properly cited, appropriate credit is given, any changes made indicated, and the use is non-commercial. See: http://creativecommons.org/licenses/by-nc/4.0/.
Statistics from Altmetric.com
Strengths and limitations of this study
First study to evaluate risk assessment tools in a French-Canadian population for predicting breast cancer.
Population based-cohort representative of the French-Canadian urban population of middle-aged and older adults.
Linkage with administrative health databases and the Quebec Breast Cancer Registry, which improved the outcome quality and accuracy, and made possible to use variables usually difficult to obtain.
May not apply to younger women under 40 years old.
Since the genotyping information was not available for all the cohort, the models had to be evaluated on two different subcohorts.
Introduction
Breast cancer is the most frequently diagnosed cancer and the second leading cause of death by cancer among the Canadian women.1 However, assessing the individual risk of breast cancer remains a challenge. In this context, risk prediction models have been developed and implemented. The two most widely used are the Breast Cancer Risk Assessment Tool (BCRAT) and the International Breast Cancer Intervention Study risk evaluation tool (IBIS).2 3
The National Cancer Institute’s (NCI) BCRAT was developed by Gail et al2 using 5998 American women from a case-control study. It provides an estimate of a woman’s risk of developing invasive breast cancer over a specific period, knowing her personal risk factors. After its first release, this model has been validated in an American cohort,4 mainly composed of white women, and was later calibrated for African American, Hispanic, Asian and Pacific Islander women.5 6 The most recent version uses six clinical risk factors: current age, age at first menstrual period, age at first live birth, number of first-degree relatives with breast cancer, history of previous breast biopsy and ethnicity. Several studies have assessed or updated the BCRAT model to specific populations (eg, Asian, Oceanian).7 It is worth noting that this model, designed for use in the general population, is not intended to be used for women carrying inherited BRCA1/2 mutations. The BCRAT model is used to guide physicians on breast cancer prevention strategies. As an example, the US Food and Drug Administration recommended to consider chemoprevention for women at high risk of breast cancer (ie, a 5-year risk equal or higher than 1.66%), while the US Preventive Services Task Force recommended chemoprevention for a risk equal or higher than 3%.8 The Canadian Task Force, as well as the Canadian Cancer Society, used a threshold of 1.66%.9 10 Despite its implementation on the NCI’s website (bcrisktool.cancer.gov/), the lack of recent Canadian guidelines combined with its US-centred use led to an underuse of the BCRAT model by Canadian primary care physicians. Indeed, a recent qualitative study showed that two-third of primary care physicians from two Canadian provinces (Ontario and Alberta) were unaware of the BCRAT tool.11
The IBIS model, also known as the Tyrer-Cuzick model, is also a widely used breast cancer risk prediction model, which takes into account multigenerational family history data and BRCA1/2 mutation information. It has been developed with data from the International Breast Cancer Intervention Study including a cohort of daughters of patients diagnosed with the disease and has focused on the estimation of breast cancer lifetime risks through the analysis of family history, reproductive and hormonal factors, and individual characteristics.3 The IBIS model takes into account non-genetic risk factors (current age, age at menarche, number of live births, age at first live birth, age at menopause, height, weight, history of hyperplasia, breast density, history and age of ovarian cancer, hormone replacement therapy) together with multigenerational pedigree information and BRCA1/2 gene mutations. IBIS can be used even for women without a family history of breast cancer and without BRCA1/2 gene mutations information. A recent study suggested that IBIS has better ability to assess breast cancer risk than BCRAT but with close performance in women not known to have mutations in BRCA1 or BRCA2 genes.12–14
With the increasing availability and affordability of genetic information, there is a growing interest to incorporate individual-level genotype data into risk prediction models for increasing their discriminatory accuracy. The integration of such information into the BCRAT model has already been performed with the addition of seven single-nucleotide polymorphisms (SNPs) associated with breast cancer. Results showed that the performance of the predicted breast cancer’s risk was slightly improved, with an area under the receiver operating characteristic (ROC) curve (AUC) increasing from 0.607 to 0.632.15 This kind of clinicogenetic model has also been done with IBIS leading to an improvement in the discriminative ability.16 Alongside these works, many genetic based or ‘Polygenic Risk Scores’ (PRS) have been published for breast cancer prediction. Most of them rely on linear combinations of the risk-conferring variant alleles weighted by their effect sizes.17–20 The list of these risk alleles with their corresponding weights is usually obtained from large case–control genome-wide association studies,21 with weights that can be adapted to specific ethnicities.19 The predictive accuracy of these PRSs compared with classical prediction models, such as the BCRAT and IBIS, should now be evaluated in various populations.
In Quebec, the Breast Cancer Screening Programme consists of a mammogram every 2 years for women aged 50–69.22 Although this screening decreased the number of deaths from breast cancer,23 it could be stressful with non-negligible costs for the public health system. In this context, risk assessment tools could be helpful for primary care physicians to enhance screening uptake among high risk patients who are less likely to participate in organised screening. Some previous studies have assessed the accuracy of the BCRAT risk predictions in Canadian women,12 24 but they were limited to specific ethnic populations or were part of multicountries cohorts. The fact that BCRAT and IBIS have not been evaluated in the French-Canadian population, which has specific genetic patterns, as compared with the general European population,25 26 with lifestyle risk factors (eg, nutrition) that are at the intersection between North America and Europe, prompted us to evaluate their predictive abilities in the population-based cohort CARTaGENE from Quebec.
In this study, we report the predictive accuracies of the BCRAT model, the IBIS model and PRS to predict the occurrence of invasive breast cancers at 5 years in middle-aged and older French-Canadian women.
Materials and methods
Design and participants selection
The CARTaGENE population-based cohort is composed of 43 037 Quebec residents aged between 40 and 69 years, recruited during two phases (2009–2010 and 2013–2014). With a rich collection of data including phenotyping and genotyping data, CARTaGENE is the largest ongoing prospective population cohort and biobank in Québec, Canada.27 Details on recruitment and sample selection have been described previously.27
To comprehensively identify participants with an invasive breast cancer and the incidence date, we used two administrative health databases, the Quebec Health Insurance Board (RAMQ) and the Quebec Breast Cancer Registry (see oonline supplemental methods 1), and an algorithm based on a previous report from the Institut National de Santé Publique du Québec28 and the Tonelli et al29 algorithm. Using the Breast Cancer Registry, we retrieved the incidence date of histologically confirmed breast cancers. Then, as some women with a breast cancer might not have a histologically confirmed cancers in the Breast Cancer Registry, we selected in this registry all women having an abnormal mammography (ie, lesion suspected of malignancy) without histologically confirmed breast cancers and retrieved, when available, the incidence date after the abnormal mammography from the RAMQ database for women with at least two claims in 2 years or one hospitalisation with the appropriate International Classification of Diseases, 9th or 10th Revision codes (174 and C50). The Quebec breast cancer registry’s data were available from 15 May 1998 to 31 December 2017, while the RAMQ’s data were available from 1 January 1998 to 31 March 2016. Adherence to mammography was not available.
Supplemental material
For this study, we have considered the women without a breast cancer before the inclusion date from the CARTaGENE first phase of recruitment as the family history of breast cancer was not available for the participants of the phase 2. Recruitment was unrelated to the last mammography screening. The validation of the BCRAT and IBIS models was done on the subcohort of 10 200 women with available information for computing the BCRAT and IBIS models (hereinafter referred as clinical-based cohort (CC)). The validation of the PRS was done on the subcohort of 4555 women with available genotyping information (hereinafter referred as clinicogenetic-based cohort (CGC)) (figure 1). We also compared PRS to the BCRAT and IBIS models on the CGC cohort.

Flow chart. BCRAT, Breast Cancer Risk Assessment Tool; IBIS, International Breast Cancer Intervention Study.
Genetic data
Only a fraction of the CARTaGENE population cohort has been genotyped. These participants were selected to be genotyped through various scientific projects unrelated to breast cancer.30–32 SNP positions were based on build GRCh37/hg19. The detailed pipeline about quality control and imputation can be found at www.cartagene.qc.ca/info-genetic-data and in online supplemental methods 1.
Outcome
The outcome of interest was the time of occurrence of the breast cancer from the enrollment in the cohort. Patients without breast cancer occurrence were censored at the end of the 5 years study period (administrative censoring) or at death.
Predictive scores
Absolute risk using the BCRAT and the IBIS models
The absolute risk of breast cancer estimated by BCRAT and IBIS is calculated using baseline hazard functions calculated from the marginal hazard functions (USA and UK incidence rates, respectively), and the attributable risk obtained from the United States population data (BCRAT) and the UK/Swedish population data (IBIS). In this article, the BCRAT and IBIS absolute risks of breast cancer at 5 years were calculated for each woman at the inclusion date using the National Institutes of Health R package ‘BCRA’, V.2.133 and the latest version of the ‘IBIS Breast Cancer Risk Evaluation Tool’ (http://www.ems-trials.org/riskevaluator/—V.8.0b, September 2017), respectively. Death as a competing risk was taken into account for both models.
All variables of the BCRAT model could be retrieved, while some variables of the IBIS model were not available and were considered missing: breast density, Ashkenazi Jewish heritage, HRT type, length of time woman intends to use HRT in the future, BRCA1/2 genetic testing (participant and relatives), mother bilateral mastectomy, relatives’ age of breast and ovary cancers, variables related to each sister, brother, grandmother, aunt, uncle and daughter. See online supplemental methods 1 for information about variables extraction and coding. Missing data can be handled in both BCRAT and IBIS models.
Absolute risk using PRS
For estimating the absolute risk of breast cancer using PRS, we have considered the procedure implemented in the iCARE package.34 It requires the marginal (composite) rates for breast cancer and death, obtained here from Canada Health,35 36 and the relative risk distribution, obtained from the sampling at random of 10% of the individuals from the CGC with small probability weights for the breast cancer cases. We reported the results obtained using the 90% remaining (hereinafter referred as ‘validation CGC’).
In this study, woman’s genotyping information were used for computing four different published PRS: Wacholder et al17 (10 SNPs), Mavaddat et al18 (77 SNPs), Shieh et al19 (86 SNPs) and Evans et al20 (18 SNPs). In the following, each PRS is referred to the name of the first author of the study. The SNPs and associated OR can be found as online supplemental table 1.
Supplemental material
Absolute risk using a combination of BCRAT and PRS
For estimating the absolute risk of breast cancer with a combination of BCRAT and PRS (hereinafter referred as ‘combined scores’), we summed the PRS and BCRAT scores (relative hazard regression scores), and used the same procedure as described in the section ‘Absolute risk using PRS’.
Absolute risk using a combination of IBIS and PRS
As the clinical risk score obtained from the IBIS model is not an output of the software, we cannot estimate the absolute risk associated with a combination of the IBIS clinical risk score and PRS using the iCARE package in the same way we did for BCRAT (see above). In practice, the V.8.0b of the IBIS risk evaluation tool allows to compute the absolute risk by incorporating the PRS scores, but these absolute risks are different from the ones that would be obtained with the iCARE package. Keeping in mind this issue, we have used the IBIS breast cancer risk evaluation tool and incorporate the PRS scores. More precisely, and for taking into account the distribution of the PRS, we incorporated a shifted PRS that corresponds to the PRS minus the logarithm of the expected value of the relative risk associated to the PRS in our population. This latter transformation is due to the fact that the baseline hazard rate can be approximated by the composite hazard divided by the expected value of the relative risk score in the underlying population.34
Statistical analysis
For comparing means between groups, we used a one-way analysis of variance test. Relationships between categorical variables were tested using the χ2 test. Statistical significance was considered as p<0.05. We plotted predictiveness curves (ie, the risk quantile against the corresponding cumulative proportion of the population with risks below this quantile) with rug plots.
To assess the performance of the BCRAT, IBIS and PRS procedures for predicting invasive breast cancer risk, we reported calibration performance and discriminatory accuracy (see hereafter). We also reported the results obtained with the BCRAT and IBIS procedures in the validation CGC.
Calibration
We computed the expected-to-observed ratio (E/O), with the 95% CI, from the sum of the estimated risk divided by the number of observed cases. An E/O of 1 corresponds to perfect global calibration. We reported the intercept and slope estimates from logistic regression models (observed outcomes with the logit of the predicted probabilities as the independent variable).
We also compared the predicted and observed proportion of breast cancers in four absolute risk groups: <1% (low risk), ≥1% and <1.66% (intermediate risk), ≥1.66% and <3% (average risk), ≥3% (high risk). The observed proportion at 5 years in each risk group was calculated using a Kaplan-Meier estimator. To test the null hypothesis of a global agreement between the observed and expected values across these groups, we computed a global test statistic ( ) where Oi and Ei are respectively the observed and expected number of events in group i, and compared this latter to the critical value from the χ2 distribution with four df.
Discrimination
The global discrimination was assessed by the c-statistic with an inverse probability of censoring weighting (IPCW) estimation of cumulative time-dependent ROC curve with their 95% CI.37–39 ROC curves were plotted.
In the validation CGC, the c-indexes calculated with the BCRAT and IBIS scores were compared with those calculated with each PRS scores by using the independent and identically distributed-representation of the c-index estimators.39
Sensitivity and specificity
Since the Canadian recommendation for chemoprophylaxis is a BCRAT absolute risk of breast cancer of 1.66% or higher at 5 years, we calculated sensitivity and specificity using this threshold.
All statistical analyses were performed using R software, V.3.6.40
Patient and public involvement
Patients or the public were not involved in the design, conduct, reporting or dissemination plans of this study. However, the CARTaGENE cohort received an ethical approval from thirteen ethics committees before its development and implementation. Each ethics committee includes participants and public representatives, which had the opportunity to ask questions and make recommendations.
Results
Overall, 10 200 women were included for validating the BCRAT and IBIS scores and 4555 women with available genotype data were selected for the validation of the PRS scores and combined scores (figure 1). The median age was 53.1 years (quartile: 47.8–60.4) and 53.1 years (quartile 48–60.1) for the participants of CC and CGC, respectively. The median follow-up time was of 5 years in both cohorts. We observed 131 (1.28%) and 58 (1.27%) women developing a breast cancer for the CC and CGC, respectively. In total, there was 42 (0.41%) and 11 (0.24%) deaths during the 5 years follow-up, for the CC and CGC, respectively. The clinical characteristics of the two cohorts can be found in online supplemental table 2.
Supplemental material
Breast cancer risk prediction models (BCRAT and IBIS) evaluated in the CC
Using the BCRAT model, 19.8% of women were classified into the group with an absolute risk equal or higher than 1.66% (figure 2A). There was a global agreement between the predicted and observed number of breast cancer incident cases, with an E/O of 1.01 (0.85–1.20). However, the goodness-of-fit test for the four risk groups showed a significant difference between observed and expected values (p=0.0439). Among the four risk groups, the E/O was significantly different from one for the average risk group (E/O: 1.51% (1.01–2.28)). There was also a slight overestimation in the high-risk group (figure 2B). This finding was in agreement with the estimate values obtained from the calibration plot with an intercept lower than zero (intercept: −1.9 (-3.4– -0.4)) and a slope smaller than 1 (slope: 0.6 (0.2–0.9)). The BCRAT model had a modest discriminatory accuracy, with a c-index of 58.63 (54.05–63.21) (figure 2C). The sensitivity and specificity for the 1.66% threshold were 23.7% (16.7–31.9) and 80.3% (79.5–81), respectively.

Absolute risk distribution and performance of the BCRAT and IBIS models in the clinical-based cohort. (A) Distribution of models’ predictions as a function of cumulative percentage of women. Rug plot on the y-axis. (B) Calibration according to the models’ predictions groups. P values were computed using a goodness-of-fit test statistic compared with the critical value from the χ2 distribution. (C) Discrimination power of the models according to sensitivity and specificity. C-index was calculated using the inverse probability of censoring weighting estimation of cumulative time-dependent ROC curve. BCRAT, Breast Cancer Risk Assessment Tool; E/O, expected-to-observed cases; IBIS, International Breast Cancer Intervention Study; ROC, receiver operating characteristic.
Using the IBIS model, 18.0% of women were classified into the group with an absolute risk higher or equal to 1.66% (figure 2A). There was also a global agreement between the predicted and observed number of breast cancer incident cases, with an E/O of 1.02 (0.86–1.21). However, the goodness-of-fit test for the four risk groups showed a significant difference between observed and expected values (p=0.0056). The IBIS risk prediction score overestimated the number of cases in the low risk group (E/O: 2.38 (1.35–4.19)) and underestimated the number of cases in the intermediate risk group (E/O: 0.78 (0.63–0.97)), while the E/O were non-significant in the two higher risk groups (figure 2B). The intercept and slope were not significantly different from zero and one, respectively (0.4 (-1.3–2) and 1.1 (0.7–1.5), respectively). The IBIS model produced a slightly better discriminatory accuracy than BCRAT, with a c-index of 63.42 (59.35–67.49) (p=0.013) (figure 2C). The sensitivity and specificity for the 1.66% threshold were 26.7% (19.4–35.2) and 82.1% (81.3–82.8), respectively.
Breast cancer risk prediction models (BCRAT, IBIS, PRS and combined scores) evaluated in the clinicogenetic-based validation cohort
Results obtained in the validation CGC cohort that included participants with all the genetic and clinical information are reported in tables 1 and 2.
Comparison of BCRAT, IBIS and PRS scores using the clinicogenetic-based validation cohort
Comparison of BCRAT, IBIS and combined scores using the clinicogenetic-based validation cohort
In this subcohort, BCRAT and IBIS models classified 21% and 18.5% of women into the two higher risk groups, respectively. There was a global agreement between the predicted and observed number of breast cancer cases, with an E/O of 0.94 (0.73–1.22) and 0.94 (0.73–1.22), respectively. The discriminatory accuracy of the BCRAT and IBIS models were of 59.13 (52.96–65.29) and 59.63 (53.26–66), respectively.
Using the Mavaddat, Shieh, Evans and Wacholder PRS scores, 18%, 19%, 15% and 13.5% of women were classified into the group with an absolute risk equal or higher than 1.66%, respectively (online supplemental figure 1). All the PRS scores had an E/O around 0.82, with a 95% CI including one (table 1). None of the goodness-of-fit test showed a significant departure from the null hypothesis (figure 3). The intercepts and slopes for the calibration plot were not significantly different from 0 and 1, respectively (table 1).
Supplemental material
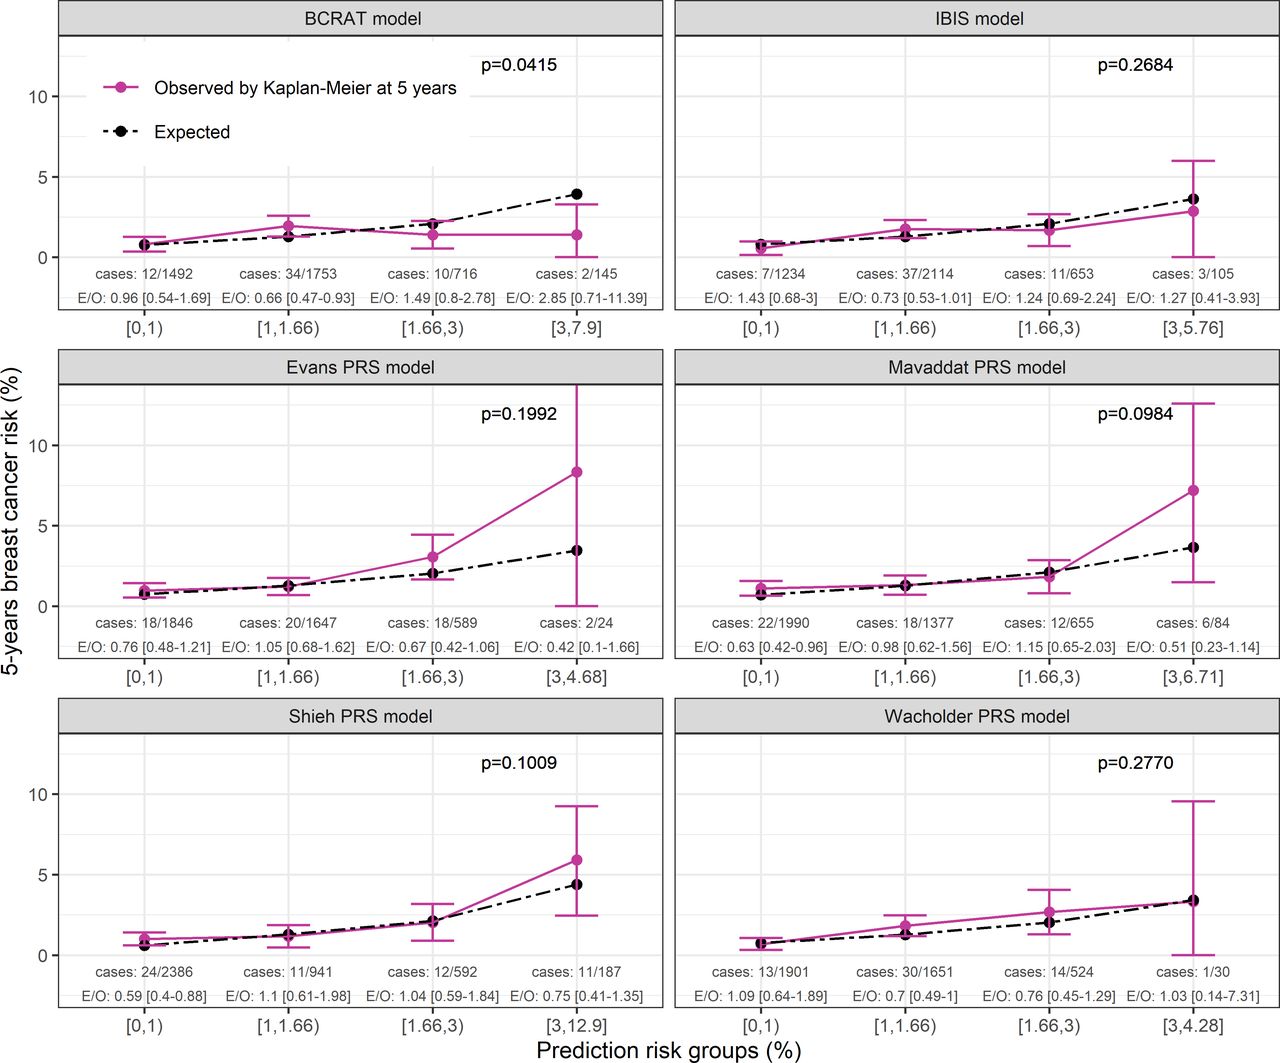
Calibration according to BCRAT, IBIS and PRS scores’ predictions groups. Results from the clinicogenetic-based cohort. P values were computed using a goodness-of-fit test statistic compared with the critical value from the χ2 distribution. Each PRS models name referred to the first author of the study from which the PRS were derived. BCRAT, Breast Cancer Risk Assessment Tool; E/O, expected-to-observed cases; IBIS, International Breast Cancer Intervention Study; PRS, Polygenic Risk Scores.
The PRS’ c-indexes were all slightly higher than those obtained from the BCRAT and IBIS scores, Wacholder score leading to the highest c-index (64.27 (58.09–70.44)). However, none of the c-indexes was statistically different from the ones computed with the BCRAT and IBIS models (table 1). The discrimination for women at higher risk was better for the Shieh, Evans and Mavaddat PRS scores compared with BCRAT and IBIS scores (down-left corner of the ROC curves, online supplemental figure 2). Using a 1.66% threshold, all PRS scores increased both the sensitivity and the specificity as compared with the BCRAT and IBIS risk prediction score (table 1).
Supplemental material
The distribution of the combined models’ absolute risks can be found in online supplemental figure 1. All the BCRAT +PRS combined models had an E/O around 0.84, with all 95% CI including one (table 2). The goodness-of-fit test using the four risk groups showed a significant departure from the null hypothesis for the Wacholder and Evans combined models (p=0.0475 and p=0.0470, respectively) (figure 4). While the Mavaddat and Shieh combined models underestimated the number of cases in the low risk group (E/O: 0.62 (0.41–0.93) and 0.63 (0.42–0.96), respectively), the Evans and Wacholder combined models underestimated the number of cases in the intermediate risk group (E/O: 0.58 (0.39–0.85) and 0.64 (0.43–0.95), respectively). Other groups’ E/O were not different from one. The Shieh combined model had an intercept and slope significantly different from 0 and 1, respectively (table 2).

Calibration according to BCRAT, IBIS and combined models’ predictions groups. Results from the clinicogenetic-based cohort. P values were computed using a goodness-of-fit test statistic compared with the critical value from the χ2 distribution. Each PRS models name referred to the first author of the study from which the PRS were derived. BCRAT, Breast Cancer Risk Assessment Tool; E/O, expected-to-observed cases; IBIS, International Breast Cancer Intervention Study; PRS, Polygenic Risk Scores.
The BCRAT+PRS combined models’ c-indexes were all slightly higher than the BCRAT and IBIS scores, but none of them were statistically different from the ones computed with the BCRAT and IBIS models (table 2). The discrimination for women at higher risk was better for the Shieh and Mavaddat combined scores (down-left corner of the ROC curves, (online supplemental figure 2). Using a 1.66% threshold, only the Evans combined model increased both the sensitivity and the specificity as compared with the BCRAT and IBIS risk prediction score (table 2).
Regarding the IBIS+PRS combined models, the E/O were the same as the BCRAT and IBIS models (0.94 (0.73–1.22)) with non-significant goodness-of-fit tests (table 2). All the combined models had an E/O that included one in each four risk groups (figure 4). Intercepts and slopes were not different from 0 and 1, respectively (table 2). The c-indexes were all slightly higher than those obtained from the BCRAT and IBIS scores, but none of them were statistically different. The discrimination for women at higher risk was also better for the Shieh and Mavaddat combined scores (down-left corner of the ROC curves, online supplemental figure 2). Compared with the BCRAT and IBIS models, sensitivities values were higher while specificities values were lower (table 2).
Discussion
In this work, we reported the predictive performance of BCRAT, IBIS and four PRS for predicting breast cancer occurrence within 5 years in a French-Canadian population. Results show that the BCRAT and IBIS models are globally well calibrated, with an E/O close to one. However, when focusing on predicted risk subgroups, the BCRAT model overestimates the number of cases in the average risk group (1.66%–3% risk) while the IBIS model was miscalibrated in the low-risk and intermediate-risk groups (below 1.66% risk). In our study, IBIS produced slightly better discrimination than BCRAT. As compared with the clinical-based models, the genetic prediction models (PRS) did not provide a significant improvement of the discriminative capacity. Adding PRS to the BCRAT or IBIS scores did not significantly increase the predictive power of both models.
Despite an overall good mean calibration of the BCRAT model, the calibration across risk subgroups could be improved. The analysis of the four groups of risk shows a significant difference between expected and observed cases with an overprediction in women with a risk equal or higher than 1.66%. This finding is in accordance with previous studies.41–43 Opposite results have also been reported in a recent large study with pooled data from two cohorts of women where the BCRAT model underestimated the risk for values between 1.7% and 3.4%.12 However, in this latter study, eligible women were aged between 20 and 70 years at the enrollment and recruited since 1991, while our population was aged between 40 and 70 years and enrolled since 2009. The overestimation of the BCRAT risk prediction model for women with a risk higher than 1.66% cannot be explained by differences in age-standardised incidence rates since, based on information retrieved from national cancer databases,35 44 45 the incidence rates are comparable between the USA and Canada (250.4 (95% CI 209.0 to 298.3) cases per 100 000 per year for Canada and 236.8 (95% CI 235.5 to 238.1) for US). The IBIS model, the PRS models and the clinicogenetic model (BCRAT+PRS) had also an overall good mean calibration. However, when analysing calibration across risk subgroups, the IBIS model had a significant goodness-of-fit test, with an over and underestimated risk in the low and intermediate groups, respectively, probably explained by the UK incidence rates used by the IBIS model. This is not the case for the PRS models but this result should be cautiously interpreted in light of the reduced number of breast cancers in the genetic cohort.
The discriminatory accuracy of the BCRAT risk prediction model is modest in our population (58.6%) but is in accordance to the meta-analysis of Wang et al7 that reported a pooled AUC close to our c-index (0.60 (0.58–0.62)). The IBIS model produced a better discrimination estimate (63.4%) than BCRAT. Since we did not collect multi-generational pedigree or BRCA1/2 gene mutations data in our cohort, the gain in discrimination for the IBIS model as compared with BCRAT model may be linked to the non-genetic risk factors. HRT use and the menopausal status, that are risk factors for the IBIS model, are significantly associated in our series with the outcome (p<0.05, results not shown) and may explain the gain in discriminative accuracy. It emphasises that the inclusion of new modifiable risk factors can increase discriminatory accuracy of predictive models.
Although the calibration and discriminative power of the PRS and the clinicogenetic models were satisfactory, they did not provide a significantly better discrimination. This is not surprising since when combining SNPs the gains in prediction are usually small.15 Moreover, these non-significant results should also be interpreted in light of the modest size of our cohort having genetic information and the different baseline populations used for calculating the BCRAT, IBIS and PRSs models’ relative risks. It should be noted that the combined IBIS+PRS models had a better calibration regarding the four risk groups compared with the BCRAT+PRS models. However, the absolute risk of IBIS combined models were not obtained with the same procedures as for BCRAT, which makes the results not straightforward to compare. Moreover, it is worth noting that combining both clinical and genetic information in an oversimplified additive way has nevertheless some limitations from an explanatory point of view.
Some strengths of the present study should be highlighted. First, this validation study relies on the CARTaGENE cohort, which is representative of the French-Canadian urban population of middle-aged and older adults. Moreover, the linkage with administrative health databases and the Quebec Breast Cancer Registry improved the outcome quality and accuracy, and made possible to use variables usually difficult to obtain such as the history of breast biopsy or atypical hyperplasia. Second and to the best of our knowledge, this study is the first to evaluate the BCRAT in a French-Canadian population for predicting breast cancer at 5 years.
This study has nevertheless some limitations. First, our findings may not apply to younger women under forty years old. Second, we have limited our study to BCRAT and IBIS risk prediction models. The main reason was that both models were well documented and implemented. The BCRAT model is used for prevention purpose with chemoprophylaxis in the USA46 47 and is composed of clinical variables, easy to obtain in real clinical practice. The IBIS model is also implemented and can be used even with missing data such as multi-generational pedigree and BRCA1/2 gene mutations data. Third, since the genotyping information was not available for all the cohort, the number of incident cases for validating the combined scores was lower than for validating BCRAT and IBIS. Moreover, the PRS, BCRAT and IBIS models had to be evaluated on different sub-cohorts. The larger decrease of IBIS’s c-index compared with BCRAT between the two cohorts might be linked to the smaller size of the CGC as compared with the clinic-based cohort. The ethnicity differences between the two subcohorts could be explained by the divergent ancestry step of the quality control of genotype data. The highest breast cancer risk among genotyped women (higher age at first live birth and more relatives with breast cancer) could not be explained by the women preferentially genotyped, as they were selected for studies unrelated with breast cancers.30–32 Even though these two subcohorts were similar, it would be useful to collect all genotype information for the entire cohort to validate the PRS results. Finally, regarding family history included in the IBIS model, we only had maternal and paternal history of breast cancer and maternal history of ovary cancer. However, the IBIS model can handle missing data and the performance of the model remained good without this information. Therefore, the IBIS model should be more accurate with more family history variables.
Conclusion
BCRAT and IBIS produced overall good calibration in our French-Canadian cohort but with moderate performance in terms of discriminative ability. These results are in accordance to previous validation studies. IBIS had the better discriminatory accuracy. PRS models did not significantly improve the discrimination. Despite the modest discriminatory power of BCRAT and IBIS, these tools can be of interest for primary care physicians for delivering a personalised message to their high risk patients, regarding screening and lifestyle counselling.
Data availability statement
Data may be obtained from a third party and are not publicly available. The data that support the findings of this study are available from CARTaGENE but restrictions apply to the availability of these data. Data are, however, available directly from CARTaGENE (http://cartagene.qc.ca; access@cartagene.qc.ca; +1 514-345-2156).
References
Supplementary materials
Supplementary Data
This web only file has been produced by the BMJ Publishing Group from an electronic file supplied by the author(s) and has not been edited for content.
Footnotes
Contributors RJ: conceptualisation, data curation, formal analysis, investigation, methodology, visualisation, writing-original draft, writing-review and editing. YP: data curation, software, writing-review and editing. TdM: data curation, software. CL: resources. NN: conceptualisation, resources, writing-review and editing. PB: conceptualisation, formal analysis, methodology, project administration, supervision, validation, writing-review and editing. All authors read and approved the final manuscript.
Funding The authors have not declared a specific grant for this research from any funding agency in the public, commercial or not-for-profit sectors.
Competing interests None declared.
Provenance and peer review Not commissioned; externally peer reviewed.
Supplemental material This content has been supplied by the author(s). It has not been vetted by BMJ Publishing Group Limited (BMJ) and may not have been peer-reviewed. Any opinions or recommendations discussed are solely those of the author(s) and are not endorsed by BMJ. BMJ disclaims all liability and responsibility arising from any reliance placed on the content. Where the content includes any translated material, BMJ does not warrant the accuracy and reliability of the translations (including but not limited to local regulations, clinical guidelines, terminology, drug names and drug dosages), and is not responsible for any error and/or omissions arising from translation and adaptation or otherwise.