Article Text

Abstract
Objectives Multisectoral collaboration (MSC) is widely recognised as a critical aspect of policies, programmes and interventions addressing complex public health issues, yet it is undertheorised and difficult to measure. Limited understanding of the intermediate steps linking MSC formation to intended health outcomes leaves a substantial knowledge gap about the types of strategies that may be most effective in making such collaborations successful. This paper, which reports the quantitative strand of a broader mixed-methods study, takes a step toward filling in this ‘missing middle’ of MSC evaluation by developing and testing the FLW-MSC scale, an instrument to assess collaboration among the frontline workers of one of India’s largest and most widely known MSCs: the Integrated Child Development Services (ICDS) scheme.
Design This study involved development, field-testing and psychometric testing of an 18-item, Likert-type frontline worker collaboration scale, including internal consistency, construct validity and criterion validity.
Setting Village-level primary healthcare in rural Uttar Pradesh, India.
Participants 281 anganwadi workers, 266 accredited social health activists and 124 auxiliary nurse midwives selected based on random sampling of anganwadi catchment areas from 346 gram panchayats (GPs), including 173 intervention GPs and 173 pair-matched control GPs from a parent evaluation study.
Results Results support the scale’s internal consistency (ordinal α=0.92–0.95), construct validity (reasonable exploratory factor analysis model fit for five of the six dyadic relationships Tucker-Lewis Index=0.84–0.88; Root Mean Squared Error of Approximation=0.09–0.11), and criterion validity (regression of collaboration score on an information-sharing indicator β=3.528; p=0.006).
Conclusions The scale may be useful for ICDS managers to detect and address poor collaboration as the Indian government redoubles its efforts to strengthen and monitor MSC, or ‘convergence’, with important implications for the critical priority of child development. Further, the FLW-MSC scale may be adapted for measuring frontline worker collaboration across sectors in many other scenarios and low/middle-income country contexts.
- public health
- nutrition
- organisation of health services
This is an open access article distributed in accordance with the Creative Commons Attribution Non Commercial (CC BY-NC 4.0) license, which permits others to distribute, remix, adapt, build upon this work non-commercially, and license their derivative works on different terms, provided the original work is properly cited, appropriate credit is given, any changes made indicated, and the use is non-commercial. See: http://creativecommons.org/licenses/by-nc/4.0/.
Statistics from Altmetric.com
Strengths and limitations of this study
To the authors’ knowledge this is, to date, the only interprofessional collaboration scale that has been specifically developed for application in a low/middle-income country context.
Strong theoretical, quantitative and qualitative basis for the collaboration construct.
Embedded within mixed-methods instrument development and construct validation framework.
Limited geographical scope of study area.
Metric only addresses one part of a complex phenomenon.
Introduction
Frontline worker collaboration as a key facet of multisectoral collaboration
Given the interconnectedness of biological, environmental and social determinants of health, the global public health community has long recognised the importance of collaboration among stakeholders from multiple sectors. Yet despite the clear theoretical rationale for multisectoral collaboration (MSC), there is a shortage of empirical evidence about what constitutes effective MSC as well as how MSC affects population health outcomes.1–3 This is due in part to the lack of suitable indicators and research methods to evaluate the functioning of MSCs as well as the fact that evaluators tend not to clearly define the causal pathway(s) through which MSC is intended to affect population health.1 4 5 This in turn contributes to a conceptual and evidentiary gap,5 referred to in this paper as the ‘missing middle’ of MSC, that constrains evaluation efforts.
These issues are particularly relevant for India’s Integrated Child Development Services (ICDS) scheme, a holistic early childhood development programme designed to address proximal factors such as nutritional intake and disease as well as underlying causes related to food security, healthcare access and social protection. The largest programme of its kind globally, ICDS is led by the Ministry of Women and Child Development (MWCD), in close collaboration with the National Health Mission (NHM) of the Ministry of Health and Family Welfare, and is provided to women and children in nearly 1 million villages around the country through the ministries’ state-level departments. Services are delivered by frontline health workers (FLWs), defined as those who provide services directly to communities and are the first link to the health system, especially in remote and rural areas (frontline health worker coalition; https://www.frontlinehealthworkers.org/frontline-health-workers). These FLWs include the anganwadi workers (AWWs) from MWCD, and the accredited social health activists (ASHAs) and auxiliary nurse midwives (ANMs) from NHM, sometimes referred to as the ‘AAA’ workers.6 Results to date are mixed: several evaluations have highlighted substantial gaps in ICDS implementation and, consequently, limited overall impact on child nutritional status7 8 ; other studies have found positive developmental outcomes among children who received ICDS services.7 9 Although FLW collaboration has been identified both by the Indian government10 and by researchers11 as critical to the expansion of effective coverage of key maternal and child health and nutrition services, it has never been systematically measured.
Drawing from the literature on interprofessional collaboration
The literature on interprofessional collaboration (IPC) focuses on the individual and organisational levels. As defined by the WHO in the 2010 Framework for Action on Interprofessional Education and Collaborative Practice, ‘collaborative practice’ occurs when ‘multiple health workers from different professional backgrounds provide comprehensive services by working with patients, their families, carers and communities to deliver the highest quality of care across settings’.12
This literature is relevant because it measures collaboration closest to the point(s) of service delivery, which is often an essential aspect of MSC. The large amount of work done to develop, test and validate psychometric scales measuring health worker collaboration is thus a useful starting point for the present study. At the same time, the IPC work is derived largely from integrated healthcare practice in high-income countries, including mental health, maternity and geriatric care13 ; there are, to the authors’ knowledge, no existing scales to assess collaboration among FLWs in India or any other low/middle-income country (LMIC).
This paper reports results from the first two objectives of an overarching mixed-methods study, corresponding to the quantitative component of the analyses in phases 1–6 of the Instrument Development and Construct Validation framework described by Onwuegbuzie et al.14 These objectives are to: (1) define and develop a scale to measure collaboration among the ‘AAA’ FLWs; and (2) assess the psychometric properties of the FLW collaboration scale.
Conceptual framework
The conceptual framework is adapted from Emerson and Nabatchi’s Integrative Framework for Collaborative Governance, which synthesises several decades of research on collaboration across a broad array of fields and disciplines.15 The framework follows a theory of change structure to analyse the development, functioning, actions and outcomes of a ‘collaborative governance regime (CGR)’ (As stated by the authors, the use of the word ‘regime’ in this framework is borrowed from Stephen Krasner, who defined it as a ‘governing arrangement that is imbued with a set of explicit and implicit ‘principles, norms, rules, and decision-making procedures around which actor expectations converge in a given issue area’’ (Krasner 1983, in15).), which is defined as:
a type of public governance system in which cross-boundary collaboration represents the predominant mode for conduct, decision-making, and activity between autonomous participants who have come together to achieve some collective purpose defined by one or more target goals.15
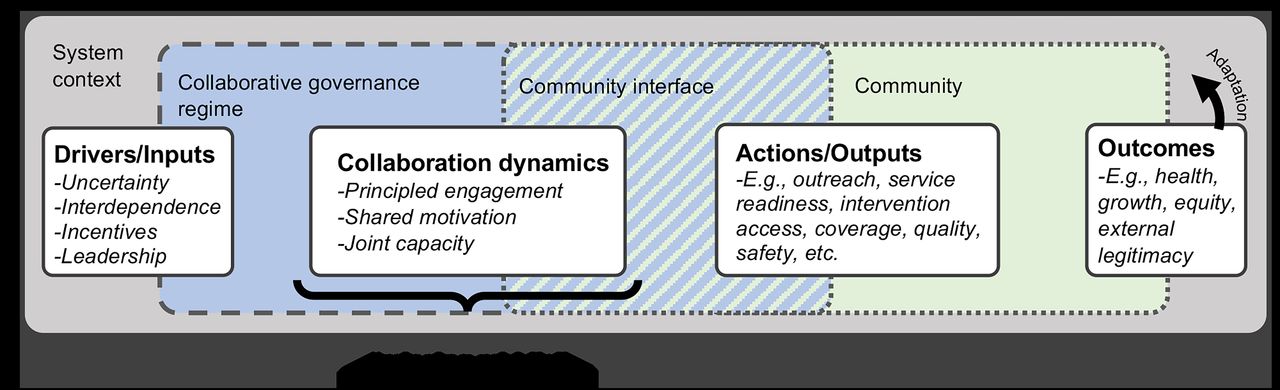
The conceptual framework, adapted from Emerson and Nabatchi’s Integrative Framework for Collaborative Governance, contains several inter-related components of collaborative governance: the system context, which represents a variety of contextual factors that affect and are affected by the CGR; drivers of collaborative action and the formation of the CGR; the collaboration dynamics, which characterise the relationships and interactions between the key actors involved in the CGR; actions taken and outputs produced by the CGR; and outcomes of those actions, which may result in adaptation within the CGR as well as within the broader system context. The striped blue/green section in the middle represents the interface between the CGR and the community and is intended to reflect the influence of community context on frontline worker collaboration. CGR, collaborative governance regime.
Within the adapted framework for this study, the ‘collaboration dynamics’ component most closely represents the ‘missing middle’ in MSC evaluation frameworks; this is what the collaboration scale is intended to measure (figure 1). Emerson and Nabatchi propose that ‘all CGRs are constituted by their collaboration dynamics and the specific actions taken as a consequence of those dynamics’.15 These collaboration dynamics consist of three primary components—principled engagement, shared motivation and joint capacity—which interact dynamically and iteratively to determine the quality and extent of collaboration over time (online supplemental appendix 1). Consistent with the literature,16–22 collaboration is conceptualised as a latent construct, which is not directly observable but can be measured through a set of indicators, often in the form of scale questions related to perceptions, experiences or events that are theoretically indicative of the construct.
Supplemental material
Methods
This study was nested within an FLW survey, which itself was one component of a broader parent study. The parent study sought to evaluate a multisectoral initiative to improve rural economic and social development in Uttar Pradesh, India across five key areas (education, employment, health, infrastructure and water). Data collection was conducted in six administrative blocks of two districts (Hardoi and Sitapur) in Uttar Pradesh by the authors’ institute and a contracted New Delhi-based social research firm, which directly managed data collection activities. Online supplemental appendix 2 presents key health and social indicators for the two study districts and for Uttar Pradesh state overall. Key methodological steps for each research objective are summarised in table 1 and described further below. All statistical analysis was completed using the R statistical software package.
Supplemental material
Key methodological steps by objective
Defining the collaboration construct, identifying item themes and generating scale items
A multidisciplinary literature review covering four search topics (online supplemental appendix 3) was conducted to inform our definition and boundaries of the collaboration construct.
Supplemental material
In this paper, items refer to scale questions (including wording, phrasing and so on), while the item theme refers to the theoretical facet of the construct targeted by a particular item. Thus, items appear in the form of full questions, whereas item themes appear in the form of shorthand labels, such as ‘open communication’ and ‘respect’, and there is a one-to-one relationship between items and item themes.
Collaboration dynamics within the Emerson and Nabatchi framework represent different subdomains of collaboration, providing a possible theoretical structure for grouping the scale items. As there are no existing scales or scale items associated with the Emerson and Nabatchi framework, potential scale item themes were generated deductively from the literature review using framework analysis.15 Relevant text excerpts from each paper were entered into a Microsoft Excel spreadsheet and assigned a descriptive, shorthand label to represent the item theme (ie, since different scales use differently worded questions to investigate the same apparent item theme). Item themes were iteratively updated, and excerpt groupings were divided or collapsed as needed to maintain within-group consistency and between-group differentiation. The process was concluded when no further unique item themes emerged. Item themes were then compared with the subdomains of collaboration dynamics in the Emerson and Nabatchi framework and grouped according to the closest theoretical fit (table 2).
Theoretical, quantitative and qualitative basis for the collaboration construct
Drafting and refining the scale instrument
Each item theme was represented by a single scale item to minimise respondent fatigue23 and because there was no basis to assume that any individual item theme was more important than others. Since scale items associated with a given item theme (eg, shared vision, interdependence) differed across the reviewed scales, wording was adapted from existing scales where relevant and refined to establish face validity in consultation with experts familiar with the topic and context. The scale was translated into Hindi and further refined through two rounds of rapid cognitive interviewing and two field pretests (online supplemental appendix 4). The final scale consisted of 18 items, one per item theme (see online supplemental appendix 5 for an English language version; see online supplemental appendix 6 for a side-by-side comparison of the draft and final scale questions).
Supplemental material
Supplemental material
Supplemental material
Field-testing of the refined scale instrument
Respondent sample
The target respondents were the ASHAs, AWWs and ANMs within each of the primary sampling units (PSUs) for the parent study. The study area includes 346 gram panchayats—each of which typically contains 1–3 villages—distributed across six blocks of Hardoi and Sitapur districts of Uttar Pradesh state. Villages were segmented such that each PSU represented the catchment area of a single AWW/ASHA pair. Since each of the AWW/ASHA pairs is served by a single subcentre and single ANM, the selected PSUs also uniquely identified all the subcentre-based ANMs invited to participate. Simple random sampling was applied to determine which of the AWW/ASHA pairs the ANM should be asked about for the collaboration scale questions (online supplemental appendix 7). Online supplemental appendix 8 displays the number of responses by worker type and the number of triads of FLWs serving a common catchment area for whom the full set of collaboration scale responses were obtained.
Supplemental material
Supplemental material
Patient and public involvement
FLWs were first involved in the study during cognitive interviewing, pilot testing or the main survey. FLW experiences, challenges and priorities were communicated to the research team by a foundation implementing a multisectoral development initiative in the study location. FLW input during cognitive interviewing shaped scale question and interview guides.
Data collection
The survey was administered using a computer-assisted personal interviewing platform by trained data collectors from a contracted Indian social research firm, with oversight of the study team. Data collectors and their supervisors obtained permission from local health system and government leadership, invited FLWs to participate and administered informed consent. Surveys were administered in the respondent’s home or outside. Further details are provided in online supplemental appendix 9.
Supplemental material
Exploratory analysis
Marginal item frequencies, overall scores and response distributions were reviewed for each respondent type, both as a rater and as a target, and for each dyadic vector, or one worker’s rating of collaboration with one other worker. Additionally, a three-dimensional (3D) rotating prism was generated in the R statistical software package to visually observe the variation of responses between different AAA workers within the same triad.
Assessing the psychometric properties of the scale
Ordinal alpha was calculated to assess internal consistency among the Likert-type scale items.24 Exploratory factor analysis (EFA) was conducted to examine the construct validity of the collaboration scale. We applied parallel analysis to determine the number of factors to retain in the EFA, first using Monte Carlo simulation to generate 1000 random data sets with similar properties (ie, sample size, number of variables, means, variances), calculating simulated eigenvalues using principal components analysis (PCA) based on a polychoric correlation matrix (assuming the ordinal scale data represent an underlying continuum of the latent collaboration construct).25 26 Mardia’s test of multivariate skewness and kurtosis was applied to test the assumption of multivariate normality required for using maximum likelihood estimation. As the assumption of multivariate normality was not met, EFA was conducted using the weighted least squares (WLS) estimation method. Factor rotation using the ‘oblimin’ method was used to improve the interpretability of the factor loadings.
We assume that the measured level of collaboration among AAA frontline workers should be associated with core tasks they are expected to complete collaboratively during their day-to-day routine. Given the importance of information-sharing among the AAA workers regarding the number of eligible beneficiaries in the village and the services they receive, it is hypothesised that collaboration would be positively associated with information-sharing. More specifically, since the registers and records maintained by the ASHAs and AWWs are supposed to match for several key village-level variables, it is expected that higher village-level collaboration scores would be associated with greater consistency between the ASHA’s and AWW’s reported values for a set of key indicators in their catchment area (online supplemental appendix 10). To operationalise this assessment, ASHA-reported and AWW-reported values were compared for each of these indicators (online supplemental appendix 11).
Supplemental material
Supplemental material
The above step produced a set of nine dichotomised values (1=match; 0=no match) for each village to represent consistency between the ASHA’s and AWW’s records. These values were summed to generate an ‘information-matching’ variable representing the total number of matched indicators out of nine possible for each village (max. 8; min. 0; median 2). For this analysis, a simple sum of the collaboration scores across the six dyadic vectors in each village was used as a proxy for village-level collaboration, with a possible range of 108–540.
Results
Exploratory analysis
Visualisation of collaboration scores with a 3D prism
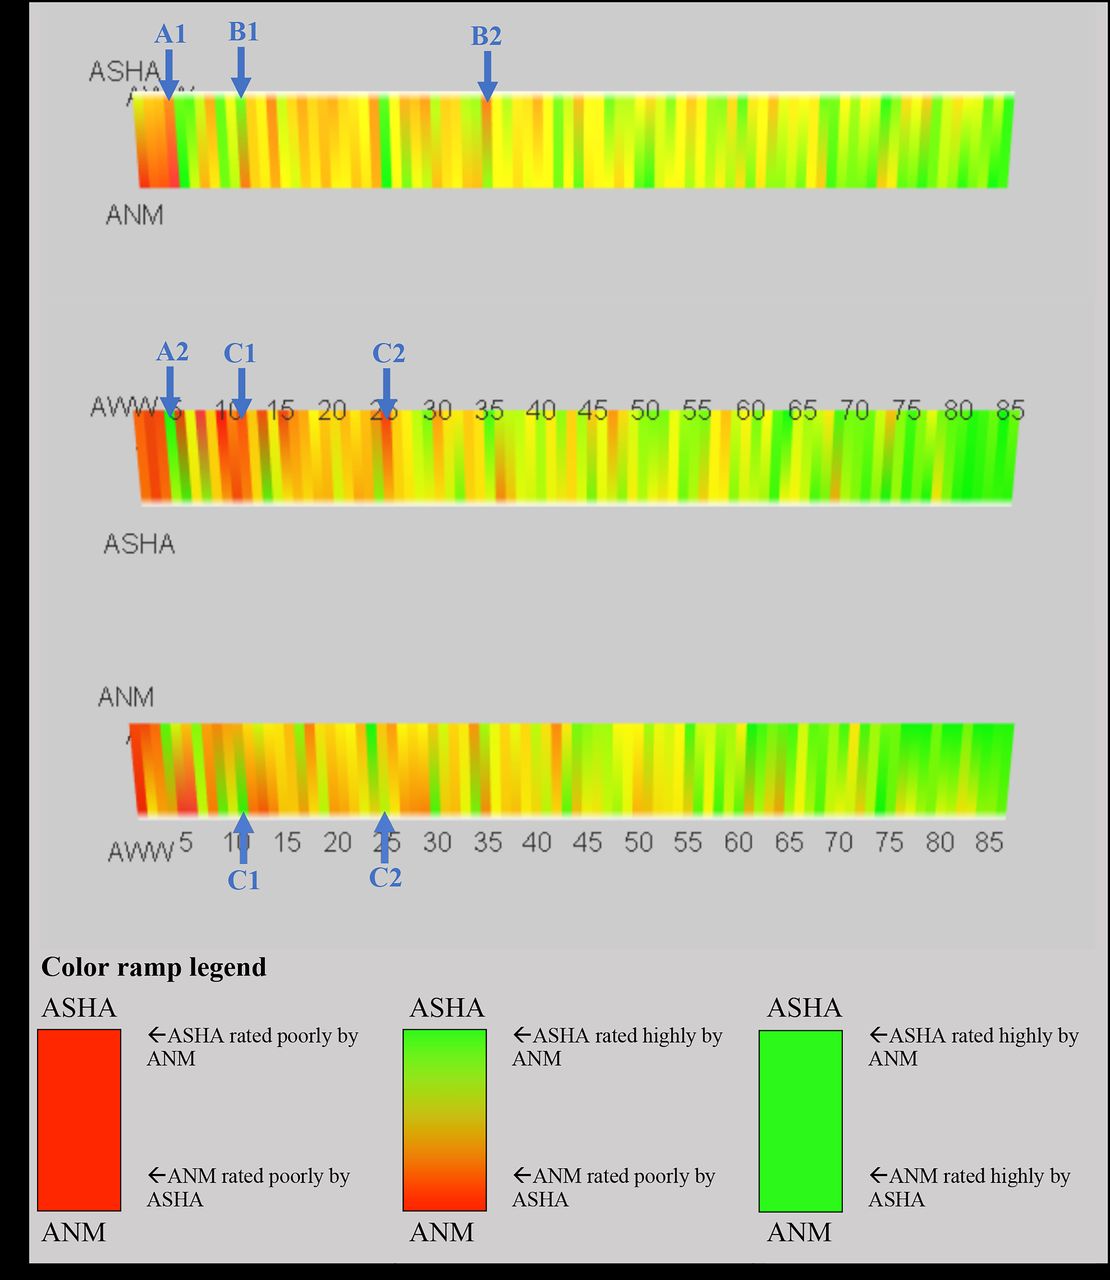
The 3D prism (figure 2) displays the total scale scores assigned by each of the AAA workers to each of the other two workers serving the same village, with green corresponding to higher reported collaboration and red corresponding to lower collaboration. Ratings tended to be relatively high overall, hence the skew toward the green end of the spectrum in the colour ramp. For multiple villages, there are notable discrepancies in reported levels of collaboration, including: (1) between different dyads of workers in the same village; (2) workers’ ratings of each other in the same dyad; (3) two workers’ ratings of the third worker in the same village.
The original code to visually map the collaboration scale data onto the three-dimensional (3D) rotating prism depicted in the diagram was developed by J-ML. DG then modified the code to enhance the model. This displays three different views of the 3D prism at different points of rotation in order to show the scoring between each pair of AAA workers. Each vertical band or coloured stripe represents a unique village for which scale data from all three workers are available. A colour ramp is used to visually represent the collaboration scores (min: 28; max: 90; out of a possible range of 18–90). The colour ramp extends from red (lowest scores) to green (highest scores), with red roughly corresponding to scores between 28 and 65, yellow between 66 and 80, and green between 81 and 90. The colour closest to a particular vertex reflects the scale score in which that person was the target. For multiple villages, there are notable discrepancies in reported levels of collaboration, including: between different dyads of workers in the same village. For example, ‘A1’ depicts an example where an ASHA and ANM both rate their collaboration poorly, while ‘A2’ shows that the ASHA and AWW of that same village rate their collaboration highly. Worker’s ratings of each other in the same dyad. For example, ‘B1’ and ‘B2’ depict separate examples where workers in a particular dyad—in this case, the ASHA and ANM—have divergent views regarding their collaboration with each other. Two workers’ ratings of the third worker in the same village. For example, ‘C1’ and ‘C2’ show separate examples where two workers assign divergent ratings to the third worker in the same triad (in both cases, the ASHA indicated poor collaboration with the AWW but the ANM indicated a fairly high level of collaboration with that same AWW). ANM, auxiliary nurse midwife; ASHA, accredited social health activist: AWW, anganwadi worker.
Internal consistency
Ordinal alpha values for internal consistency were relatively high (and similar) across all the dyadic vectors, ranging from 0.92 to 0.95. Average inter-item correlations ranged from a low of 0.38 (ANM→ASHA) to 0.50 (ASHA→AWW).
Construct validity
Parallel analysis indicated that two factors should be extracted for the EFA in five of the six dyadic vectors; for the last vector—ANMs’ ratings of the AWWs—one component was indicated (online supplemental appendix 12). Based on visual review of the parallel analysis plots, a three-factor model for the ANM→ASHA dyadic vector was also tested.
Supplemental material
Results from the EFA using WLS and oblimin (Methodological note regarding choice of rotation method: the observed association between the factors in all of the two-factor models indicated that they are not orthogonal, thus indicating that the ‘varimax’ rotation method would be inappropriate for this analysis. Factor loadings using ‘promax’ rotation were identical to those observed using the ‘oblimin’ method, so only the latter are reported here.) rotation for each dyadic vector are displayed in table 3, with dominant factor loadings above a 0.4 threshold highlighted and bolded. Item loadings followed the same pattern for four of the six dyadic vectors, corresponding to the responses of the ASHAs and AWWs, regardless of whether they were rating each other or the ANM. The one exception to this pattern was the ‘conflict management’ item for the AWW’s rating of the ASHA, which had a more evenly split loading between the two factors. For the single-factor structure associated with the ANM’s rating of the AWW, 16 of the 18 items had factor loadings above the 0.4 cut-off; ‘trust’ and ‘enabling environment’ had low loadings. For the three-factor structure of the ANM’s rating of the ASHA, the ‘accountability’ item was split across all three factors and the ‘interdependence’ item was cross-loaded on factors 1 and 3.
Results from the exploratory factor analysis
The model fit for five of the six dyadic vectors was reasonable but fell slightly short of commonly used thresholds for a ‘good’ fit, with a Tucker-Lewis Index (TLI) of 0.84–0.88 as compared with a target threshold of >0.90 and Root Mean Squared Error of Approximation (RMSEA) values of 0.09–0.11 as compared with a target threshold of <0.10. The initial EFA on the ANM→ASHA dyadic vector failed to run, possibly due to a combination of the relatively low sample size and ANMs’ tendency to rate their collaboration with the ASHAs highly. Because of the low frequencies in the two lowest response categories, those categories were collapsed and the PCA and EFA were rerun on a 4-point scale. Although there were no further issues with running the EFA, the model fit for ANM→ASHA was rather poor (TLI: 0.62; RMSEA: 0.17). As with the summed collaboration scale scores, the calculated factor scores tended to be negatively skewed with a long tail on the lower end of the scoring range (online supplemental appendix 13).
Supplemental material
From a theoretical perspective, the number of factors and the item loadings on those factors may provide empirical evidence to help substantiate the conceptual framework from which the scale domains were derived and on which the questions were based. To assess this, the factor structures and loadings for the AWW and ASHA responses were compared with the associated domains in the conceptual framework.
In the EFA results for the AWW and ASHA responses, the majority of items (14 out of 18 for the AWW and 15 out of 18 for the ASHA) loaded strongly on the first factor, with only three items loading on the second factor. A side-by-side comparison of theorised item loadings based on this study’s conceptual framework and the actual item loadings based on the AWW and ASHA scale responses is provided in online supplemental appendix 14.
Supplemental material
In contrast to the theorised item loadings, in which each item corresponds to one of the three ‘collaboration dynamics’ subdomains, actual factor loadings appear to sort the items based on whether they enable or hinder collaboration. All items loading on factor 1 (labelled ‘enablers’) contained positive wording regarding interactions or perceptions theorised to contribute to collaboration, whereas the items loading on factor 2 (labelled ‘barriers’) were worded such that they would be theorised to impede collaboration. Item loadings for ANMs’ ratings of the AWWs and of the ASHAs also show no apparent correlation with the theorised item loadings from the conceptual framework.
Criterion validity
Regression of the village-level total collaboration score (range: 361–527; out of a possible 108–540) on the information-matching variable indicated a positive but non-significant association (β=2.632; p=0.098), primarily due to three outlier observations with total collaboration scores <400. Excluding these, the association increased in magnitude and became highly significant (β=3.528; p=0.006), roughly corresponding to one additional matched indicator in the AWW and ASHA registers for every additional 3.5 total collaboration points (online supplemental appendix 15). The magnitude and significance of this association held after accounting for the AAA workers’ education and years in post, differences in religion and caste between the workers, location of the anganwadi centre (AWC) (in the school, elsewhere in the village, in a neighbouring village), distance the AWW travels to the AWC, and presence of an anganwadi helper.
Supplemental material
Discussion
In the ICDS, the level of collaboration among specific individuals may serve as a key proxy variable or indicator for the functioning of the collaboration between the NHM and MWCD. The fact that such MSCs are multidimensional and multilevel means that no single indicator can adequately quantify an abstract concept like collaboration; however, we sought to identify a constellation of measures that, taken together, provide a meaningful indication of collaborative functioning at the village level.
The FLW collaboration scale developed in this paper has a high conceptual overlap with the reviewed theoretical frameworks, IPC scales and qualitative studies of AAA collaboration in rural India. This scale is the only one we are aware of that has been specifically developed for application in an LMIC context.
The scale is most similar to that developed by Kenaszchuk et al,18 both in terms of the sociometric format and the number of items (18 vs 14); a major difference is that this scale is designed for respondents with limited schooling in a frontline service delivery setting, whereas the Kenaszchuk et al scale is designed for use with highly educated physicians, nurses and allied health workers in an acute care setting in a high-income country (Canada).18 The other reviewed scales also target highly educated healthcare workers in high-income countries but differ notably in that they all: (1) ask questions about the respondent’s personal experience or perception of the group; and (2) have substantially more items in the scale, with 37–48 items each.16 17 19
Testing the psychometric properties of the scale produced evidence supporting the validity of the collaboration measure while also highlighting several areas warranting further investigation. High internal consistency across the 18 scale items suggests that they are measuring the same general construct. EFA results demonstrated a reasonable fit for five of six dyadic vectors, although they fell slightly short of recommended threshold values for a good fit. In addition, the EFA for the ASHA and AWW responses had a nearly identical two-factor structure with the same items loading on each factor and very similar factor loadings, suggesting that collaboration is experienced in a similar way by these two worker cadres and providing initial evidence that it may be appropriate to use the same scale to measure collaboration for both groups; further testing of the factor structure and measurement invariance through confirmatory factor analysis could help confirm this.
The fact that the ANM responses had a different factor structure than the ASHA and AWW suggests that the collaboration construct may be experienced differently by this worker. This may be due to the ANM’s higher position in the organisational hierarchy (ie, working with ASHA/AWW pairs across three to five villages) and the differing nature of their role vis-à-vis the others. For instance, the fact that the ANM directly supervises and works most closely with the ASHA is consistent with the more nuanced collaboration experience suggested by the three-factor structure. Similarly, the ANM’s slightly more arm’s length relationship with the AWW is consistent with the simpler, single-factor structure; in contrast to the ASHA, the AWW works in a different ministry, meets less frequently with the ANM and has non-health responsibilities that do not involve the ANM (eg, early childhood education).
Although the model fit is poor for the ANM→ASHA dyadic vector, the item loadings offer tentative support to this hypothesis in that one of the factors (F3), consists largely of items one might expect to be associated with a hierarchical relationship: respect, power sharing (which also may be interpreted as deference), open communication, an official mandate to collaborate (leadership/incentives), commitment/motivation, and training/guidance. A second factor (F2) including the items willingness to listen, help and support, information-sharing, discussing the needs of beneficiaries (joint planning) and role clarity may be more indicative of the rapport between the two workers. The third factor (F1) may reflect some aspect of carrying out the work together, as it includes agreement on the best way to take care of beneficiaries (shared vision), service coordination and conflict management.
That the ANM is positioned higher in the organisational hierarchy also hints that there may be methodological differences in measuring collaboration in vertical relative to horizontal relationships. Another potential contributing factor could be that the ANM interacts with 3–5 ASHA/AWW pairs, whereas the ASHAs and AWWs primarily work with only one of each of the other two cadres. The existence of similar working relationships with multiple other ASHAs and AWWs may affect their perceptions or experience of collaboration with any given individual worker. The larger number of collaborative relationships for the ANMs may also affect their available time to allocate to any one relationship, a consideration largely unexplored in the existing literature on interprofessional collaboration.
It is also worth reflecting on why the scale items—at least for the AWWs and ASHAs—loaded onto the enabler/barrier factor structure described above. The labelling of these factors was based on the fact that the latter was exclusively defined by negatively phrased items. This is consistent with the ‘Isolation’ factor in the multiple-group IPC scale developed by Kenaszchuk et al,18 which consisted exclusively of negatively phrased items and which the authors retained because of: (1) the importance of acknowledging and measuring negative aspects of interprofessional care; and (2) cultural norms inhibiting subordinate healthcare workers from openly criticising those who are hierarchically senior (eg, nurses avoiding openly criticising doctors).
Kenaszchuk et al18 further noted that ‘defining a factor based on negative items acknowledges that survey scales convey information as much as they elicit it’ (Schwarz 1995; Schwarz and Oyserman 2001, in Kenaszchuk et al18) and that the existence of negative items on a scale may serve as a signal to the respondent of the researchers’ awareness that relationships among the FLWs can be strained. This observation, combined with the fact that negatively worded scale items contributed an outsized proportion of the overall variation in collaboration scores, suggests that it may be worthwhile testing variations of the scale with a larger number of negatively phrased items. Further analysis in this direction may also be useful in investigating a possible collaboration analogue of Herzberg’s Two-Factor Theory of Motivation, which states that motivation is jointly driven by higher levels of satisfaction and lower levels of dissatisfaction, and that the two do not conceptually belong to the same dimension.27
The discrepancy between the three components of the theoretical collaboration construct (developed largely based on a high-income context) and the two observed factors in this study also highlights the potential need to adapt the conceptual framework for collaboration to different study contexts and populations—and that the scale presented here may serve as a useful prototype for other assessments of collaboration in similar settings, particularly among FLWs involved in direct service delivery.
Although there is no gold standard measure to test the criterion validity of the measure, the village-level collaboration scores were significantly associated with the constructed indicator for information matching between the ASHA’s and AWW’s records when three outlier villages with very low collaboration scores were dropped from the analysis. This indicates that, as theorised, higher levels of collaboration among the AAA workers appear to be positively associated with greater consistency in reporting of key village indicators (eg, number of births, children 0–3 years and so on) between the ASHA and AWW, which is a core component of their respective job descriptions and one key point of interaction.
This study has several limitations. The tendency for collaboration scores to skew high may reflect social desirability bias, even though the research team explicitly sought to minimise this by refining the wording of the scale questions through the cognitive interviewing and pretesting process. This skew limited, to some extent, overall variation in scale responses and warrants further consideration in subsequent testing or adaptation of the scale. With respect to the information-matching criterion, registers may in some cases be unavailable for the FLWs to use for reasons unrelated to worker collaboration (eg, a supply shortage or delay). It is also possible that AAA workers in some villages worked out their own system of record-keeping, cross-checking and compiling monthly reports, which does not require them to maintain consistent numbers between their registers. As noted earlier, the approach to generating a village-level total score from individual-level data is a methodological choice that warrants further investigation, both conceptually and empirically.
The limited geographical scope may limit the generalisability of the findings. However, although the size of the study area is small relative to Uttar Pradesh state, it has similar sociodemographic attributes to other districts and Uttar Pradesh as a whole. This, along with the administrative consistency in the individual roles and joint responsibilities in the AAA triads, suggests that the collaboration scale may have relevance beyond the study area, at least in Uttar Pradesh, and possibly in India more broadly.
This study does not directly address collaborative governance dynamics at higher levels (eg, national, state, district), which are also important for programme effectiveness, and likely shape interactions among FLWs. Nor does the study consider the appropriateness of the programme design, for example, whether an alternative organisational structure or another form of FLW collaboration would be more suitable than the current ‘AAA’ structure.
Finally, collaboration is a complex phenomenon and arguably should be measured from multiple perspectives, potentially also including objective measures of collaboration (eg, participation in coordination activities; efficiency of resource use) to complement the subjective experience of the FLWs.28 Relatedly, the growing emphasis on integrated, people-centred care suggests that the beneficiary perspective should also be reflected. Further research should consider the extent to which these other perspectives complement the subjective, provider-side perspective represented in the current scale.
In its current form, this scale may be useful for measuring collaboration among the AWWs, ASHAs and ANMs in other parts of India, including the nearly 1 million other villages around the country with the same triad of workers. Programme implementers working with FLWs could administer the scale early on in a programme to help identify potential collaboration issues to be addressed. Evaluators could use the scale to collaboration to better understand the extent to which FLW collaboration may have influenced programme implementation and outcomes. Implementation researchers may consider measuring worker collaboration as a key logical link in the theory of change for the many interventions relying on these AAA workers for frontline service delivery in India.
Given substantial variations in language and dialect, we recommend drawing on local knowledge to assess face validity and translate the scale into the local language. Research teams may also consider rapid cognitive testing (as described in online supplemental appendix 4) to confirm comprehension of the scale questions as intended. We encourage others to publish and share adaptations of the FLW collaboration scale to contribute to more rigorous research of this critical facet of health and social service delivery for rural, underserved populations.
Conclusion
While there is global consensus about the importance and potential benefits of MSCs, there is limited empirical evidence on how they function, which impedes our understanding of how to make them successful. The lack of a metric for FLW collaboration makes it difficult to assess: (a) the effects of state-level and local-level governance structures and multisectoral coordination mechanisms on FLW collaboration at the point of service delivery; and (b) the association between ‘AAA’ collaboration and the coverage and quality of frontline health services. Both gaps limit the ability of the Indian government to critically reflect on the design and assumptions of ICDS and the policies in place to implement the scheme.
This study takes a step toward filling this critical measurement gap in India’s ICDS. A meaningful, valid scale for measuring collaboration among India’s frontline health and nutrition workers has the potential to help figure out how to improve it; it may also provide a stepping stone for developing collaboration scales elsewhere in India and beyond. From a macro perspective, collaboration scales may help illuminate a critical step in the ‘missing middle’ of the logical framework for some MSCs—particularly those involving direct service delivery to rural communities—thus helping generate much-needed empirical evidence on the effectiveness of these types of partnerships in achieving their stated health and social objectives.
References
Supplementary materials
Supplementary Data
This web only file has been produced by the BMJ Publishing Group from an electronic file supplied by the author(s) and has not been edited for content.
Footnotes
Twitter @dmglandon
Contributors DG—conceptualisation, methodology, software, validation, formal analysis, investigation, data curation, writing (original draft), writing (review and editing) and project administration. J-ML—conceptualisation, methodology, software, writing (review and editing) and visualisation. SG—conceptualisation, investigation, resources, writing (review and editing), supervision, project administration and funding acquisition. JM—conceptualisation, methodology and writing (review and editing). LP—conceptualisation and writing (review and editing). SB—conceptualisation, writing (review and editing) and supervision.
Funding Project Samuday, HCL Foundation Grant #124 005.
Competing interests None declared.
Patient consent for publication Not required.
Provenance and peer review Not commissioned; externally peer reviewed.
Data availability statement Data are available upon reasonable request. Deidentified participant data are available upon reasonable request. Contact: dmglandon@jhu.edu.
Supplemental material This content has been supplied by the author(s). It has not been vetted by BMJ Publishing Group Limited (BMJ) and may not have been peer-reviewed. Any opinions or recommendations discussed are solely those of the author(s) and are not endorsed by BMJ. BMJ disclaims all liability and responsibility arising from any reliance placed on the content. Where the content includes any translated material, BMJ does not warrant the accuracy and reliability of the translations (including but not limited to local regulations, clinical guidelines, terminology, drug names and drug dosages), and is not responsible for any error and/or omissions arising from translation and adaptation or otherwise.