Article Text

Abstract
Objective: To determine whether observed changes in HIV prevalence in countries with generalised HIV epidemics are associated with changes in sexual risk behaviour.
Methods: A mathematical model was developed to explore the relation between prevalence recorded at antenatal clinics (ANCs) and the pattern of incidence of infection throughout the population. To create a null model a range of assumptions about sexual behaviour, natural history of infection, and sampling biases in ANC populations were explored to determine which factors maximised declines in prevalence in the absence of behaviour change. Modelled prevalence, where possible based on locally collected behavioural data, was compared with the observed prevalence data in urban Haiti, urban Kenya, urban Cote d’Ivoire, Malawi, Zimbabwe, Rwanda, Uganda, and urban Ethiopia.
Results: Recent downturns in prevalence observed in urban Kenya, Zimbabwe, and urban Haiti, like Uganda before them, could only be replicated in the model through reductions in risk associated with changes in behaviour. In contrast, prevalence trends in urban Cote d’Ivoire, Malawi, urban Ethiopia, and Rwanda show no signs of changed sexual behaviour.
Conclusions: Changes in patterns of HIV prevalence in urban Kenya, Zimbabwe, and urban Haiti are quite recent and caution is required because of doubts over the accuracy and representativeness of these estimates. Nonetheless, the observed changes are consistent with behaviour change and not the natural course of the HIV epidemic.
- AIDS, acquired immune deficiency syndrome
- ANC, antenatal clinic
- HIV, human immunodeficiency virus
- epidemiology
- HIV
- prevalence
Statistics from Altmetric.com
The prevalence of HIV among women attending antenatal clinics (ANCs), collected over time from the same sites, is fundamental to estimating the scale of the epidemic. The interpretation of trends in prevalence is important in understanding changes in population level risk but is complicated by the need to distinguish between the expected natural history of the epidemic and more pronounced changes arising from changes to individuals’ sexual behaviour.1 In the case of Uganda and Thailand this has been possible and changes in the prevalence of HIV have been accepted to be the product of widespread alterations in sexual risk behaviour.2–5 These national success stories have had profound implications for global policy on HIV control leading to the development of prevention strategies and the investment of significant resources.6,7 When the downturn in prevalence was first detected in Uganda the belief that behaviour change was responsible was strengthened through comparing observed prevalence trends with those generated by mathematical models with and without changes in risk behaviour.2
Mathematical models are a precise way of describing assumptions about the transmission dynamics of an infectious disease and can be used to generate predictions. It is possible to generate predictions of HIV prevalence with and without behaviour change and test which predictions are consistent with observed patterns of prevalence. Models of HIV transmission dynamics have a long history and many complexities have been explored, including the impact of variation in risk behaviour,8 patterns of disease and infectiousness over time,9 and the impact of details of the dynamic network of sexual behaviour. However, models have also been developed to explore specific questions such as the impact of HIV on demography,10 the impact of particular interventions like hypothetical vaccines11,12 and the importance of particular sexual network parameters.13 Such models are best developed in a stepwise fashion testing the importance of each particular assumption. For simplicity the model should be parsimonious and include only as much detail as is relevant to the question in hand.14 In developing models to explore the potential changes in HIV prevalence it is important that they contain the assumptions that can impact on the results of interest.
In this supplement trends in HIV prevalence and associated evidence from sexual behaviour surveys from a number of countries have been described and interpreted. Such interpretation will be strengthened through a comparison of predicted trends under a range of assumptions in mathematical models. Because the data in ANC populations are obviously from women and include records of age, comparable model predictions should be sex and age structured. Other key elements to explore are the relation between incidence and prevalence, and the speed and variance in patterns of incidence and subsequent mortality.15 Further, while an exact description of the pattern of sexual behaviour is unnecessary, it is important to explore changes in the distribution of sexual risk behaviours resulting from differential AIDS associated morbidity and mortality so that they can be distinguished from “exogenous” changes brought about by interventions.16 Another factor that can alter the trends in prevalence is HIV associated sub-fertility that could introduce biases in ANC attendance that change over time.17
Here we describe the expected dynamics of a generalised HIV epidemic using a newly developed mathematical model, and compare the prevalence data from countries included in this report with model predictions. Where the model can reproduce the observed changes in prevalence with “endogenous” changes only (that is, those caused by HIV and AIDS natural dynamics) it cannot be argued from the data that the population level risks of HIV infection have been altered by the adoption of safer sexual behaviour. On the other hand, if the model cannot reproduce the observed epidemiological trends without also assuming changes in risk behaviour, this provides evidence that the proximate determinants of HIV incidence have been altered through adoption of safer sexual practices.
METHODS
We developed a deterministic mathematical model of the heterosexual transmission of HIV in a sex, age, and sexual activity (defined according to the rate of sexual partner change) stratified population, based on earlier published models.17 To focus on trends in prevalence in young women attending ANCs the model included a detailed yearly age structure of young adults allowing changes in age of sexual debut and rates of partner change in those recently entering the sexually active population. Full details of the model can be found in the supplementary material (see online at http://sti.bmjjournals.com/supplemental/) but the key assumptions in the model are described here. HIV is assumed to be transmitted through sexual partnerships or at the time of birth from an infected mother to her child. The population is divided into five sexual activity groups with different numbers of sexual partnerships formed per year. On sexual debut most individuals enter the group with the lowest sexual activity, but a minority enter groups with much higher sexual activity. In response to differential mortality two assumptions are possible: (1) the highest sexual activity groups can be depleted if those with high risk suffer greater mortality; and (2) the relative sizes of the groups are maintained by recruiting individuals from other sexual activity groups into the higher activity groups.
An individual of a particular sex, age, and sexual activity forms a number of sexual partnerships each year, with partnerships preferentially directed between older men and younger women and with individuals of the same sexual activity class. Transmission of HIV is assumed to be prevented by consistent use of condoms with the probability of consistent use dependent on the age of both partners. To represent the long and variable incubation period and the higher transmission probability associated with initial and later stages of infection, those infected progress through three stages of asymptomatic infection prior to AIDS: a first stage lasting three months with a high transmission probability; a second stage lasting several years with the lowest transmission probability; and a third stage lasting six months with a high transmission probability.
A model scenario with no exogenous behaviour change was compared with one where behaviour change was assumed to reduce the rate of sexual partner change or the transmission probability (through increased condom use). Where behaviour data were available (using the same indicator in successive surveys) these were used to estimate the change in parameter values for an alternative run of the model. If no such data were available a stepwise change in the transmission probability per partnership was used instead.
From each country the following data were sought for model parameterisation: median age at first sex for males and females, age specific use of condoms (at last sex/with non-regular partner), age specific mean number of sexual partners in last year, and age of spouse or last partner. These population averages fail to specify some of the details of individual behaviour required to fully parameterise the model. To overcome this lack of detail in countrywide data we used detailed sexual behaviour data from a household based population survey in rural Zimbabwe18 to specify the heterogeneity in rates of change of sexual partners and the dependency of condom use on age of both partners. For each country all values were altered to generate the observed averages. The mean age difference between sexual partners was estimated by either the mean age difference between spouses or the difference in the median age of marriage between men and women. Where no data were available default model parameters were based on rural Zimbabwe data,18 with the exception of partner acquisition rates as a function of age, which were based instead on observed patterns reported in Cote d’Ivoire for 1994. All simulations were run using common demographic background rates19 such that in the absence of infection the population would grow at approximately 4% per year with life expectancy at birth for males and females 52.1 and 54.7, respectively. The behaviour data used to parameterise the model are summarised in table 1 and the sources are identified in the supplementary material. All model parameters are listed in tables S1–S6 in the supplementary material (see online at http://sti.bmjjournals.com/supplemental/).
Behavioural parameters used in the model
A brief summary of the HIV prevalence data used follows:
-
Haiti—5 urban ANC sites from 1993 to 200320
-
Kenya—13 urban ANC sites from 1990 to 200321
-
Zimbabwe—nationwide ANC sites from 2000 to 2004 (Genscreen test)22
-
Cote d’Ivoire—10 urban sites from 1997 to 2002
-
Malawi—19 nationwide sites from 1996 to 200323
-
Rwanda—24 nationwide ANC sites in 2002 and 200324
-
Uganda—5 ANC sites from 1992 to 2002 (St Mary’s Hospital, Lacor, Gulu (northern Uganda), St Francis Hospital, Kampala (central Uganda), Mbarara Hospital (southwestern Uganda), Jinja Hospital (eastern Uganda) and Mbale Hospital (eastern Uganda)25
-
Ethiopia—urban sites from 2001 to 2003.26
To avoid trends in prevalence reflecting changes in the population sampling, only data collected from the same ANCs over time were included in our analysis. Where sample sizes were available we could construct 95% confidence intervals around the prevalence estimates (data pooled by site and age if no weighting information available). If such data were not available we arbitrarily include a 3% uncertainty interval or give the range of estimates for specific sites.
The predicted growth in the prevalence of HIV from the model was roughly matched to prevalence by adjusting the transmission probability per sexual partnership and the assortativeness of mixing between the high and low sexual activity groups. Other model parameters values were chosen to maximise the natural decline in HIV prevalence and create a robust “null model” of trends without extrinsic behaviour change. These assumptions are outlined in the results. If the recorded changes in prevalence could not be reproduced without assuming changes in sexual behaviour, stepwise changes in behavioural parameters were made to reflect the trends in sexual behaviour observed in successive surveys. These changes were included at the time points between the surveys giving a likely match between the model and the data.
RESULTS
The aim of modelling the transmission dynamics of HIV here was to predict the course of the epidemic in the absence of behaviour change. This allows us to exclude the natural history of the epidemic in interpreting any observed reductions in prevalence. For a conservative analysis we need to adopt assumptions that maximise the predicted declines in prevalence.
As HIV spreads first among those with the highest risk of acquiring infection, incidence increases sharply, but as those high risk individuals die the risk of infection they pose to others is removed so that incidence may subsequently decline (fig 1A). A decline in prevalence 10–20 years into the epidemic could be the product of that historical reduction in incidence or a more recent reduction in incidence associated with the deliberate adoption of safer sexual behaviour. Understanding the determinants of that initial decline in incidence and how it influences later trends in prevalence is crucial in our analysis. The rapid local “saturation” of those at highest risk is a consequence of the extreme variance in sexual activity within the population10,27,28 with the majority forming few new sexual partnerships each year and a minority forming very many more.10,29,30 Soon after the infection is introduced to the population those individuals with the riskiest sexual behaviour become infected, especially if there is a high transmission probability of the virus in those recently infected (fig 1A). Subsequent infection mainly occurs in those with lower risk sexual behaviour and the number of new cases and the risk per susceptible decreases (Baggaley R, Boily MC, White RG, et al. Systematic review of HIV-1 transmission probabilities in absence of antiretroviral therapy. Manuscript in preparation). Whether this initial decline in incidence generates a subsequent fall in prevalence is determined by how closely incidence and prevalence are coupled—that is, the interval between infection and death.27 A long interval leads prevalence to record information about the risk experience accumulated over many years with the early reduction in incidence not manifest, but a shorter interval allows prevalence to follow the drop in incidence more closely15 (fig 1A). The relation between prevalence and incidence is easier to interpret in young people because infections will have been acquired recently as they have only recently become at risk (as they begin sexual activity). Thus, in young adults prevalence is more a reflection of the current pattern of HIV transmission and is less influenced by deaths among those infected. Changes in prevalence following the adoption of safer sexual behaviour should appear first and most clearly among young people31 (fig 1B).

Natural dynamics of generalised HIV epidemic. (A) Predicted HIV incidence per 100 person years at risk (thick black line) and HIV prevalence among women for varying periods from infection to death. For 25 year olds mean interval from infection until death is 11 years (thin black line), 9 years (dark grey line), 7 years (light grey line), 5 year (dashed line), and 3 years (dotted/dashed line). (B) HIV prevalence among women aged 20–24 years (grey lines) and 30–35 years (black lines) without behaviour change (solid lines) and with the transmission probability halving at year 15 (dashed lines). (C) The proportion of men and women currently forming more than one sexual partnership per year. (D) Predicted HIV incidence per 100 person years at risk (solid lines) and HIV prevalence among women (dashed lines) with the relative size of sexual activity groups being allowed to change freely (grey lines) and being held constant with recruitment to the high activity groups from lower activity groups (black lines).
Following the initial growth of an HIV epidemic, and as those with riskiest sexual behaviour who are infected die or reduce their sexual activity due to illness, the structure of the sexual network could begin to change; both because the high risk behaviour itself is lost, and because the opportunity for other individuals to form high risk partnerships is removed. This depends upon how an individual’s risk behaviour changes as they age and the change in risk behaviour of those who remain following the deaths of those most at risk. At one extreme, if individuals remain at the same level of risk throughout their life, average sexual behaviour naturally becomes safer as those with risky behaviour die (fig 1C). For this reason, changes in average sexual behaviour should be interpreted with some caution since the safer average behaviour may not be a consequence of the deliberate adoption of safer behaviours. In the model it is also possible to assume that as the number of high risk individuals declines less risky individuals can adopt higher risk behaviour to keep constant average rate of partner acquisition. In this case, incidence remains high and may balance the surge in AIDS related mortality, maintaining a steady prevalence of infection (fig 1D).
In interpreting trends in HIV prevalence we also need to be concerned with changing biases in the ANC population as a sample of women.32 Firstly, reductions in fertility caused by the progression of HIV infection could exaggerate the decline in prevalence seen in the ANC sample relative to the general population. Recent data suggest that fertility is suppressed before the final stages of HIV infection.33,34 Simulations show that this sub-fertility and exclusion from the ANC sample of those infected will occur rapidly (fig 2A). Secondly, the ANC sample might overrepresent the women most likely to be infected with HIV, since sexual behaviour that exposes the women to the infection (for example, unprotected sex) also exposes the women to the risk of pregnancy.32 Because prevalence among high risk women rises quickly and falls steeply an ANC sample may represent the extreme changes in prevalence (fig 2B).
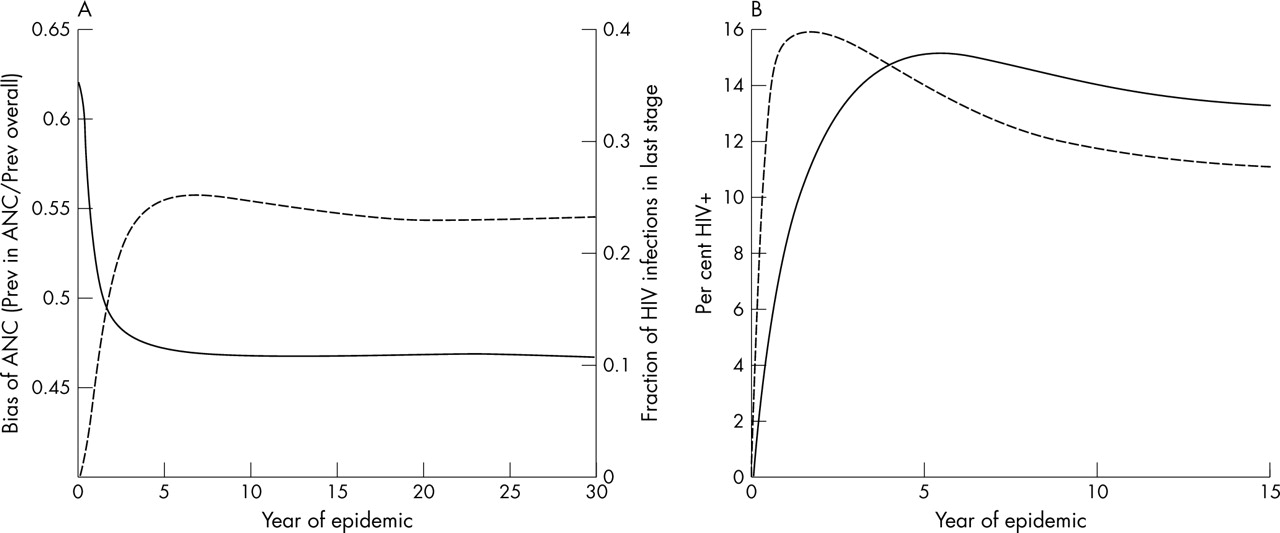
Biases in antenatal clinic (ANC) sample. (A) Ratio of percentage of women attending ANCs who are HIV+ and percentage of all HIV+ women, assuming that the probability of women being included in the ANC sample depends on stage of HIV (solid line) and the fraction of HIV cases in late stage of infection (tertiary stage or full-blown AIDS) (dashed line). (B) Percentage of women attending ANC who are HIV+ (dashed line) and percentage of all women HIV+ (solid line), assuming that the probability of being included in the ANC sample depends on sexual activity group.
Our exploratory analysis found that the most extreme natural declines in prevalence arise from the greatest contrast between the initial peak and subsequent low incidence level, and from the shortest period from infection to death. Within reasonable limits we maximised the initial heterogeneity in rate of sexual partnership formation and the variation in transmission probability with stage of HIV infection. The acute peak in incidence reflects a lack of geographic space, stochastic effects, and waiting times between sexual partnership formation and HIV transmission. All of these distribute the peak in incidence over time and lessen the predicted prevalence decline (results not shown). Prevalence declines most when there is no compensatory recruitment into the high sexual activity groups in response to differential mortality and appears most extreme when assuming that the ANC over-samples high risk individuals. All model parameters are listed in tables S1–S6 in the supplementary material (see online at http://sti.bmjjournals.com/supplemental/). In the case of Uganda, urban Kenya, Zimbabwe, and urban Haiti, under a range of realistic and extreme assumptions (not all shown), our model can only replicate observed declines in prevalence by assuming that risk behaviour has also declined.
The data analysed from Malawi, urban Cote d’Ivoire, and Rwanda show no sign of a decrease in prevalence among all adults, or selected age groups (fig 4). There is some evidence that the proportion of men and women having had more than one or two sexual partners in the last 12 months has decreased in Malawi and Cote d’Ivoire.23
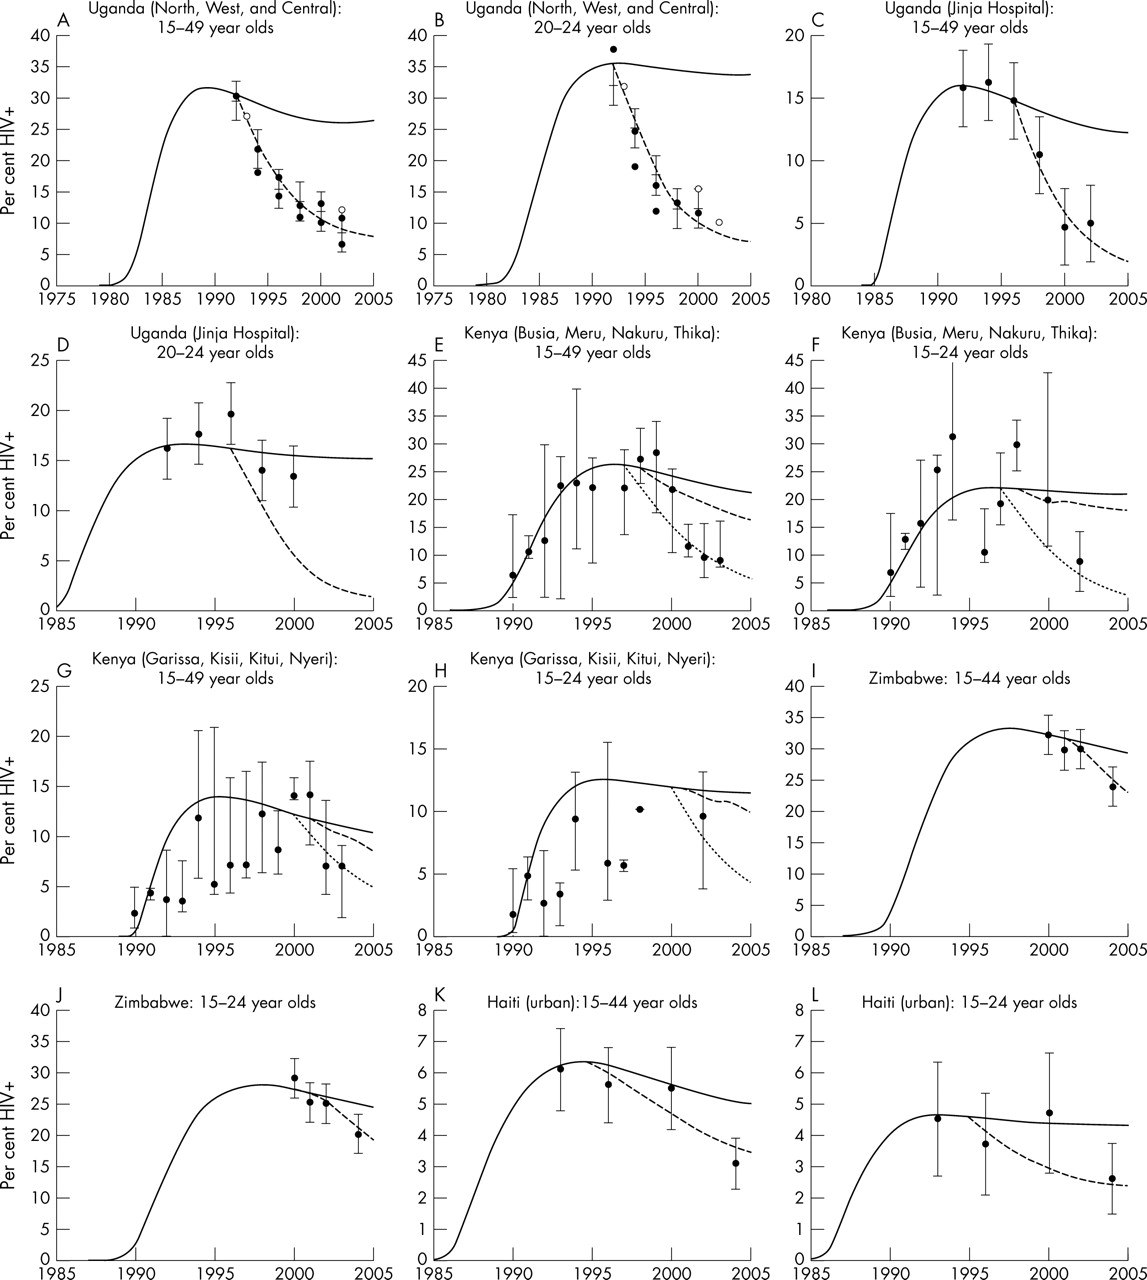
The decline in Uganda is the earliest and most researched.2,3 Sites in north, central, and west Uganda have a similar epidemic curve with prevalence among both 15–49 year old and 20–24 year old women declining from approximately 30% to 10% (fig 3A, B). These declines could be generated in our model with a reduction in the transmission probability of 75% in 1992—a similar reduction to that previously estimated.2,3 No subsequent reduction is necessary to generate the observed trends and the assumed change in risk pre-dates observational cohort data from Rakai used to argue that incidence has not fallen.35 In eastern sites (Jinja Hospital and Mbale Hospital) the decline in prevalence in women aged 15–49 years from approximately 15% to 5% (fig 3C) is only possible with behaviour change, whereas prevalence estimates for women aged 20–24 years show more fluctuations and are possible to model without risk behaviour changing (fig 3D). Such seemingly contradictory results may arise from the greater error in prevalence estimates from a more restricted age group (sample sizes were not available to estimate confidence intervals), or from shifting behavioural parameters (in particular, age at first sex), which alter the distribution of the infection with respect to age at the same time as overall prevalence is decreasing.

ANC prevalence data (dots), model output assuming no behaviour change (full lines) and model output assuming behaviour change (dashed lines). Uganda: St Mary’s Hospital, Lacor, Gulu, St Francis Hospital, Nsambya, Kampala, and Mbarara Hospital (A) 15–49 years olds and (B) 20–24 year olds; Jinja Hospital (C) 15–49 year olds and (D) 20–24 year olds (error bars ± 3%). Urban Kenya: Busia, Meru, Nakuru, and Thika (E) 15–49 year olds and (F) 15–24 year olds (error bars show range); Garissa, Kisii, Kitui and Nyeri (G) 15–49 year olds and (H) 15–24 year olds (error bars show range). Zimbabwe: (I) 15–44 year olds and (J) 15–24 year olds, (error bars ± 3%). Urban Haiti: (K) 15–44 year olds and (L) 15–24 year olds (error bars ± 95% CI).
In parts of urban Kenya HIV prevalence among women aged 15 and over fell from approximately 12% in 2001 to 9% in 2003 with a concomitant decline in those aged 20–24 years from 13% to 10%. The downturn in prevalence was particularly pronounced in four urban sites (Busia, Meru, Nakuru, and Thika) where median prevalence fell from 28% in 1999 to 9% in 2003 among 15–49 year old women and from 29% in 1998 to 9% in 2002 among 15–24 year olds (fig 3E, F). Again, to reproduce these changes requires assuming that risk behaviour has changed. Between behavioural surveys in 1993, 1998, and 2003 there were substantial reductions in the proportions of men and women having more than one sexual partner. In addition, between 1998 and 2003, median age at first sex for females increased. To represent these changes in the model, age specific reductions of the mean rate of partner change were assumed in 1998 and 2001 and an instantaneous increase in female age at first sex was included in 2001. The decrease in prevalence, though, is better matched with a reduction in the transmission probability of 70% in 1997 (dotted lines). Four other urban sites (Garissa, Kisii, Kitui, and Nyeri) also experienced a reduction in median prevalence: 14% in 2000 to 7% in 2003 among 15–49 year olds, and same behaviour changes were assumed to bring the model into agreement with the data (fig 3G). However, the trend in prevalence among 15–24 year olds is less clear and does not seem inconsistent with the null model (fig 3H).
In Zimbabwe between 2002 and 2004 a decline in prevalence from 29% to 24% is recorded among 15–44 year old women and from 25% to 20% among 15–24 year old women (fig 3I, J). In both cases, the observed changes cannot be reproduced through the natural evolution of the epidemic alone, but can be generated with if the overall probability of infection is reduced by half in 2001.
In urban Haiti, prevalence has decreased since 2000 from approximately 5.5% to 3% among 15–44 year old women—a decline that could not be generated in the absence of behaviour change (fig 3K). Among 15–24 year olds, prevalence has also declined although the uncertainty associated with these estimates not does rule out the possibility that prevalence has remained constant. In behavioural surveys there was a 20% decline in the mean number of sexual partners between 1994 and 2000 and condom use increased twofold to threefold between 2000/01 and 2003. These changes were represented in the model by a step-change in partner change rates in 1994 and in condom use in 1999.
Adult prevalence (15–49 years) in urban Ethiopia fell from 14% in 2001 to 12% in 2003 (fig 4A) and from 15% to 13% over the same time among 20–24 year olds (fig 4B). These modest declines could be reproduced by the model without assuming any changes to sexual risk behaviour.

ANC prevalence data (dots) and model output assuming no behaviour change (full lines). Urban Ethiopia: (A) 15–49 year olds, and (B) 20–24 year olds (error bars ± 95% CI). (C) Urban Cote d’Ivoire 15–49 year olds (error bars are ± 3%). (D) Rwanda 20–24 year olds (error bars are ±3%). (E) Malawi: 15–34 year olds (error bars are ± 3%).
DISCUSSION
Our model illustrates the potential for HIV prevalence to decline without a deliberate adoption of safer sexual behaviours. However, the inability of the model to replicate the extent of the observed declines allows us to be more confident that changes in prevalence in Uganda, parts of urban Kenya, Zimbabwe, and urban Haiti are unlikely to be a product of these natural dynamics. The declines observed can be contrasted with urban Ethiopia, where the prevalence patterns could be reproduced with sexual behaviour and HIV transmission remaining unchanged, and urban Cote d’Ivoire, Malawi, and Rwanda where aggregated prevalence has not recently decreased. This does not exclude the possibility, however, that behaviour change has had a significant impact on the HIV epidemic.
The model of HIV transmission is influenced by a large number of interacting variables which, without a dramatic increase in data sources, limits our ability to statistically fit the model and estimate the most likely value of particular parameters. A statistical interpretation of our results depends upon the confidence intervals around the prevalence estimates at particular time points and whether our extreme decline in prevalence falls within them. It should be noted that some of the prevalence estimates used here did not have reported sample sizes or statistical confidence intervals. In addition to statistical error, changing biases could lead to the observed and predicted trends separating. One such bias is suggested by recent data indicating that fertility is suppressed before the final stages of HIV infection.34 Sub-fertility in those with longstanding HIV infection could lead to their exclusion from the ANC sample, but our model indicates that the effects of this bias will pre-date the declines in prevalence we are now observing. Nationally, estimates of prevalence often fall as samples are recruited from progressively more remote populations or as HIV tests become more specific. To avoid these problems we have only presented data from clinics consistently included.
Restricting HIV prevalence data to the younger age groups often fails to help identify recent reductions in HIV incidence. In young age groups the confounding effects of mortality and sub-fertility on prevalence trends are minimised and reductions in incidence will be translated rapidly into reduced prevalence. However, the uncertainty associated with the prevalence point estimates is often too great to detect trends. In contrast, although prevalence estimates from across all adult ages are prone to natural reductions, they may be determined more precisely and so allow trends due to the natural evolution of the epidemic and due to behaviour change to be distinguished.
One of the problems in reconstructing HIV epidemics is that current sexual behaviour already includes reductions in risky sexual behaviour brought about by the HIV epidemic and associated mortality in those who were previously at the greatest risk of infection. We are forced to assume that the heterogeneity in sexual partner change rates was originally greater than that observed today. In addition, while we attempted a reconstruction of country specific epidemics, local patterns of risk were often not available, necessitating the adoption of standard patterns for condom use and age specific partner change rates. Fortunately, despite being important for fitting age and sex specific prevalence, these patterns have little bearing on the course of the epidemic once its magnitude is established.
In summary, our analysis supports a belief that behaviour change and decreased incidence is reducing prevalence in four countries with generalised epidemics. In all but Uganda the declines in prevalence are quite recent though the evidence of behaviour change in parts of urban Kenya is accumulating where several sequential HIV prevalence estimates have shown a continued decline. Although a substantial prevalence decline in Zimbabwe has only been detected recently, credence is lent to this observation by the increasing evidence of behavioural change (Gregson S, Garnett GP, Nyamukapa CA, et al. HIV decline associated with behaviour change in eastern Zimbabwe. Submitted for publication). The observed dip in prevalence in urban Haiti, on the other hand, could turn out to be anomalous. For a long time Uganda2,3 and Thailand4,5 have been the key national level examples of success in reducing HIV incidence and the main source of evidence on HIV prevention. Perhaps it is time for Kenya and Zimbabwe to be added to the list.
Key messages
-
Twenty years into the generalised epidemics of sub-Saharan Africa, evidence is emerging from some countries that HIV prevalence is falling. Prevalence declines can result not only from individuals adopting safer sexual behaviour but also through AIDS associated mortality.
-
A mathematical model has been used to assess whether the observed declines could be the result only of mortality and not of changing sexual behaviour.
-
In Uganda, parts of urban Kenya, Zimbabwe, and urban Haiti, HIV prevalence has declined further than would be expected through the effects of mortality alone, suggesting that in these settings individuals have begun to adopt safer sexual behaviour.
AUTHORS’ CONTRIBUTIONS
TBH was responsible for programming and implementing the mathematical model. The paper was written by TBH and GPG and redrafted by SG, JMG, JS, and PG. The study was jointly conceived by all of the authors and all contributed to the compilation, assessment, and analysis of the data.
REFERENCES
Supplementary materials
Files in this Data Supplement:
- view PDF - Declines in HIV prevalence can be associated with changing sexual behaviour in Uganda, Urban Kenya, Zimbabwe and Urban Haiti - supplementary material.
Footnotes
-
TBH, SG and GPG thank The Wellcome Trust and UNAIDS for Grant support. GPG thanks the MRC for grant support.
-
Competing interests: none declared
-
The findings and conclusions in this report are those of the authors and do not necessarily represent the views of the Centers for Disease Control and Prevention.
-
Edited by N Walker, H Ward and R Miller