Article Text

Abstract
Objective To evaluate the cost-effectiveness of diagnostic strategies for coronary heart disease (CHD) derived from the CE-MARC study.
Design Cost-effectiveness analysis using a decision analytic model to compare eight strategies for the diagnosis of CHD.
Setting Secondary care out-patients (Cardiology Department).
Patients Patients referred to cardiologists for the further evaluation of symptoms thought to be angina pectoris.
Interventions Eight different strategies were considered, including different combinations of exercise treadmill testing (ETT), single-photon emission CT (SPECT), cardiovascular magnetic resonance (CMR) and coronary angiography (CA).
Main outcome measures Costs expressed as UK sterling in 2010–2011 prices and health outcomes in quality-adjusted life-years (QALYs). The time horizon was 50 years.
Results Based on the characteristics of patients in the CE-MARC study, only two strategies appear potentially cost-effective for diagnosis of CHD, both including CMR. The choice is between two strategies: one in which CMR follows a positive or inconclusive ETT, followed by CA if CMR is positive or inconclusive (Strategy 3 in the model); and the other where CMR is followed by CA if CMR is positive or inconclusive (Strategy 5 in the model). The more cost-effective of these two rests on the threshold cost per QALY gained below which health systems define an intervention as cost-effective. Strategy 3 appears cost-effective at the lower end of the threshold range used in the UK (£20 000 per QALY gained), while Strategy 5 appears cost-effective at the higher end of the threshold range (£30 000 per QALY). The results are robust to various sources of uncertainty although prior likelihood of CHD requiring revascularisation and the rate at which false negative patients are eventually appropriately identified do impact upon the results.
Conclusions The CE-MARC study showed that CMR had superior diagnostic accuracy to SPECT and concluded that CMR should be more widely used in the investigation of patients with CHD. The economic evaluation results show that using CMR is also a cost-effective strategy and supports the wider adoption of this modality.
- Imaging And Diagnostics
Statistics from Altmetric.com
Introduction
Coronary heart disease (CHD) is a leading cause of death and disability worldwide. In the UK, over 2 million people are living with CHD and, in 2007, it was estimated to account for over 94 000 deaths, of which over 31 000 were considered premature.1
A variety of investigations may be used to diagnose CHD and identify patients who require coronary revascularisation; all these tests, however, have their limitations. Increasingly, non-invasive imaging has replaced exercise treadmill testing (ETT), with single-photon emission CT (SPECT) being the most commonly used test for myocardial ischaemia worldwide.2 Cardiovascular magnetic resonance (CMR) imaging is increasingly used for the diagnosis of CHD as a result of its safety (no ionising radiation), high spatial resolution and ability to assess multiple aspects of CHD pathology in both the stable and unstable clinical settings.3–8
The diagnosis of CHD has no direct health benefit in itself; instead, any improved accuracy in diagnosis should result in more appropriate treatment which can confer health benefits on patients. The optimal management of patients with CHD continues to be debated, but options include medical therapy, percutaneous coronary intervention (PCI) or coronary artery bypass grafting (CABG). Many patients with CHD, however, do not have significant coronary artery stenosis and so do not require revascularisation. In the absence of detectable ischaemia, current guidelines recommend risk factor modification and optimal medical therapy as first line therapy for angina symptom control.9
Establishing the best diagnostic strategy for patients with suspected CHD is central to providing appropriate therapeutic interventions. To inform this decision, Clinical evaluation of magnetic resonance imaging in coronary heart disease study (CE-MARC) was the largest prospective evaluation to date of the diagnostic accuracy of CMR compared with the reference standard of coronary angiography (CA) for patients referred to cardiologists for the further investigation of symptoms thought to be angina pectoris.10 ,11 All patients underwent ETT if physically able, and were scheduled for SPECT and CMR (in random order) followed by CA irrespective of clinical intention. This evaluation considers the cost-effectiveness of different diagnostic strategies for CHD based on the evidence gathered in the CE-MARC study together with other published evidence.
Methods
Overview
The aim of the analysis was to determine the cost-effectiveness of alternative diagnostic strategies derived from the CE-MARC study for patients referred to cardiologists with suspected angina. The methods employed are consistent with those detailed by the National Institute for Health and Clinical Excellence (NICE).12 Costs falling on the NHS and Personal Social Services are considered and outcomes are measured in terms of quality-adjusted life-years (QALYs). The time horizon is 50 years and future costs and QALYs are discounted at 3.5% per annum. All costs are calculated in UK sterling in 2010–2011 prices. For the base case analysis, the case of a 60-year-old male with grade 2 symptoms on the Canadian Cardiovascular Society (CCS) angina grading scale13 and prior likelihood of significant stenosis requiring revascularisation of 39.5% is used; 15.9% of patients are considered to have CHD but not significant coronary artery stenosis (based on CE-MARC data).11 It is assumed the patients are fit enough to undergo ETT. The choice of the base case characteristics are based on patients’ characteristics from the CE-MARC study and clinical opinion. Alternative scenarios for age, gender, CCS grade, prior likelihood of disease and costs of the diagnostic tests are also considered.
Diagnostic pathways
The aim of diagnostic testing is to identify patients with significant coronary artery stenosis who require revascularisation (either PCI or CABG). It is assumed all patients who are suspected of having significant coronary stenosis must undergo a CA as a definitive test before revascularisation. As the CA is regarded as the ‘gold standard’ test (ie, it is assumed to have sensitivity and specificity of 100%), it is assumed that there can be no false positives, so no patients will receive an inappropriate revascularisation procedure. However, as most of the non-invasive diagnostic tests (ETT, SPECT and CMR) are not sufficiently accurate (ie, sensitivities and specificities below 100%), some patients with clinically significant stenosis requiring revascularisation will not progress across the diagnostic pathways to CA, as a consequence of a false negative (FN) test. Similarly, some patients without clinically significant stenosis will progress to CA, as a consequence of a false positive test, with its associated cost and morbidity/mortality risk. Patients incorrectly identified as not having significant stenosis will not receive an appropriate revascularisation procedure and, as a result, may experience less relief from their angina symptoms until their disease is subsequently correctly managed. It is assumed, however, that these ‘false negative’ cases in terms of selection for revascularisation will have their ischaemia treated by optimal medical therapy. Equally, there will be patients without clinically significant stenosis and hence who do not require revascularisation, but who do suffer from angina; these patients are assumed to receive risk factor modification and optimal medical management.
Identification strategies
Eight possible diagnostic strategies are derived from the CE-MARC study and compared in the analysis based upon consideration of how the tests are likely to be sequentially used in clinical practice:
-
CA only
-
ETT, followed by CA if ETT is positive or inconclusive
-
ETT, followed by CMR if ETT is positive or inconclusive, followed by CA if the CMR is positive or inconclusive
-
ETT, followed by SPECT if ETT is positive or inconclusive, followed by CA if the SPECT is positive or inconclusive
-
CMR, followed by CA if CMR is positive or inconclusive
-
SPECT, followed by CA if SPECT is positive or inconclusive
-
ETT, followed by CA if positive, or followed by CMR if ETT is inconclusive, followed by CA if CMR is positive or inconclusive
-
ETT, followed by CA if positive, or followed by SPECT if ETT is inconclusive, followed by CA if SPECT is positive or inconclusive.
Model structure
To conduct the economic evaluation a decision analytic model was developed. For the initial diagnosis a decision tree allocates patients to the appropriate diagnostic group. The prognostic implications of being in one of these groups are then quantified using three distinct Markov models. An example of the decision tree for Strategy 2 (ETT, followed by CA if ETT is positive or inconclusive) is shown in figure 1.

Structure of decision tree using Strategy 2 as an example. CA, coronary angiography; CABG, coronary artery bypass grafting; CHD, coronary heart disease; ETT, exercise treadmill testing; PCI, percutaneous coronary intervention.
Patients with significant stenosis requiring revascularisation are allocated to one of three states as a result of the diagnostic strategy: true positive who are correctly identified and revascularised; FN who are misidentified and not revascularised; or dead as a result of the mortality risks associated with CA, PCI and CABG. Patients without significant stenosis can be separated into those with and without CHD, and allocated to the states true negative (TN) with angina, TN without angina and dead. The proportion of patients in each state is dependent upon the sensitivities and specificities of the various tests in a diagnostic strategy.
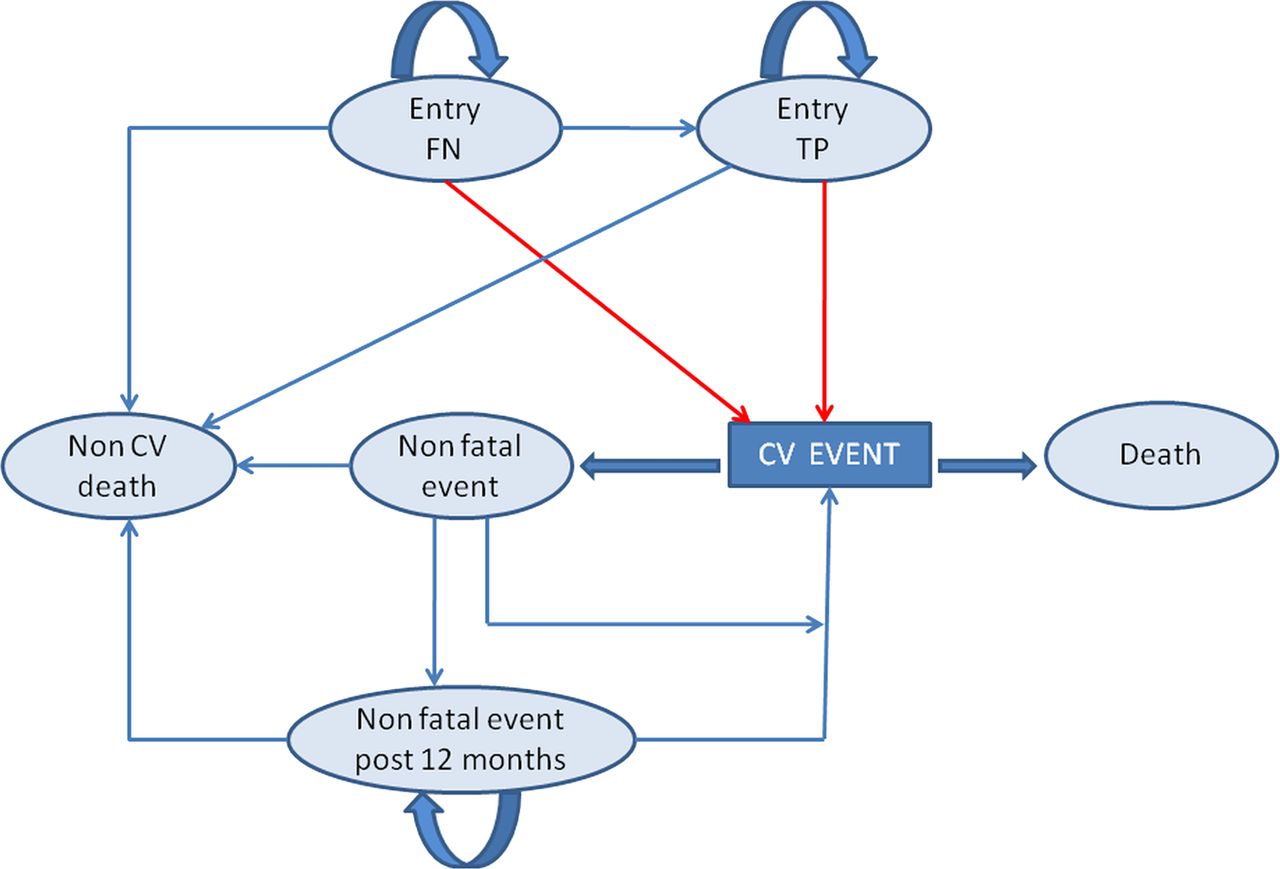
The prognostic Markov model is based on a previously published model for angina based on the EUROPA trial and captures future cardiovascular events and mortality.14 Submodels relate to patients with significant stenosis (see figure 2) and to patients without significant stenosis but with angina (see figure 3). For patients without significant stenosis or angina, a simple Markov model was developed incorporating only two states, alive and dead. Full descriptions of the models can be found in online supplementary appendix 1. Improved identification of patients with significant stenosis will result in more patients receiving appropriate revascularisation, and therefore receiving greater symptom relief and higher health related quality of life (HRQoL). The model allows for FN patients to be subsequently identified and revascularised.

Markov model for patients with severe stenosis. CV, cardiovascular; FN, false negative; TP, true positive.

Markov model for patients with angina but without severe stenosis. CV, cardiovascular; TN, true negative.
Parameter estimates
Parameter estimates are derived from the CE-MARC study,10 ,11 the EUROPA study14 and from reviews of the published literature.15–17
Patient characteristics, effectiveness and natural history data
In the base case, the prior likelihood of significant stenosis requiring revascularisation and the proportion of patients without a significant stenosis but with CHD (based on patients with between 10% and 69% coronary luminal stenosis) is taken from CE-MARC. An alternative scenario was considered where up to 20% of patients with significant stenosis would not be scheduled for revascularisation, for example, due to patient preference or comorbidity. Following a positive test, these patients were assumed to receive optimal medical therapy instead (based on CE-MARC data).
The CE-MARC study also provides estimates of test accuracy.11 To account for correlations between tests within diagnostic strategies, the sensitivities and specificities of tests are calculated conditional on positive/uncertain results in earlier tests in the strategy. The proportions of patients with severe stenosis suitable for PCI and CABG are based on estimates from UK practice.5–16 Mortality rates for the procedures are based on UK estimates.15 ,16 The parameter estimates for the diagnostic strategies are shown in table 1.
Parameters for diagnostic strategies
The risks of cardiovascular events for true positive, FN and TN patients with angina are based on the equations from a previously published model and patient covariates, which allow risk to be conditioned on factors such as age and gender.14 The equations also allow for the capture of increased risk following a non-fatal cardiovascular event. The non-cardiovascular mortality risk was derived from UK life tables.18
To capture the increased risk of cancer mortality as a result of ionising radiation from certain diagnostic tests and revascularisation procedures (CA, SPECT and PCI), evidence on radiation dose and the consequential lifetime risk of cancer mortality is incorporated into the model (for more details see online supplementary appendix 2).19–21
No evidence was identified on the time it would take to correctly diagnose FN patients. Therefore, an exercise was conducted with a sample of consultant cardiologists (n=9) to elicit estimates of the proportion of FN patients who would be expected to be correctly diagnosed within a year based on a patient's CCS grade (full details of the exercise can be found in online supplementary appendix 3).
For TN patients without angina, the risk of mortality from all causes was taken from UK life tables.18 The parameter estimates for the Markov models are shown in table 2.
Parameters for Markov models
Resource use and costs
Costs for the diagnostic tests and revascularisation procedures are taken from UK sources and based on 2010–2011 prices.22 ,23 However, costs may vary as there are presently no national tariffs for cardiac imaging. Therefore, a scenario analysis considers the cost differential between SPECT and CMR imaging. These costs are presented in table 1.
For patients with significant stenosis and those with angina but without significant stenosis, the costs of the following were included: general treatment, fatal and non-fatal cardiovascular events, and fatal non-cardiovascular events. These costs were derived from the EUROPA trial and inflated to 2010–2011 prices.14 ,24 No costs other than those of the initial diagnostic tests were considered for patients who did not have significant stenosis or angina. These costs are shown in table 2.
Health related quality of life
HRQoL is incorporated in terms of weights on a scale from 0 (death) to 1 (good health). Evidence was sought based on the EQ-5D instrument25 which is the preferred measure of NICE.12 Estimates are based on the combination of several sources and assumptions26–28 to give HRQoL weights by age, gender, initial CCS grade and treatment status (whether the patient had received a revascularisation procedure or medical management). It is assumed that HRQoL reductions for patients experiencing angina were a fixed proportion of the HRQoL of the general population by age; however, this assumption is tested in a scenario analysis using fixed absolute HRQoL decrement from angina symptoms. Full details of the sources and methods used are provided in online supplementary appendix 4.
Analysis
Standard decision rules are used to identify the most cost-effective diagnostic strategy for CHD based on a given set of patient characteristics.29 This involves ranking strategies in terms of their expected costs or effectiveness, removing strategies which are subject to dominance (less effective and more costly than one or more other strategies), then removing strategies subject to extended dominance (where a linear combination of other strategies dominates them). Incremental cost-effectiveness ratios (ICERs) are calculated for all remaining options: the additional cost per QALY gained of a strategy compared with the next most effective. To assess which option is potentially cost-effective, the range of cost-effectiveness thresholds used by NICE in the UK (£20 000–£30 000 per QALY) is used,12 such that the most effective option with an ICER below the threshold is considered the cost-effective strategy.
To reflect the uncertainty in the evidence used in the model, input parameters are entered as probability distributions. Probabilistic sensitivity analysis is then used to calculate the mean costs and QALYs for each strategy and the probability that a strategy is cost-effective for a given cost-effectiveness threshold (in this case for £20 000 per QALY and £30 000 per QALY).29
A range of alternative scenarios is also considered in the model including varying CCS grade, gender, age, prior likelihood of CHD requiring revascularisation, the impact of ionising radiation on cancer, risk of cardiovascular events following revascularisation, HRQoL decrements and the cost of diagnostic tests.
Results
Base case
Cost-effectiveness results for the base case and scenario analyses are presented in table 3 with dominated and extendedly dominated strategies excluded. In the base case (60-year-old male with suspected CCS grade 2 and a prior likelihood of significant stenosis of 39.5%), four of the diagnostic strategies are not dominated or extendedly dominated. The least costly and least effective of these strategies is Strategy 6, where patients are first tested with SPECT and those identified as positive or inconclusive then receive a CA to confirm the diagnosis. When the next more effective strategy, Strategy 3 (ETT, followed by CMR if ETT is positive, followed by CA if CMR is positive or inconclusive), is compared with Strategy 6 an ICER of £7779 per QALY is generated. When the next more effective strategy, Strategy 5 (CMR followed by CA if CMR is positive or inconclusive), is compared with Strategy 3, an ICER of £26 858 per QALY is generated. When the most expensive strategy, Strategy 7 (ETT, followed by CA if positive, or followed by CMR if ETT is inconclusive, followed by CA if CMR is positive), is compared with Strategy 5, an ICER of £113 401 per QALY is generated.
Cost-effectiveness results
Therefore, below the lower limit of cost-effectiveness threshold range of NICE (£20 000per QALY), Strategy 3 appears to be the cost-effective option. However, if the upper limit of the cost-effective threshold range of NICE is used (£30 000per QALY), Strategy 5 appears to be the cost-effective strategy. The probabilities of Strategy 3 and Strategy 5 being cost-effective at a cost-effectiveness threshold of £20 000 per QALY are 0.5534 and 0.4482. At a threshold of £30 000 per QALY, the probabilities are 0.4708 and 0.5082, respectively.
Scenario analyses
Alternative scenarios relating to gender, increasing the base case age to 70-years-old, assuming the cancer risk from ionising radiation is zero and altering the impact of revascularisation on the risk of subsequent cardiovascular events have minimal impact on the results (table 3). Reducing the base case age to 50-years-old, making HRQoL decrements absolute rather than relative or allowing for patients with significant stenosis, which is not scheduled for revascularisation, results in Strategy 3 appearing cost-effective at both threshold levels.
Increasing the severity of symptoms from CCS grade 2 to grade 4 results in Strategy 5 appearing to be the cost-effective strategy at the lower as well as the higher thresholds. Altering the prior likelihood of CHD requiring revascularisation does appear to have a marked impact on cost-effectiveness. Reducing the prior likelihood to 20% (compared with 39.5% in the base-case) led to Strategy 3 dominating all other strategies (ie, it has lower cost and higher outcomes). If the prior likelihood is increased to 80% then Strategy 2 (ETT followed by CA if ETT is positive or inconclusive) is the cost-effective strategy with an ICER of £8034 per QALY, as well as being the most effective strategy.
Altering the reidentification rate of FN patients also impacted upon the cost-effective strategy. When the rate is halved, Strategy 5 is the cost-effective option at the lower threshold, while Strategy 7 is the cost-effective option at the higher threshold. However, when the rate of reidentification of FN is increased, Strategy 6 (SPECT followed by CA if SPECT is positive or inconclusive), the least costly and effective strategy, appeared cost-effective across the range of NICE threshold.
Given the lack of a national price tariff for the diagnostic tests, the cost increment of CMR compared with SPECT was varied to assess the impact on cost-effectiveness (in the base case the cost increment was £20). When the cost increment was reduced to £0, Strategy 5 appears cost-effective even at the lower threshold of £20 000 per QALY. However, when the cost increment is increased to £75, Strategy 5 no longer appears among the non-dominated strategies, with Strategy 3 appearing cost-effective at both threshold levels. When the cost increment is increased to £100, Strategy 6 appears to be the cost-effective option at the lower threshold, while Strategy 3 still appears to be the cost-effective option at the higher threshold.
Discussion
Principal findings
Based on the characteristics of the patients recruited to, and the results of, the CE-MARC study and the other evidence and assumptions, two strategies appear cost-effective at UK NICE accepted cost-effectiveness thresholds. The choice between Strategy 3 (ETT, followed by CMR if ETT is positive or inconclusive, followed by CA if CMR is positive or inconclusive) and Strategy 5 (CMR followed by CA if CMR is positive or inconclusive) rests upon whether the lower or higher limit of the NICE cost-effectiveness threshold range is used. The results are robust under various alternative scenarios. The fact that both strategies contain CMR supports the results of the CE-MARC study: that CMR's high diagnostic accuracy in CHD and superiority over SPECT indicates it should be more widely used in the investigation of CHD.11
The secondary analysis considering the incremental cost of CMR to SPECT showed that CMR was likely to remain part of a cost-effective strategy as long as its incremental cost is not too large (a threshold analysis showed that the incremental cost needed to be less than £90 at a threshold of £20 000 per QALY, and less than £115 at the threshold of £30 000 per QALY). As it stands, no national tariff for cardiac imaging exists in the UK; the development of national reference costs for CMR, and cardiac imaging more generally, would be of great value in ensuring that incremental cost of CMR does not exceed this value so that CMR remains cost-effective.
Our results also demonstrated that the prior likelihood of CHD is an important determinant of which strategy is cost-effective. There is little contemporary evidence to predict the prior likelihood of CHD on the basis of a patient's presenting characteristics. Recent guidelines from NICE refer to published data from the 1970s.1 ,30 Our results suggest that examining predictors of this prior likelihood would be a valuable area of further research. In principle, this could facilitate the appropriate stratification of patients on the basis of their prior likelihood, and this is likely to lead to an individualised choice of diagnostic strategies being cost-effective compared with using a single strategy for all patients.
Other studies
No other studies were identified which compared SPECT and CMR for identification of CHD using methods for the economic evaluation recommended by NICE, that is, which reported a cost per QALY outcome.12 Dewey and Hamm31 found that CMR was not cost-effective for any pretest likelihood of CHD but this was based upon the use of cost per correct diagnosis, which is a limited outcome measure for economic evaluation. Other published studies and meta-analyses of the diagnostic accuracy of SPECT and CMR have shown comparable results. For example, the sensitivity of CMR in CE-MARC was similar to that in a recent CMR meta-analysis32 (86% vs 89%) and to a prospective study of women (84%).33 Previous studies of SPECT have shown a wide range in sensitivity (63%–93%) and specificity (10%–90%) compared with x-ray angiography.34–36 This may be due to the fact that published SPECT data are heterogeneous for population, radioisotope tracer, mode of stress and protocol; notably, before CE-MARC, SPECT had never been tested prospectively against CA in such large numbers and in an unselected patient population of this kind.
Strengths and limitations
This study provides the first assessment of the cost-effectiveness of various strategies containing SPECT and CMR for the diagnosis of CHD which meet UK guidelines for cost-effectiveness analyses.31 The CE-MARC study is the largest prospective evaluation of CMR to date and allowed for robust estimates of diagnostic accuracy for the different tests, resulting in high internal validity for the analysis. Access to data from the CE-MARC study also allowed for correlation in diagnostic accuracies along strategies, removing the need for assumptions about independence in diagnostic accuracy between tests. The use of one diagnostic study which allows the estimation of correlations may be preferable to a synthesis of summary data from multiple studies, particularly given that the methods for meta-analysis of diagnostic accuracy are not well established or validated.37
A possible weakness of the analysis is the exclusion of other technologies not included in the CE-MARC study which may prove to be constituents of a cost-effective diagnostic strategy. For example, CT coronary angiography (CTCA) is becoming more widely available for the diagnosis of CHD.1 ,38 However, as there is a paucity of CTCA data in unselected patient populations and which are comparable with the CE-MARC study, and also a dearth of methods for the synthesis of diagnostic data, we did not want to compromise the high internal validity of the CE-MARC study by including data on diagnostic accuracy from other modalities not included in CE-MARC. Further to this, the use of CTCA in a population with medium to high pretest likelihood of CHD, such as that in CE-MARC, is not currently recommended in UK NICE guidelines (CG95), in part due to the issue of potential high false positive rates in those with coronary artery calcification.1
This study has not explicitly considered patients who were unfit to undergo ETT. In the CE-MARC study, around 20% of patients were unfit for ETT. However, as no difference was observed in the sensitivities of subsequent tests between the fit and unfit populations, the use of CE-MARC data for all patients for the accuracy of SPECT and CMR will not impact upon the results. In those patients unfit for ETT, only those strategies excluding ETT should be considered.
This analysis has only considered mortality as a result of cancers caused by radiation and not the morbidity or costs associated with such cancers, which may bias the results in favour of those strategies which result in patients receiving a greater radiation dose. However, this effect is likely to be negligible given the low risk of radiation induced cancer. This focus in the modelling on mortality risks rather than morbidity impacts is also true for other tests considered but, again, the impact on cost-effectiveness results is likely to be minimal.
Another possible limitation is that the model assumes that all diagnostic strategies take the same time from start to finish. However, this may not be the case, as more tests are likely to increase the length of the strategy and, therefore, the time until the patient receives the benefits of revascularisation.
The study is focused on the costs and effects of alternative diagnostic tests in a UK NHS context. The focus on a single healthcare system is an inevitable feature of all economic evaluations given that much evidence is country specific, particularly costs. The extent to which this analysis generalises to other settings needs careful consideration. However, the developed model can be readily adapted to assess the cost-effectiveness in other jurisdictions.
Conclusions
The results from this economic evaluation suggest that CMR should be considered as part of a diagnostic strategy for the identification of patients with CHD suitable for revascularisation. The exact strategy will depend on the cost-effectiveness threshold used as well as several other factors, most notably the prior likelihood of CHD in the population. However, between the thresholds of £20 000 and £30 000 per QALY (lower and upper limits considered cost-effective by NICE), CMR forms part of the optimum investigation strategy for the investigation of patients with CHD.
References
Supplementary materials
Supplementary Data
This web only file has been produced by the BMJ Publishing Group from an electronic file supplied by the author(s) and has not been edited for content.
Files in this Data Supplement:
- Data supplement 1 - Online appendices
Footnotes
-
Contributors All authors contributed to the interpretation of the data and to several drafts of the paper. SW, FG, CM and MS developed the model used to evaluate the diagnostic strategies. JPG, SGB and SP provided advice throughout the model development process. JPG planned the CE-MARC study, led the clinical trial, analysed the data and interpreted the results. SGB, SP and JN planned the study, analysed the data and interpreted the results.
-
Funding This work was funded by the British Heart Foundation research grant number: RG/05/004.
-
Competing interests None.
-
Provenance and peer review Not commissioned; externally peer reviewed.