Article Text

Abstract
Objectives To estimate the cost-effectiveness of delayed troponin testing for myocardial infarction compared with troponin testing at presentation.
Design Decision analysis modelling of cost-effectiveness using secondary data sources.
Setting Acute hospitals in the UK.
Population Patients attending hospital with suspected myocardial infarction but a normal or non-diagnostic ECG and no major comorbidities requiring admission.
Interventions Delayed troponin testing (10 h after symptom onset) compared with standard and high-sensitivity troponin testing at presentation and no testing. Sensitivity analysis evaluated high-sensitivity troponin testing 3 h after initial assessment.
Main outcome measures The incremental cost per quality-adjusted life year (QALY) gained by each strategy, compared with the next most effective alternative, and the probability of each strategy being cost-effective at varying willingness-to-pay per QALY gained.
Results In all scenarios tested, presentation high-sensitivity troponin testing was the most effective strategy with an incremental cost-effectiveness ratio below the £20 000/QALY threshold. 10 h troponin testing was only likely to be cost-effective if a discharge decision could be made as soon as a negative result was available and the £30 000/QALY threshold was used, or if a lower sensitivity estimate for presentation high-sensitivity troponin was assumed. Sensitivity analysis showed that including high-sensitivity troponin testing at presentation and 3 h in the analysis makes this the most cost-effective strategy.
Conclusions Delayed troponin testing is unlikely to be cost-effective compared with high-sensitivity troponin testing at presentation in most scenarios. Current NICE chest pain guidelines do not promote cost-effective care.
- Myocardial infarction
- cost-effectiveness
- cardiac biomarkers
- quality of care and outcomes
- delivery of care
- myocardial ischaemia and infarction
- acute coronary syndrome
- natriuretic peptides
- troponin T
- coronary artery disease
- air pollution
- progenitor cells
- coronary angioplasty
- intravascular ultrasound
- coronary vasomotion
- endogenous fibrinolysis
- endothelium
- platelet activation
Statistics from Altmetric.com
- Myocardial infarction
- cost-effectiveness
- cardiac biomarkers
- quality of care and outcomes
- delivery of care
- myocardial ischaemia and infarction
- acute coronary syndrome
- natriuretic peptides
- troponin T
- coronary artery disease
- air pollution
- progenitor cells
- coronary angioplasty
- intravascular ultrasound
- coronary vasomotion
- endogenous fibrinolysis
- endothelium
- platelet activation
Background
In the presence of symptoms of myocardial ischaemia, the diagnosis of myocardial infarction (MI) requires detection of a rise and/or fall of cardiac biomarkers (preferably troponin) with at least one value above the 99th percentile of the upper reference limit.1 Troponin sensitivity is suboptimal in the initial hours after symptom onset, so guidelines issued by the National Institute for Health and Clinical Excellence (NICE)2 and the European Society for Cardiology,3 respectively, recommend repeat troponin testing 10–12 h after symptom onset, and 6–9 h after initial assessment, although European Society for Cardiology guidelines also recommend repeat testing 3 h after initial assessment if a high-sensitivity assay is available. Patients with symptoms suggestive of acute MI typically present to hospital around 2–3 h after symptom onset.4 As a consequence, MI cannot usually be ruled out within a typical emergency department length of stay, and hospital admission is often required. Chest pain admissions more than doubled in England between 1998 and 2010 from 114 828 in 1998–1999 to 253 765 in 2009–2010,5 while admissions for diagnosed MI decreased from 67 166 to 50 386 over the same time period.
The development of high-sensitivity troponin assays has raised the possibility that delayed troponin testing and hospital admission could be avoided. High-sensitivity troponin assays have been evaluated in large representative cohorts,6 ,7 and are shown to have high sensitivity at presentation. We therefore have good estimates of the accuracy of early troponin strategies, but it is not clear how these translate into estimates of cost-effectiveness. Even a high-sensitivity assay is suboptimal at presentation, and reliance on presentation testing will miss cases of MI that would be detected by delayed testing. The decision to recommend delayed testing in guidelines depends upon weighing the benefits of detecting additional cases of MI against the additional costs incurred by delayed testing, and is fundamentally an issue of cost-effectiveness.
The cost-effectiveness of a more effective and expensive diagnostic strategy can be estimated by comparing the outcomes and costs associated with the strategy, with the next most effective alternative. Modelling is used to estimate how higher diagnostic accuracy leads to improved patient outcomes. If these outcomes are estimated as quality-adjusted life years (QALYs) then the incremental cost-effectiveness ratio (ICER), or cost per QALY gained, can be calculated and compared with alternative uses of healthcare funding. In the UK, NICE typically recommends in favour of funding interventions with an ICER below a threshold of £20 000/QALY or £30 000/QALY, and recommends against funding interventions with an ICER above these thresholds. We therefore aimed to estimate the incremental cost per QALY of delayed troponin testing compared with presentation testing and no testing, to determine which diagnostic strategy should be recommended, according to typical NICE thresholds for cost-effectiveness.
Methods
We developed a decision analysis model to estimate the cost-effectiveness of diagnostic strategies for MI, measured as the incremental cost per QALY gained by each strategy compared with the next most effective alternative. The model was applied to a hypothetical population of 1000 patients attending hospital with symptoms suggesting MI, but a normal or non-diagnostic ECG, and no major comorbidities requiring hospital treatment. Patient characteristics (age, gender, presence or absence of MI, time of presentation to hospital, and delay between symptom onset and presentation) were determined by sampling data from a recent pragmatic trial of diagnostic strategies for suspected MI.8 The main analysis sampled those without known coronary artery disease (CAD), and a secondary analysis sampled those with known CAD.
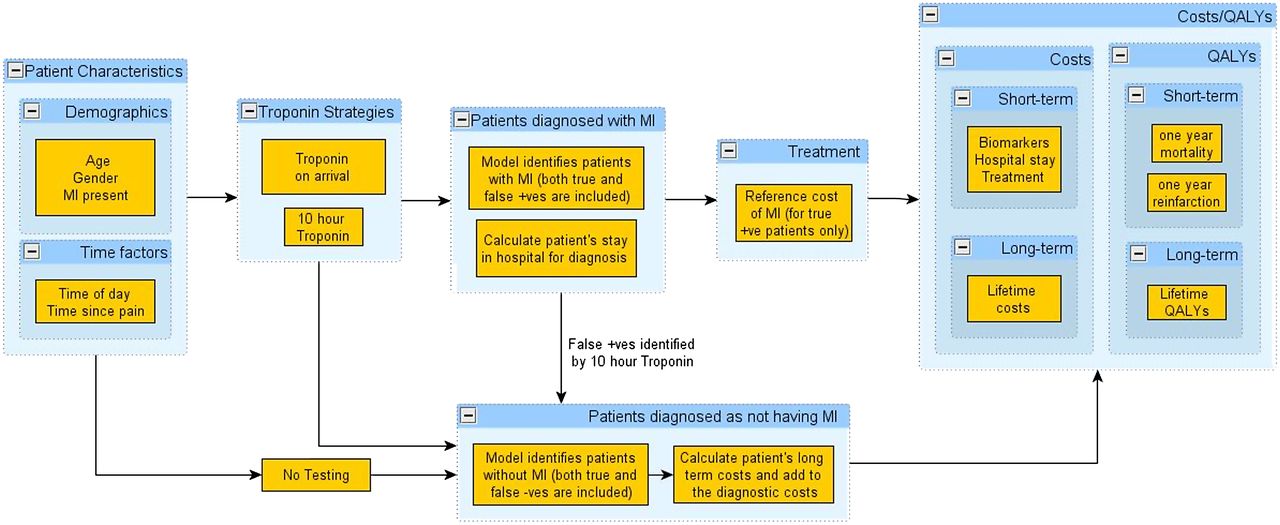
The decision tree model was developed using SIMUL8 software (SIMUL8 Corporation). The model takes a lifetime horizon with mean life expectancy based on UK interim life table9 The economic perspective of the model was the NHS in England and Wales, with the structure of the model shown in figure 1. The model was used to calculate the incremental cost per QALY gained by each strategy compared with the next most effective alternative on the cost-effectiveness frontier. Probabilistic analysis incorporated uncertainty in the parameter estimates to provide more accurate estimates of the mean costs and QALYs. Additionally, the probability that each strategy would be the most cost-effective at different thresholds for willingness to pay for health gain was calculated. Cost-effectiveness acceptability curves were constructed by plotting the probability of each strategy being cost-effective against willingness to pay.

The decision analysis model.
The following diagnostic strategies were tested:
No biochemical testing; discharge all patients without treatment (hypothetical).
Standard troponin assay measured at presentation using the 10% coefficient of variation as the threshold for positivity.
Standard troponin assay measured at presentation using the 99th percentile threshold.
High-sensitivity troponin assay measured at presentation using the 99th percentile threshold.
Standard troponin assay measured at presentation and 10 h after symptom onset using the 99th percentile threshold.
Each diagnostic strategy was applied to successively sampled patients to determine whether they were classified as true positive, false positive, true negative or false negative, depending upon the presence of MI and sensitivity or specificity of the diagnostic strategy. Since 10 h testing was the reference standard for MI it was assumed to only produce true positive or true negative results. We assumed that true positives would receive treatment for MI, false positives on presentation testing would remain in hospital for confirmatory testing at 10 h, and all negatives would be discharged.
In each strategy, we assumed that there was a 2 h delay from the time at which sampling could be performed to the time at which results became available. Presentation testing strategies were assumed to be undertaken in the emergency department and a decision made within 1 h of the results being available. We tested three different scenarios regarding 10 h testing, in relation to the delay between results being available and a decision being made:
The ‘doctor-on-demand’ scenario, in which medical staff were available 24 h a day to make a disposition decision within 1 h of the results being available.
The twice-daily ward-round scenario, in which medical staff were only available at twice-daily ward rounds to make disposition decisions.
The once-daily ward-round scenario, in which medical staff were only available at one daily ward round to make disposition decisions.
We assumed that the diagnostic strategy only influenced outcomes among patients with MI. These patients risked reinfarction or death over the following year dependent upon whether MI was treated or not. The risk of reinfarction and death (with and without treatment) was determined using data from a study by Mills et al.10 This cohort of patients with suspected ACS allows comparison between those with recognised and treated MI, and those with untreated MI, because the threshold for reporting positive results was changed after an initial validation phase when low positive results were recorded but not reported. We selected patients from this study who matched our inclusion criteria of having a non-diagnostic ECG.
We assumed that 10 h troponin testing, being the reference standard, would have perfect sensitivity and specificity and would use a standard troponin assay. We tested standard and high-sensitivity troponin assays at different diagnostic thresholds at presentation to explore the effect of variation in threshold upon decision making. Sensitivity and specificity were estimated by meta-analysis of diagnostic cohort studies of presentation troponin T11 and are summarised in table 1. We selected troponin T analyses because the point estimates for sensitivity and specificity allowed rational examination of the effect of varying the threshold, although results for troponin I in our meta-analysis were similar.
Sensitivity and specificity of diagnostic strategies
We assumed that survivors accrued QALYs according to their age, whether they had MI at initial hospital attendance, and whether they suffered reinfarction. Lifetime QALYs were estimated from life expectancy and corresponding annual utilities. The discounted life expectancy of patients with MI and MI with reinfarction, was estimated from Polanczyk et al,12 while the utility of patients with MI was estimated from Ward et al.13 The utility of patients with reinfarction was estimated by using a multiplicative factor of 0.8 for patients with MI based on expert opinion. Life expectancy of general population (without MI) was estimated from the Office of National Statistics,9 and the general population utilities are estimated from Ward et al.13 Table 2 shows the estimates used for key parameters in the model within the deterministic and probabilistic analyses.
Parameters used in the model
Costs were accrued through measurement of biomarkers, hospital stay, treatment for MI, subsequent cardiac events and lifetime costs of care for patients with CAD. It was assumed that any time spent in hospital during diagnostic testing incurred costs at the rate for admission to a general medical ward, regardless of location in the hospital. The cost of index admission and treatment for MI, and the costs of reinfarction were estimated as a one-off cost of £3587 based on national tariff for non-elective acute MI without complications.14 Lifetime costs of survivors were estimated according to patient age, presence of MI at initial hospital attendance, and whether they suffered reinfarction. The lifetime costs for MI patients are estimated using the annual costs from Ward et al,13 and the discounted life expectancy of patients with MI captured from Polanczyk et al.12 Table 3 shows the estimated lifetime costs and QALYs accrued after MI, stratified according to patient age at presentation to hospital.
Lifetime cost and QALYs estimates after MI
We also undertook two sensitivity analyses:
Replacing presentation high-sensitivity troponin T with high-sensitivity troponin I (ADVIA Centaur Ultra) and re-running the incremental analyses. Our meta-analysis11 suggested that this has lower sensitivity and higher specificity than high-sensitivity troponin T, so this analysis tested whether findings were dependent upon the high estimated sensitivity of troponin T. The estimates for sensitivity and specificity for troponin I were 0.86 (95% predictive interval 0.26–0.99) and 0.89 (0.40–0.99), respectively.
Additional inclusion of a strategy using measurement of high-sensitivity troponin I at presentation and 3 h later, and re-running the incremental analyses. Recent analysis15 has suggested that this provides better sensitivity than presentation testing. We assumed that additional costs were incurred for providing care until the 3 h results were available, but that a doctor would be available on demand to act on the results. The estimates of sensitivity and specificity were 0.982 (95% CI 0.959 to 0.994) and 0.904 (0.884 to 0.922), respectively.15
Results
Table 4 shows the main deterministic results for the three scenarios tested. The total costs for each presentation testing strategy increase as the specificity decreases and results in more patients requiring delayed testing. The total QALYs for each strategy increase as sensitivity increases and results in more cases of MI being detected and treated. In all three scenarios, the presentation high-sensitivity troponin strategy was the optimal strategy using a £20 000/QALY threshold. If a £30 000/QALY threshold is used, then 10 h troponin testing is cost-effective (£27 546/QALY) in the doctor-on-demand scenario (ie, if a decision can be made and the patient discharged as soon as a negative delayed troponin result is available), but not in the other scenarios, where the presentation high-sensitivity troponin strategy remained optimal.
Main deterministic results of the cost-effectiveness analysis
The probabilistic results were similar to those of the deterministic analysis, with the conclusions identical for both methodologies. Figure 2 shows the probability in the probabilistic sensitivity analyses that each strategy is optimal at thresholds of willingness to pay ranging from zero to £50 000/QALY. In the doctor-on-demand scenario the presentation high-sensitivity troponin strategy has the highest probability of being optimal at thresholds between £4000 and £24 000/QALY, while above £24 000/QALY, delayed troponin testing has the highest probability. In the other two scenarios, presentation high-sensitivity troponin has the highest probability of being optimal at all thresholds tested above £10 000/QALY. These data indicate the levels of uncertainty in the decision problem, but do not show the cost per QALY value at which the adoption decision changes between strategies, which are provided in the ICER columns of table 4.

Cost-effectiveness acceptability curves (A) Doctor-on-demand scenario (B) Twice-daily ward-round scenario (C) Once-daily ward-round scenario.
Secondary analysis of patients with known CAD produced similar results, except that the presentation high-sensitivity troponin strategy was optimal in all three scenarios at both the £20 000/QALY or £30 000/QALY threshold.
The results of the sensitivity analyses using high-sensitivity troponin I at presentation alone and at presentation and 3 h, are reported in supplementary tables 1 and 2. The 10 h troponin strategy is more cost-effective when compared with high-sensitivity troponin I at presentation, but it would still only be optimal in one scenario (doctor-on-demand, patients without known CAD) if the £20 000/QALY were used, and would be optimal in three of the six scenarios if the £30 000/QALY threshold were used. Measurement of high-sensitivity troponin I at presentation and 3 h is the most cost-effective strategy at either the £20 000/QALY or £30 000/QALY threshold, while the ICER for the 10 h troponin strategy substantially exceeds both thresholds in all scenarios.
Discussion
This analysis has shown that delayed troponin testing at 10 h after symptom onset is unlikely to be cost-effective compared with presentation high-sensitivity troponin T testing in most scenarios at commonly used thresholds for willingness to pay. Ten hour troponin testing is only likely to be cost-effective if patients with a negative test can be discharged as soon as the result is available, and if a £30 000/QALY for willingness to pay is used. The implication of our analysis is that NICE guidance recommending 10–12 h troponin testing2 does not appear to promote cost-effective use of resources, unless services are in place to allow rapid decision making once delayed test results are available and the £30 000/QALY threshold is used. Sensitivity analyses showed that the findings, to some extent, depend on the estimated sensitivity of presentation troponin and consideration of alternative strategies, such as testing 3 h after initial assessment. If presentation high-sensitivity troponin was estimated to have a lower sensitivity, then 10 h troponin testing was more likely to be cost-effective. If high-sensitivity troponin testing 3 h after initial assessment has the sensitivity estimated by Keller et al,15 then 3 h testing will be most cost-effective. However, this strategy is based upon data from one study and requires confirmation.
There have been few economic analyses of diagnostic testing strategies for MI, and none specifically comparing presentation high-sensitivity troponin testing with delayed troponin testing. The evidence review for NICE chest pain guidance2 identified four economic analyses relating to biomarker testing for MI. Two were prospective studies16 ,17 comparing troponin-based diagnosis of MI with diagnosis based on other markers. Another18 used decision analysis modelling to determine whether using point-of-care troponin testing to identify cases of MI for thrombolysis would be cost-effective. Another modelling study19 compared various diagnostic strategies including presentation, 6-h and 24-h combinations of troponin and creatine kinase MB to conclude that 6-h testing was likely to be cost-effective (ICER £18 500/QALY), while 24-h testing was not (£36 000/QALY). This model used only deterministic analysis with no estimates of uncertainty in model parameters, and evaluated strategies that have been superseded by modern assays.
Our analysis has some limitations that need to be taken into account. Any modelling process involves simplifications and assumptions that may not accurately reflect clinical practice. We assumed that delayed troponin testing is 100% sensitive and specific, reflecting its role as reference standard for MI. However, studies of presentation troponin report specificity below 100%. It is known that not all troponin elevations represent MI, however, modelling the effect of treating false positive cases would be complex and require substantial assumptions with little supporting data. We therefore assumed that sustained false positive troponin elevations would affect presentation and delayed troponin testing equally, and that the only consequence of false positive presentation troponin was the requirement for subsequent delayed testing. We also assumed that a patient with a false negative troponin at presentation would have the same prognosis (and thus, ability to benefit from treatment) as a patient with a true positive at presentation. This assumption may not hold if those with false negative troponin at presentation have a smaller infarct and better prognosis. However, we were unable to find adequate data to test this assumption.
We assumed that the diagnostic strategies would be implemented in a consistent and predictable manner, and in particular, that early diagnostic testing will result in earlier hospital discharge. This assumption is often made but not often tested in practice. Data from a recent randomised trial of rapid point-of-care biomarker testing4 showed that early diagnostic testing increased the rate of early discharge home, but less than might have been expected if the protocol were rigidly applied. We also assumed that the choice of strategy would not influence use of coronary care beds and coronary angiography in patients without a diagnosis of MI.
We only evaluated one strategy using troponin testing after presentation, but before 10 h from symptom onset, and this analysis used data from only one study.15 The estimate of sensitivity for the 3 h strategy requires confirmation in other studies. However, any strategy that delays troponin testing would be expected to increase sensitivity. If this can be done without incurring significant additional costs (ie, without hospital admission or significant staff input), then it is likely to be more cost-effective than either presentation or delayed testing. Finally, we did not test a strategy of delayed high-sensitivity troponin testing because we assumed that delayed testing with a standard assay was the reference standard test for MI. Further research is required to determine whether high sensitivity and standard assays have different prognostic or therapeutic implications and, thus, have different implications for use as reference standard.
Our analysis has important implications for the healthcare systems facing rising emergency admissions. The quarter of a million chest pain admissions in England in 2009–2010 resulted in 331 284 bed days5 at an estimated cost of £175 million. NICE guidance published in 2010 recommended measuring troponin on hospital arrival in all patients, representing a change to prevailing practice.20 At the time the guidance was developed there was insufficient evidence relating to high-sensitivity troponin to make recommendations, but since then the availability of high-sensitivity assays and evidence of diagnostic performance has increased.6 ,7 ,15 Amendment of NICE guidance to recommend presentation, or 3 h troponin testing instead of 10 h testing, could substantially reduce chest pain admissions, with an associated reduction in pressure on acute beds, and consequent cost savings. However, this would be at the expense of an increase in cases of missed MI, and consequent loss of potential benefit from treatment. Further research would be required to try to optimise detection of MI without incurring the additional costs of delayed troponin testing.
Acknowledgments
We thank Christopher Carroll, Joanna Leaviss, Mohamad Al Khalaf, Pippa Evans and Jenny Wang for undertaking the systematic reviews and meta-analyses of presentation troponin testing, and Susan Proctor and Kathryn Paulucy for clerical assistance.
References
Supplementary materials
Supplementary Data
This web only file has been produced by the BMJ Publishing Group from an electronic file supplied by the author(s) and has not been edited for content.
Files in this Data Supplement:
- Data supplement 1 - Online supplement table
Footnotes
All authors, external and internal, had full access to all the data (including statistical reports and tables) in the study and can take responsibility for the integrity of the data and the accuracy of the data analysis.
Funding The project was funded by the National Institute for Health Research (NIHR) Health Technology Assessment (HTA) Programme (number 09/22/21) and sponsored by the University of Sheffield. The study funders had no role in study design; in the collection, analysis, and interpretation of data; in the writing of the report; and in the decision to submit the paper for publication. The researchers were independent of the study funders. The British Heart Foundation support NLM (FS/10/024) and DEN (CH/09/002).
Disclaimer The views and opinions expressed therein are those of the authors and do not necessarily reflect those of the NIHR HTA.
Competing interests None.
Provenance and peer review Not commissioned; externally peer reviewed.