Article Text

Abstract
Background Proximity to walkable destinations or amenities is thought to influence physical activity behaviour. Previous efforts attempting to calculate neighbourhood walkability have relied on self-report or time-intensive and costly measures. Walk Score is a novel and publicly available website that estimates neighbourhood walkability based on proximity to 13 amenity categories (eg, grocery stores, coffee shops, restaurants, bars, movie theatres, schools, parks, libraries, book stores, fitness centres, drug stores, hardware stores, clothing/music stores).
Objective The purpose of this study is to test the validity and reliability of Walk Score for estimating access to objectively measured walkable amenities.
Methods Walk Scores of 379 residential/non-residential addresses in Rhode Island were manually calculated. Geographic information systems (GIS) was used to objectively measure 4194 walkable amenities in the 13 Walk Score categories. GIS data were aggregated from publicly available data sources. Sums of amenities within each category were matched to address data, and Pearson correlations were calculated between the category sums and address Walk Scores.
Results Significant correlations were identified between Walk Score and all categories of aggregated walkable destinations within a 1-mile buffer of the 379 residential and non-residential addresses. Test–retest reliability correlation coefficients for a subsample of 100 addresses were 1.0.
Conclusion These results support Walk Score as a reliable and valid measure of estimating access to walkable amenities. Walk Score may be a convenient and inexpensive option for researchers interested in exploring the relationship between access to walkable amenities and health behaviours such as physical activity.
Statistics from Altmetric.com
Introduction
Physical inactivity has been considered one of the most important public health problems of the 21st century.1 In an effort to reduce levels of inactivity and promote greater levels of physical activity, many researchers have begun exploring environmental influences on physical activity behaviour. The Social Ecological Theory posits that many environmental underpinnings are crucial to understanding and guiding the promotion of physical activity.2 Consistently, research investigating barriers to regular physical activity has unearthed several environmental characteristics including perceived safety,3 4 poor aesthetics,5 accessibility to facilities6 7 and lack of quality structural support such as sidewalks.7 Importantly, lack of accessibility to walkable destinations has been shown to predict physical activity.5 8 When examined collectively, such variables of the built and social environment impact the overall ‘walkability’ of a given area.9 Walkability can be defined as a neighbourhood's capacity to support lifestyle physical activity. In order to address environmental barriers to physical activity including low walkability, it is crucial to first establish acceptable metrics for measuring such environmental barriers.9
To date, public health researchers interested in assessing the impact of neighbourhood walkability on physical activity have relied primarily on self-report assessments or laborious, costly and often inaccessible object measures such as environmental audits and/or geographic information systems (GIS) data analysis. For example, recent efforts have been devoted to developing detailed walkability indices10,–,12 in order to advance the understanding of how neighbourhood walkability impacts physical activity and health outcomes. Recently, Walk Score, a publicly available website originally developed for real estate purposes and used to calculate the number of nearby walkable destinations or amenities, has emerged as a potential tool to be used in public health. Walk Score is maintained by a grant-funded13 civic software company and incubator (Front Seat Management, LLC Seattle, Washington). Walk Score uses data provided by the Google AJAX Search application program interface (API),14 along with a geographically based algorithm to quickly identify amenities in close proximity to an entered address and calculate a score of ‘neighbourhood walkability’ on a continuous scale.15 The Walk Score algorithm awards points based on the distance to the closest amenity in each of 13 different amenity categories (eg, grocery stores, coffee shops, restaurants, bars, movie theatres, schools, parks, libraries, book stores, fitness centres, drug stores, hardware stores, clothing/music stores). Each category is weighted equally, and the points are summed and normalised to yield a score from 0–100.
To date, no research has tested the validity or reliability of Walk Score for measuring access to walkable destinations. Therefore, the purpose of the proposed study is to explore the reliability and validity of Walk Score as a proxy for measuring access to proximal neighbourhood amenities by comparing it with objectively measured (GIS) walkable amenities within the state of Rhode Island. If found reliable and valid, Walk Score could serve as a useful tool to public health researchers for measuring a critical component of overall neighbourhood walkability.
Methods
GIS data were analysed using ESRI's ArcGIS suite version 9.3 (including ArcMap, ArcCatalog, Spatial Analyst, ArcInfo). A convenience sample of residential and non-residential/business addresses within the state of Rhode Island were aggregated for use in the study. Addresses were residential (home) and non-residential (work) addresses provided by participants that had previously participated in a physical activity randomised controlled trial located in Providence, Rhode Island, between the dates of 15 January 2003 and 6 June 2006.16 17 These addresses were chosen for the present study, as this trial recruited a randomised sample of adults from both urban and non-urban areas allowing for a potentially large range of Walk Scores. A total of 429 residential and non-residential/work addresses within the state of Rhode Island were converted to geographic latitude and longitude coordinates (eg, geocoded) for analyses. An address locator was created based on the 2005 Rhode Island Census Tiger dataset available on the Rhode Island Geographic Information System (RIGIS) database. The address locator was then used to create a shapefile (eg, GIS vector file containing points, lines or areas) which could then be used for spatial analyses. The RIGIS dataset is made available to the general public under established RIGIS licensing procedures. Out of the 429 potential addresses, 379 or 88% matched to the RIGIS Tiger Shapefile. The remaining 50 unmatched addresses were dropped from final analyses to ensure geographic accuracy of the addresses. Of the 379 matching addresses, 232 were residential addresses, and 147 were non-residential addresses. Walk Scores were retrieved by manually entering each individual address into the Walk Score website at http://www.walkscore.com.15 Test–retest reliability analyses were run by double entering a subsample of 100 addresses into Walk Score on two separate occasions, sequentially, on the same day and by the same person. Calculated scores were then entered into a master database.
GIS data collection and analysis procedures
GIS data used for analyses was aggregated based on categories of walkable amenities as defined by Walk Score (eg, grocery stores, restaurants, coffee shops, bars, movie theatres, schools, parks, libraries, bookstores, fitness facilities, drug stores, hardware stores and clothing and music).15 Consistent with the methodology used by the website developers to calculate Walk Score,15 a 1-mile buffer zone was created around each point address using ArcGIS tools. This distance was chosen as the algorithm used for calculating Walk Score awards points based on the distance to the closest amenity in each category up to 1 mile. Each category is weighted equally, and the points are summed and normalised to yield a score from 0 to 100. Developers of the scoring algorithm categorised the scores into five indices: (1) 0–24=car-dependent (driving only): virtually no neighbourhood destinations within walking range; (2) 25–49=car-dependent: only a few destinations are within easy walking range and for most errands, driving or public transportation is a must; (3) 50–69 =somewhat walkable: some stores and amenities are within walking distance, but many every day trips still require a bike, public transportation or car; (4) 70–89 =very walkable: it is possible to get by without owning a car; or (5) 90–100 =walkers' paradise: most errands can be accomplished on foot, and many people get by without owning a car.
Aggregated GIS data were used to calculate a total sum of walkable amenities within the 1-mile buffer zone for each address. The Intersect Tool in ArcGIS was used to match the intersected point destination data (walkable destinations) to the point address data (residential addresses) allowing for summation of the walkable destinations within the 1-mile buffer of each address. Finally, correlations were calculated between the sum of GIS-derived walkable destinations within a 1-mile buffer and the manually calculated Walk Score.
GIS walkable amenities
Addresses of all food vendors including grocery stores, coffee shops, restaurants and bars registered with the Rhode Island Department of Health in August 2009 were included for analyses. Addresses were geocoded based on the previously described address locator. Addresses of all retail services including drug stores, movie theatres, fitness facilities, clothing, music, bookstores and hardware stores within the state of Rhode Island were retrieved from a pay for subscription, Internet-based reference service database (Reference USA; referenceGroup). Addresses were then geocoded based on the previously described address locator. Out of 4803 potential amenity addresses, 4194 or 87% matched with a remaining 608 (13%) not matching. All unmatched addresses were dropped from analyses.
A publicly available shapefile of all academic, private and public libraries registered with the Rhode Island Department of Administration in 2007 was downloaded from the RIGIS database. A shapefile of all public and private schools from preschool through the university level (eg, postsecondary education institutions such as colleges, universities, technical schools, satellite campuses) as listed by the Rhode Island Department of Education for the 2008 school year was provided by the Rhode Island Department of Administration and downloaded from the RIGIS database.
Finally, park space, or space designated as recreational space, was calculated from a publicly available (RIGIS) statewide, seamless digital dataset of land use for the State of Rhode Island derived using semiautomated methods and based on imagery captured in 2003–2004. Data were made available by the Rhode Island Department of Administration, Statewide Planning Programme.
Statistical analyses
Descriptive statistics of Walk Scores were calculated in order to make sure enough variation in neighbourhoods was ascertained by this sample. Pearson correlations were calculated between the sum of GIS measured walkable amenities within a 1-mile buffer zone and the manually calculated Walk Scores. Test–retest reliability analyses were run by calculating the correlation coefficient between Walk Scores estimated on the same sample of 100 addresses, on two different occasions. Both r-values and significance values have been reported.
Results
The average Walk Score from this sample was 55.4 (SD=25.8). Scores were widespread, ranging from 0 to 100. Significant Pearson correlations were identified between Walk Score and all categories of aggregated walkable amenities within a 1-mile buffer of the 379 random addresses. Specifically, Walk Score correlated with the total sum of walkable amenities within a 1-mile buffer zone (r=0.74; p<0.001) (see figure 1). When individual categories were regressed against Walk Scores, significant correlations existed for food services such as restaurants, coffee shops and bars (r=0.71; p<0.001), grocery stores (r=0.68; p<0.001), number of parks (r=0.61; p<0.001), movie theatres (r=0.56; p<0.001), schools (r=0.70; p<0.001), libraries (r=0.57; p<0.001), fitness facilities (r=0.66; p<0.001), drug stores (r=0.72; p<0.001) and retail stores such as clothing, music, book stores and hardware stores (r=0.73; p<0.001) (see table 1). The test–retest reliability correlation coefficient for the subsample of 100 addresses was 1.0, suggesting that Walk Score is a reliable tool for measuring access to walkable amenities.
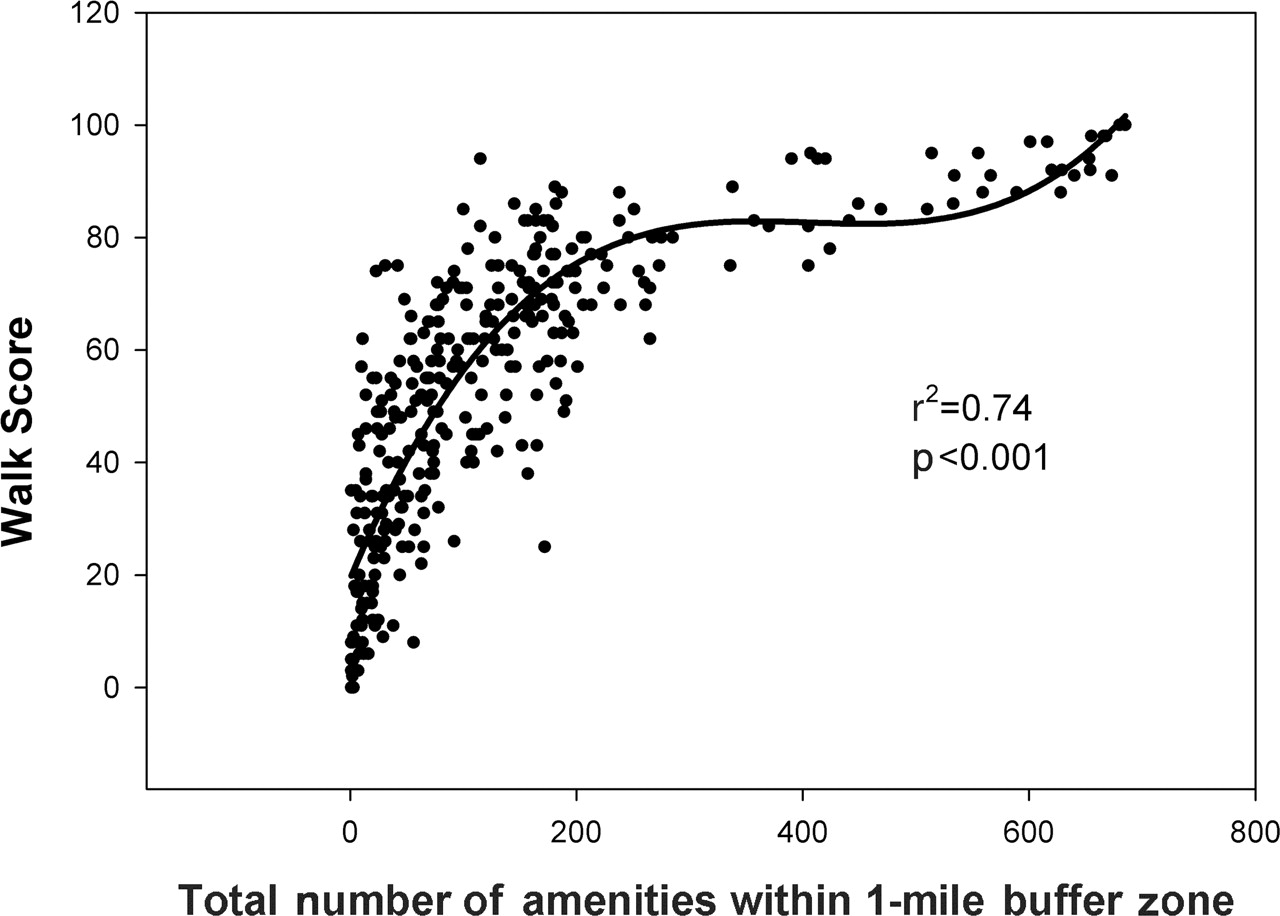
Association between Walk Scores and the total number of walkable amenities within a 1-mile buffer.
Relations between Walk Scores and categories of walkable amenities
Discussion
The primary findings of this study support Walk Score as a reliable and valid tool for estimating areas with a high density of walkable amenities. Correlations between Walk Score and the individual categories of walkable amenities as measured by GIS ranged between 0.56 and 0.74. Figure 2 shows the walkable amenities used in this analysis spread across rural and urban areas of the state with significant clustering occurring in the densely populated, urban areas of greater Providence. Importantly, addresses with higher Walk Scores were also more likely to be found in urban areas with a higher clustering of walkable amenities, while areas with lower Walk Scores were more likely to be found in rural areas with fewer numbers of walkable amenities. Figure 2 also illustrates the range of Walk Scores in this study and provides further justification for using the chosen dataset. In order to test the validity of Walk Score for estimating areas of both low and high density of walkable amenities, a wide range of scores was necessary.

Geographic information systems map of Walk Score categories against walkable amenities within the state of Rhode Island.
While these findings support the use of Walk Score as a proxy measure of walkable amenities, Walk Score might also be used an intervention component for future environmentally focused physical activity intervention studies. There is evidence to suggest a disconnect between perceived access to facilities and objectively measured facilities.18 19 Importantly, these discrepancies have been found to be more likely among overweight, less educated, less active individuals, those who reported using fewer facilities and those with lower self efficacy for physical activity.18 19 Experimental studies focused on positively impacting perceptions of the physical activity environment may be an option for intervening on physical activity behaviours of populations with low perceptions of the physical activity environment.20 For example, due to its unique capability to quickly and accurately provide a visual representation of nearby walkable amenities, Walk Score could be used as an intervention tool to educate participants about their current access to nearby recreational facilities such as parks and fitness facilities. Additionally, if found to be efficacious, targeting perceptions of the environment might serve as a more cost-effective means of increasing physical activity as compared with physically retro-fitting neighbourhoods to support physical activity.
The ability of Walk Score to provide specific distances to local amenities could potentially influence decisions of transport (eg, walk vs drive). Currently, only 31% of all trips of 1 mile or less are made by bicycling or walking, while 90% of all trips between 1 and 3 miles are taken by car.21 Data from the National Longitudinal Study of Adolescent Health indicates only a small proportion of young adults actively transport to work (8.1%) and school (26.7%).22 Thoughtfully designed interventions that attempt to influence decisions of transport could result in positive health (eg, physical activity) and environmental (eg, less pollution) outcomes.23 24
Future studies are encouraged to explore the use of Walk Score as a predictor of physical activity and/or a potential moderator of change in physical activity behaviours in physical activity intervention studies. However, such investigations should consider the total number and distance to walkable amenities as they relate to physical activity and the contextual quality of such amenities. Previous research has found that while areas of high population density and land-use mix are typically correlated with higher physical activity levels than areas of low density,25 residents of certain high-density areas are less physically active, more likely to be overweight and more likely to suffer from chronic disease.26 It has been proposed that this paradox is likely due to physical and social factors such as poor neighbourhood aesthetics and high crime that outweigh pro-walkable characteristics and create a less walkable neighbourhood.26 Knowledge of specific types of amenities necessary to foster increased walking is critical to policies supporting the design of healthier and walker-friendly communities and the reduction in health disparities. Investigations into the utility of Walk Score for predicting other health outcomes such as body mass index and all-cause mortality are also encouraged, as such investigations could provide crucial evidence for environmental policies with a larger goal of creating healthier communities.
It should be noted that Walk Score simply provides an estimate of the number and density of nearby walkable amenities and should not be confused as a measure of total neighbourhood walkability.9 Walk Score is limited in its ability to account for a number of variables known to contribute to total neighbourhood walkability. For example, Walk Score does not account for access to public transit provisions, street width, sidewalk width, block length, street design, safety from crime and traffic, topography, natural walking barriers such as freeways and bodies of water and/or weather. Still, future studies are encouraged to explore associations between Walk Score and such characteristics of the built environment known to be associated with increased physical activity. Additionally, Walk Score utilises the Google AJAX Search API, using ‘as the crow flies’ distances rather than Euclidean distances that take street connectivity into account. Therefore, it is recommended that future studies use Walk Score as an independent component of larger models estimating neighbourhood walkability.
This study is also limited by temporal availability of some GIS datasets used in this analyses. For example, while Walk Scores for this study were calculated in 2009, a few of the GIS datasets used for this validity study were measured and made available in previous years (eg, park data). While this limitation could not be avoided and should be considered for future studies, the bulk of the GIS data used for this study (eg, food vendors, schools, retail) was collected between 2008 and 2009, so it is not anticipated that substantial environmental changes have been made in the order that would skew the presented findings.
In summary, the results of this study suggest Walk Score to be a reliable and valid measure of estimating the density of walkable amenities. Walk Score may be a convenient and inexpensive tool for researchers interested in exploring the relationship between the built environment and health behaviours such as physical activity.
What is already known on this topic
▶ Previous methods for calculating neighbourhood walkability have relied on self-report or time-intensive and costly measures including environmental audits and Geographic Information Systems.
What this study adds
▶ This study supports the use of Walk Score as a reliable and valid measure of estimating access to walkable amenities, an important component of neighbourhood walkability. Futher, Walk Score is a convenient and inexpensive option for researchers interested in exploring the relationship between access to walkable amenities and health behaviours such as physical activity.
Acknowledgments
None.
References
Footnotes
-
Funding This study was funded in part by NIH Grant 1T32HL076134.
-
Competing interests None.
-
Ethics approval Ethics approval was provided by the The Miriam Hospital.
-
Provenance and peer review Not commissioned; not externally peer reviewed.