Article Text

Abstract
Background Information regarding waiting times has been shown to be a key determinant of patient satisfaction. This study aimed to examine the potential accuracy of predicted waiting times determined on the patient's arrival in the Emergency Department (ED).
Methods A retrospective study of 50 000 consecutive patients attending a single ED was undertaken. A linear regression model was developed to predict waiting times, assessing a number of different measures derived from the waiting times of patients seen immediately prior to an individual patient's time of arrival. To assess the fit of the model, the mean absolute difference between the patient's actual and predicted waiting times was determined.
Results 6726 patients had incomplete data and were excluded from the analysis. The mean waiting time across all streams was 64.6 (SD 43.7) min. The best performing linear regression model used two variables to predict a patient's waiting time, calculated across the entire sample of patients. This model predicted 27% of the variability in waiting time. The mean absolute difference between actual and predicted waiting times across all streams was 29.0 (SD 23.5) min. The mean absolute difference in waiting times was similar across the streams.
Conclusions There is a considerable difference between predicted and actual waiting times using this method. Further investigation is required to determine whether such a degree of inaccuracy is acceptable to patients and improves satisfaction more than the provision of no information regarding waiting times.
- Emergency care systems
- emergency departments
- management
- emergency department management
Statistics from Altmetric.com
Introduction
Emergency Department (ED) waiting times in England and Wales vary substantially, as previously shown by the Audit Commission.1 The UK national performance targets are based on a patient's total length of stay in the ED, which has been set at 4 h since 2004.2
A review by Trout et al3 found that perceived waiting time, but not necessarily actual waiting time, was inversely associated with satisfaction. The waiting time was cited as the most important cause of dissatisfaction of patients attending the ED. Delays have also been associated with adverse outcomes4 and increased violence.5
Taylor and Benger6 examined the factors that influence patient satisfaction in the ED, finding that the most frequently assessed factors in the literature were actual and perceived waiting times. Patient satisfaction was influenced by the interpersonal skills and attitude of staff, communication of information to the patient and perceived waiting times. However, the relative importance of these three factors was not determined. Waiting times have been shown to be important to patients, with those who see a doctor more quickly increasingly likely to rate the care they received as excellent or very good.7
Patients with the least-serious illnesses have been shown to wait longest to see a doctor, but once seen spend only a short period of time undergoing assessment and treatment.8 There is also evidence that the time of presentation, rather than individual patient characteristics, seems to be the most powerful predictor of waiting time.9
Perceived waiting time has been consistently associated with overall satisfaction. However, little is known of the relationship between satisfaction and actual waits. There has been one study that suggested that actual wait (as opposed to perceived wait) is not associated with overall satisfaction.10
With the abolition of the 4 hour target by April 2011 and the introduction of quality and outcome indicators, predicted waiting times are particularly relevant to patient satisfaction, which is proposed as one such indicator.11
As the information regarding waiting times has been shown to be a key determinant of patients' satisfaction, this study aimed to examine the potential accuracy of predicted waiting times determined on the patient's arrival in the ED. It was aimed to examine only those factors that could be easily measured on arrival, using existing information systems. Consequently, no clinical variables were assessed.
Methods
This was a retrospective study of 50 000 consecutive patients attending Barnsley Hospital ED between 9 July 2009 and 26 March 2010. Barnsley Hospital is a 570 bed district general hospital situated in South Yorkshire. The ED treats approximately 70 000 patients per annum and has separate majors, minors and paediatric areas.
The primary source of study data was computerised records of ED attendance, triage, clinician assessment and subsequent transfer/discharge times. The time of attendance is recorded automatically by the patient administration system when the patient registers. Other process times are recorded in real time by medical and nursing staff using an electronic patient tracking system (Extramed, Edinburgh, UK). The actual waiting time for each patient was defined as the period from arrival in the department until clinician consultation.
A number of variables were determined from the data. The variable names are given in parentheses. For each patient, the mean waiting time of the last three and last five patients seen immediately prior to the index patient's arrival in the department were determined. This was determined for all patients (L3-all and L5-all) and separately for only those patients in the same stream as the index patient (L3-stream and L5-stream.) The use of the last three and last five cases was based on previous performance monitoring work undertaken in the department.
The mean waiting time for each hour of the day over the entire week was determined from the entire dataset, for all patients (DH-all) and for each stream (DH-stream.) The value of these two variables appropriate to the patient's day and hour of attendance were then determined for each individual episode.
Further binary variables were calculated to categorise whether the patient presented during a weekend, in the evening (18:00 to 21:59) or at night (22:00 to 07:59).
Using actual waiting time as the dependent variable, a linear regression analysis was undertaken to develop a predictive model of waiting times. Initially, each variable was regressed separately on the dependent variable and those found to be potentially predictive (p<0.1) were entered into a multivariate linear regression model using a stepwise elimination algorithm.
To assess the fit of the model, the absolute difference between actual and predicted waiting times was determined and the mean absolute difference calculated.
This study only used routinely collected ED computerised records data with no extraction of identifiable patient demographic data and so the study fell within the service review remit, thus not requiring ethical committee approval.
Results
The study cohort comprised 50 000 individuals. Six-thousand, seven-hundred and twenty-six patients had incomplete data and were therefore excluded from the study analysis. The final cohort of 43 274 patients comprised 18 172 majors, 16 543 minors and 8559 paediatric patients.
The mean actual waiting time was 65.9 min for majors, 64.3 min for minors and 62.5 min for paediatrics, with an overall mean waiting time of 64.6 min for all patients.
The results of univariate linear regression are shown in table 1.
Results of univariate linear regression
Notably the patient's age and the patient entering the minors stream were not predictive of actual waiting time. The remaining variables were all potentially predictive and entered into the multivariate analysis. The results of this analysis are shown in table 2. This model explained 27.4% of the variability in actual waiting times. More complex models were generated using additional variables, but these resulted in a trivial increase in the R2 value and were thus rejected.
Final multivariate linear regression model
There was little evidence of collinearity between the variables in the model outlined above.
The overall mean absolute difference between actual and predicted waiting time was 29.0 (SD 23.5) min. Analysing each individual stream, the mean absolute difference between the actual and predicted waiting times was: majors 30.9 (SD 24.8) min, minors 27.1 (SD 22.2) and paediatrics 28.4 (SD 22.6) min.
The mean absolute difference is shown across the range of actual waiting times in figure 1.
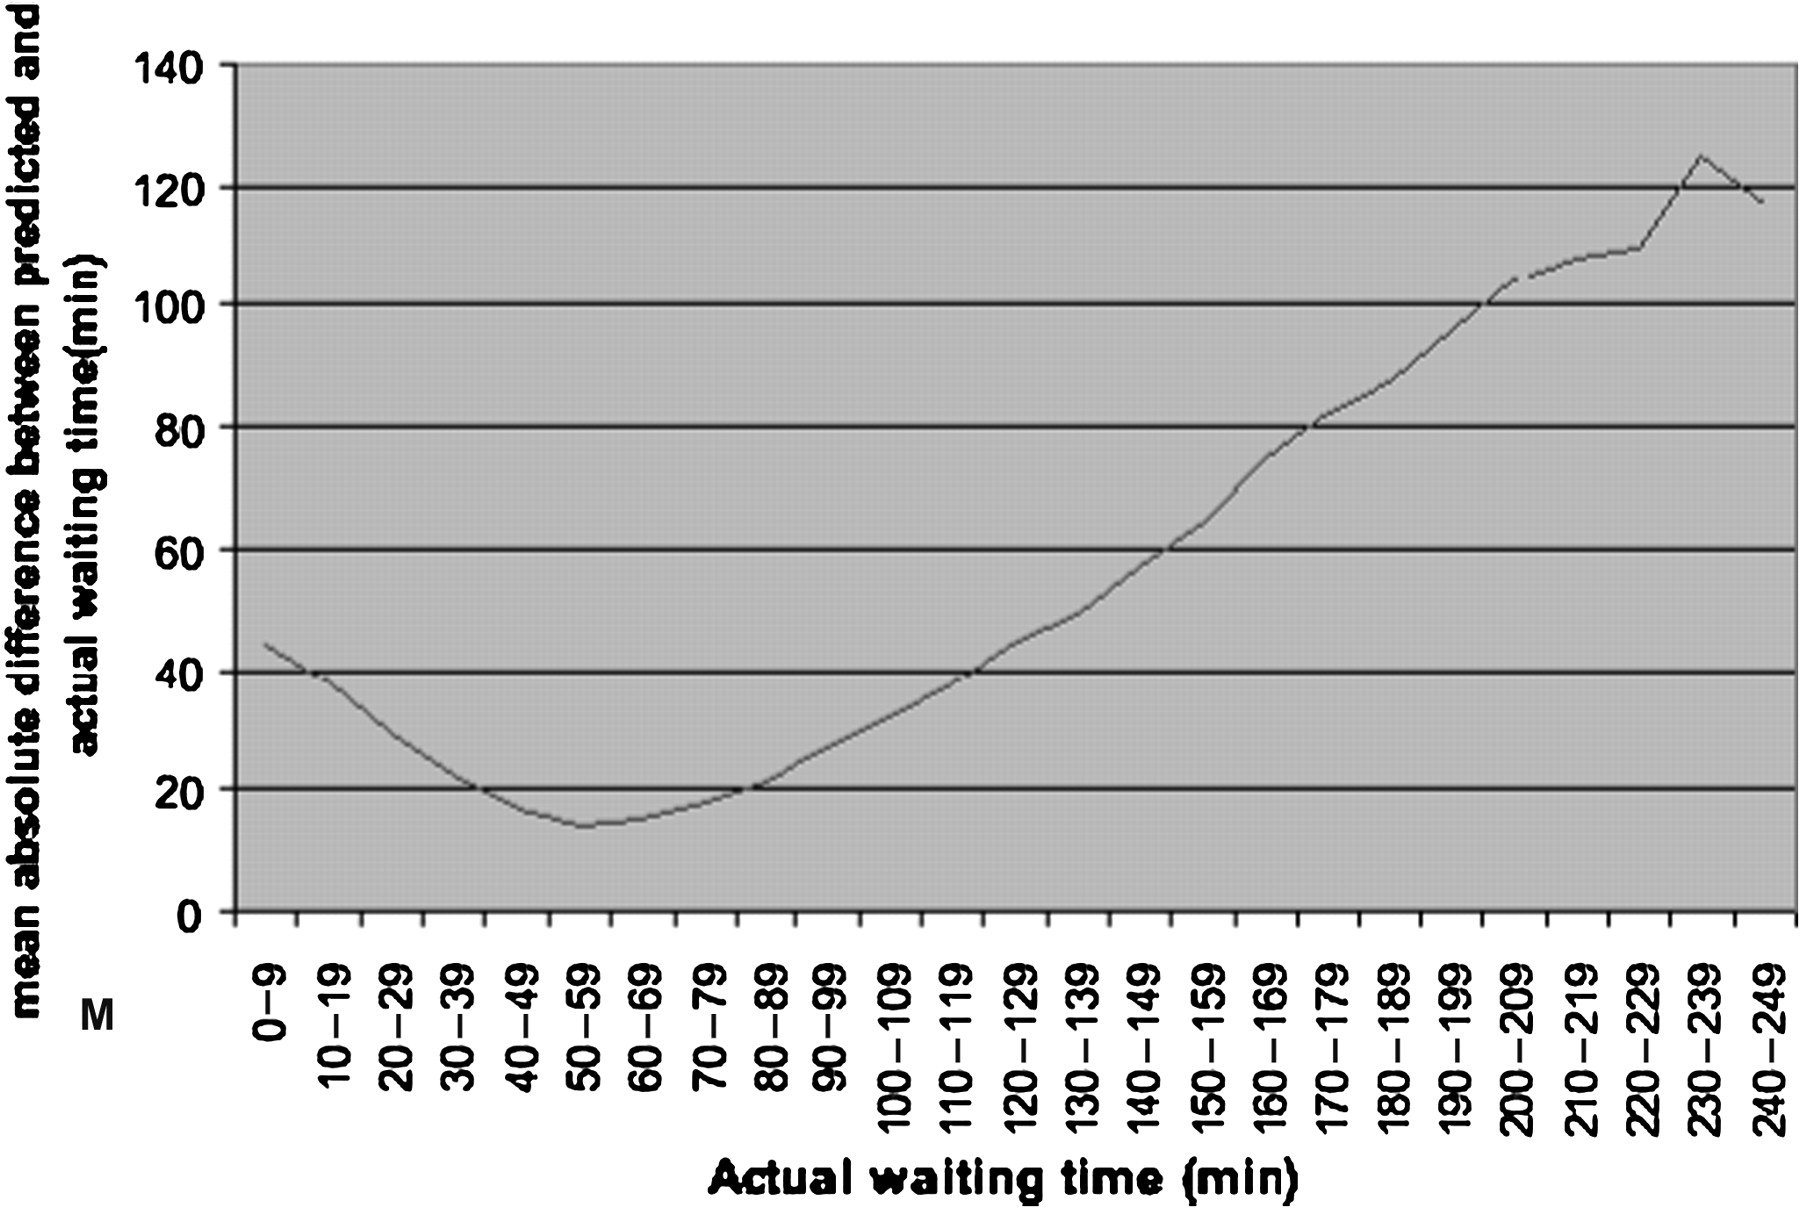
Variation in mean absolute difference between predicted and actual waiting times.
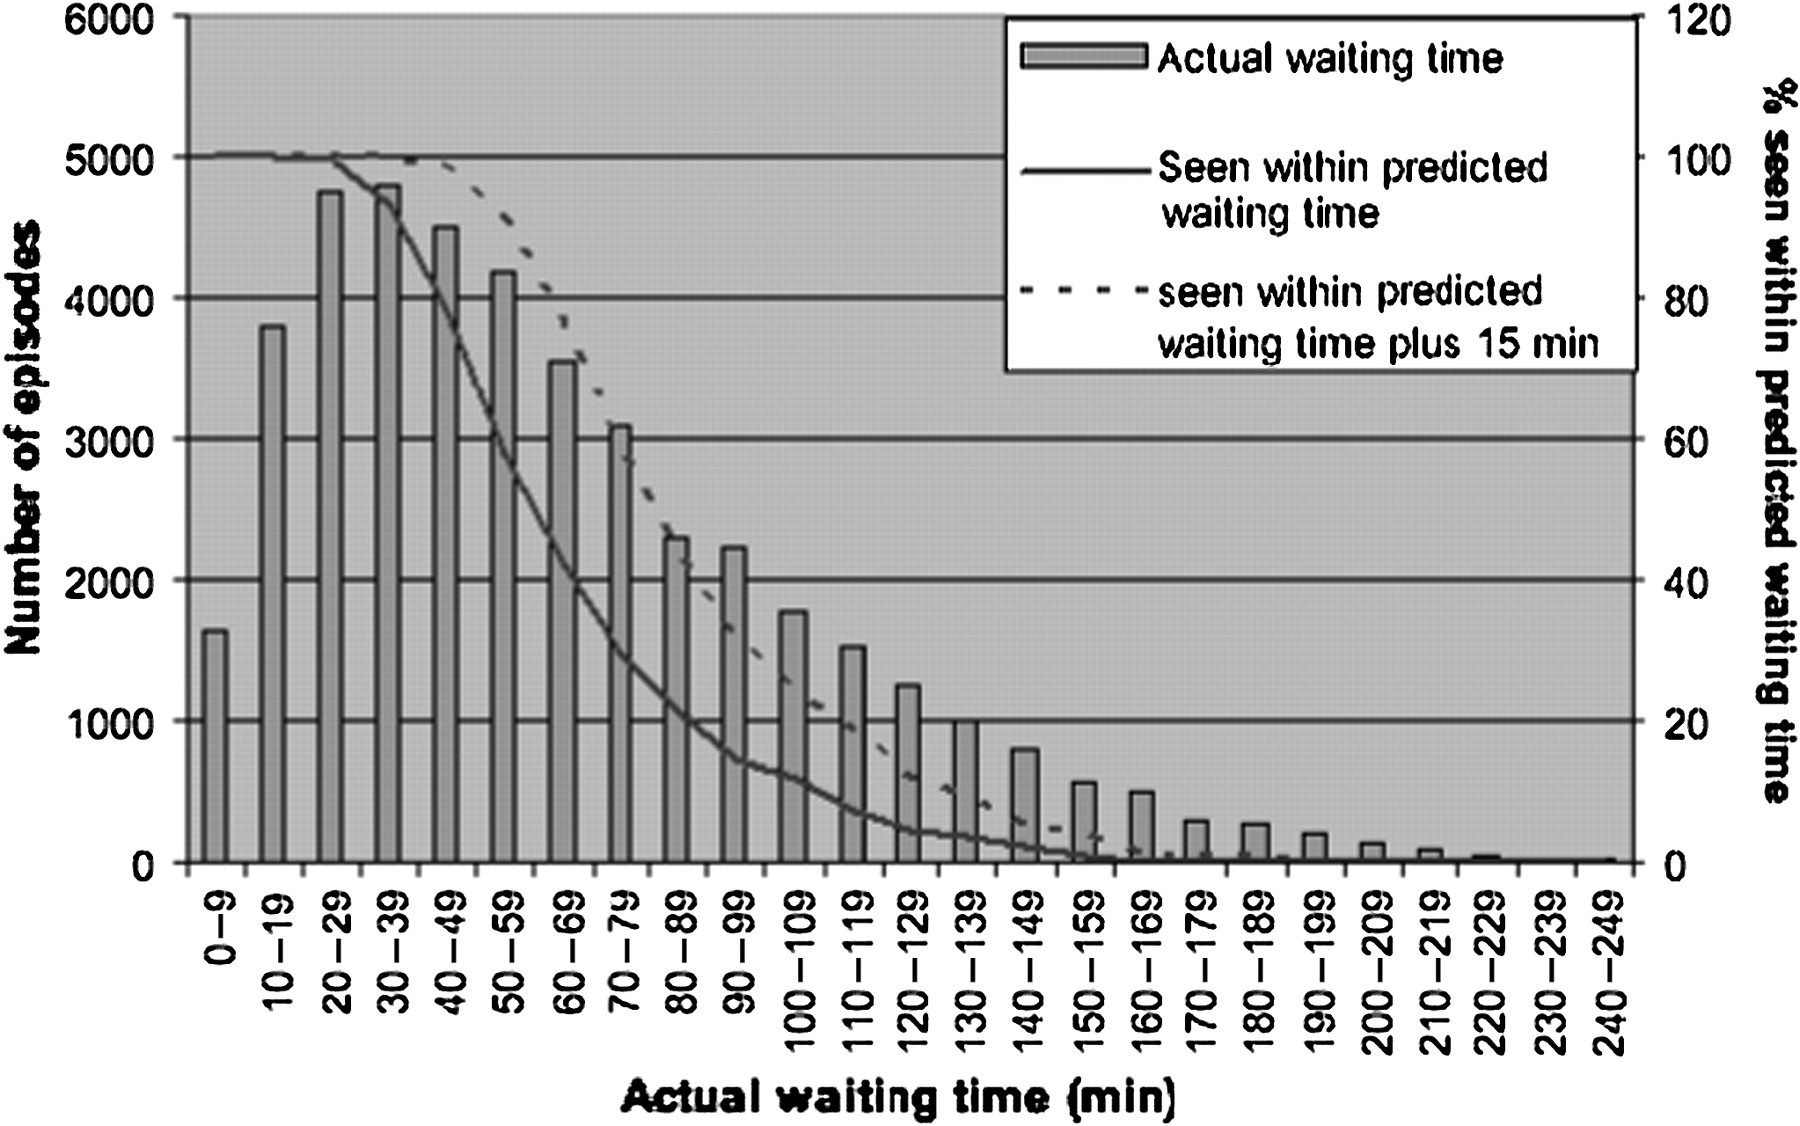
Across the range of actual waiting times, 55.8% of patients' actual waiting times were less than predicted. The proportion having a waiting time less than predicted or within 15 min greater than predicted was 70.4%, with 95% waiting either less than predicted or within 30 min over the predicted waiting time.
The variation in the proportion of patients seen either within their predicted waiting time or within the predicted waiting time plus 15 min is shown in figure 2.
Comparison of actual waiting time distribution (bars) and the proportion in each waiting time category seen within the predicted waiting time (solid line) or within predicted waiting time plus 15 min (dashed line).
Conclusions
With the introduction of the Department of Health's proposed quality and outcomes indicators to replace the 4 hour target by April 2011, the ability to predict an accurate waiting time may help increase patient satisfaction and reduce ‘did not wait’ numbers, which have been proposed as such indicators. This will ultimately reflect in patient care statistics and have a direct financial implication, with the Department of Health planning to provide such patient care data openly in the public arena as a ‘dashboard’ view.
The linear regression model demonstrates that it is possible to predict waiting times to some extent. However, overall the mean absolute difference between predicted and actual waiting times is 29 min.
It may be possible to develop more accurate predictive models with the inclusion of further variables examining the clinical characteristics of the patients waiting to be seen. Recording such data would, however, considerably increase the complexity of data collection in real time.
The present study has demonstrated that using this model 95% of patients would be seen either sooner than predicted or within 30 min of their predicted waiting time. It is not known whether this degree of accuracy would have a positive or negative impact on patient satisfaction.
Display of a dynamic calculated predicted waiting time to patients attending the ED needs to be further assessed by research into patient satisfaction comparing such provision of information against a lack of this. It may be that other measures, such as the number of patients ahead of the index patient in the queue to be seen, have a greater impact on satisfaction.
This study has a number of limitations that should be considered in interpreting the results. Most importantly, the study has examined only one ED. The predictive model would, therefore, only be applicable in that department. The principle could be applied in other EDs, but it is likely that there would be considerable differences in the predictor variables between departments.
The data used were routinely collected performance data and there may be discrepancies between a patient's recorded waiting time and the time they actually waited. However, were a predictive system to be implemented it would rely on routinely collected data and any such discrepancy would remain and may impact on patient satisfaction.
The distribution of waiting times is truncated at zero and positively skewed, but the waiting times of the majority of episodes are approximately normally distributed around the mode. Although this will have some impact on the accuracy of a predictive linear regression model, it is believed that it was appropriate to take this approach, particularly given the large sample size.
In conclusion, although it has been demonstrated that waiting times are to some extent predictable, it remains to be tested whether such a prediction has any impact on patient satisfaction.
Footnotes
Competing interests Barnsley Hospital NHS Foundation Trusts is currently in negotiations with Extramed to license to them a piece of software developed in the Trust. Thomas Locker was involved in the development of this software. Extramed had no part in the decision to undertake the study, the analysis or the decision to publish the results.
Provenance and peer review Not commissioned; externally peer reviewed.