Article Text

Abstract
Background The amount of scientific literature available is often overwhelming, making it difficult for researchers to have a good overview of the literature and to see relations between different developments. Visualisation techniques based on bibliometric data are helpful in obtaining an overview of the literature on complex research topics, and have been applied here to the topic of patient safety (PS).
Methods On the basis of title words and citation relations, publications in the period 2000–2010 related to PS were identified in the Scopus bibliographic database. A visualisation of the most frequently cited PS publications was produced based on direct and indirect citation relations between publications. Terms were extracted from titles and abstracts of the publications, and a visualisation of the most important terms was created. The main PS-related topics studied in the literature were identified using a technique for clustering publications and terms.
Results A total of 8480 publications were identified, of which the 1462 most frequently cited ones were included in the visualisation. The publications were clustered into 19 clusters, which were grouped into three categories: (1) magnitude of PS problems (42% of all included publications); (2) PS risk factors (31%) and (3) implementation of solutions (19%). In the visualisation of PS-related terms, five clusters were identified: (1) medication; (2) measuring harm; (3) PS culture; (4) physician; (5) training, education and communication. Both analysis at publication and term level indicate an increasing focus on risk factors.
Conclusions A bibliometric visualisation approach makes it possible to analyse large amounts of literature. This approach is very useful for improving one's understanding of a complex research topic such as PS and for suggesting new research directions or alternative research priorities. For PS research, the approach suggests that more research on implementing PS improvement initiatives might be needed.
This is an Open Access article distributed in accordance with the Creative Commons Attribution Non Commercial (CC BY-NC 3.0) license, which permits others to distribute, remix, adapt, build upon this work non-commercially, and license their derivative works on different terms, provided the original work is properly cited and the use is non-commercial. See: http://creativecommons.org/licenses/by-nc/3.0/
Statistics from Altmetric.com
Strengths and limitations of this study
-
This study gives insight into the structure of patient safety literature by analysing a large amount of literature using bibliometric data.
-
This approach can be very useful for improving one's understanding of a complex research topic such as patient safety.
-
This method of analysing literature may help to suggest new research directions or alternative research priorities. For patient safety research in particular, this method suggests that research on implementing patient safety improvement initiatives receives relatively limited attention.
-
However, this method does not give detailed insight into the content of specific publications.
Introduction
The use of internet has made large amounts of information easily available to researchers worldwide, while at the same time maintaining a structured overview of relevant information has become more and more challenging and time consuming. For many researchers in the biomedical field, PubMed is the search engine of preference. Although very useful for identifying individual publications relevant to one's information needs, search engines such as PubMed offer limited support in obtaining an overview of the structure of the literature on a particular research topic. Researchers need to go through large numbers of publications to find out which streams of literature can be distinguished, how different streams of literature relate to each other, and how literature has developed over time. Obtaining such an overview of the structure of the literature can be an extremely time-consuming process, especially in the case of complex research topics with publications appearing in multiple scientific fields.
An example of such a complex research topic is patient safety. Patient safety is a multifactorial, multidimensional and cross disciplinary research topic which gained a lot of attention since the publication of the Institute of Medicine (IOM) report “To Err Is Human: Building a Safer Health System” in 1999. To describe patient safety in a framework, the WHO needed approximately 600 concepts (International Classification for Patient Safety).1 The continuously growing publication rate concerning patient safety and its complex character make it difficult to obtain a comprehensive overview of the patient safety literature. Conventional literature search methods result in an overwhelming amount of patient safety literature, which cannot possibly be assessed manually. For example, an attempt to define ‘patient safety’ with a string of MeSH terms (safety OR ‘patient safety’ OR ‘Equipment Safety’ OR ‘equipment safety’[mesh] OR ‘incident prevention’ OR ‘adverse event’ OR ‘adverse events’ OR ‘Accident Prevention’ OR ‘accident prevention’[mesh] OR ‘safety culture’ OR ‘Medical Errors’ OR ‘medical errors’[mesh] OR ‘medical error’ OR near misses) results in 460 533 publications. Entering ‘patient safety’ alone in PubMed gives 17 556 hits ranging from adverse drug reactions to infection prevention through hand hygiene to safety management systems.
Review articles are available on specific patient safety topics, for example, reviews on patient safety in specific specialisms (eg, anaesthesia, paediatrics, etc) and reviews on surgical safety (eg, checklists, communication and teamwork in the operating theatre, etc). However, to the best of our knowledge, there are no review articles that give a high-level view of patient safety. This is due to the multifactorial, multidimensional and cross disciplinary character of the topic. Therefore, insight into the arrangement of patient safety literature is needed to give structure for future (literature) research in this field. Because the conventional approach does not give sufficient insight, an alternative approach is needed. The current study describes an alternative approach of searching, structuring and visualising large amounts of literature based on bibliographic data and uses this approach to analyse the literature on patient safety.
Methods
The methods employed in this study originate from the fields of bibliometrics, text mining and information visualisation. From the bibliometrics literature the idea of using citation relations to establish links between publications is borrowed. Text mining literature discusses natural language processing techniques that are used to extract terms from publications. The mapping and visualisation techniques used in this study build on extensive literature in the fields of bibliometrics and information visualisation.2
First, the data used in this study is discussed. Then the method for delineating patient safety literature as well as the methods for analysing this literature at the level of both publications and terms are discussed.
Data
The current study uses data from the Scopus database. Scopus is a bibliographic database produced by Elsevier that indexes almost 20 000 journals in all scientific disciplines. All journals indexed by PubMed are also covered by Scopus. Scopus is used instead of PubMed because Scopus provides data on the references publications give to other publications. Reference data, which is not available in PubMed, is a crucial element in our approach. Direct access to the raw Scopus data is used (without the need to use the Scopus web interface at http://www.scopus.com); therefore large quantities of reference data are easily processed.
Delineation of the patient safety literature
Owing to the complex nature of the topic ‘patient safety’, delineating the literature on this topic is far from straightforward. The WHO defines patient safety as “the reduction of risk of unnecessary harm associated with healthcare to an acceptable minimum,” and has used around 600 concepts to describe this wide-ranging definition in more detail.1 Delineating patient safety literature using criteria based on keywords or MeSH terms did not yield satisfactory results, therefore a more refined two-step approach is taken.3 ,4 First, all publications with ‘patient safety’ in their title are selected, as well as all publications from the following journals with patient safety as their main topic: Joint Commission Journal on Quality and Patient Safety, Joint Commission Perspectives on Patient Safety, Journal of Patient Safety and Quality and Safety in Health Care. Many relevant publications are still missing after this step, for instance because they were published in general medical journals and do not have ‘patient safety’ in their title. Therefore, a second step is needed, in which all publications with at least four citations from or references to publications selected in the first step are identified. Together these two steps yield 8480 publications in the period 2000–2010, which is the period of analysis. In a random sample of 100 of the 8480 publications, four publications were not related to patient safety and eight publications were only weakly related.
Analysis at the publication level
To obtain an overview of patient safety literature at publication level, we first assess the relatedness of publications. This is performed based on direct and indirect citation relations between publications. Two publications have a direct citation relation if one publication cites the other, and they have an indirect citation relation if they both cite the same publication (bibliographic coupling5) or are both cited by the same publication (co-citation6). Bibliographic coupling relations and co-citation relations have equal weight. For each publication, an artificial citation from the publication to itself is created. In this way, a direct citation relation between two publications counts as both a bibliographic coupling relation and a co-citation relation. After assessing the relatedness of publications, a clustering technique is used to identify clusters of closely related publications, following the methodology documented in an earlier paper.4 This provides a breakdown of the literature into a number of research areas or topics. It is noted that 693 publications cannot be assigned to a cluster. These are publications that have no or almost no citation relations with other publications.
A more fine-grained overview of the literature can be obtained using a publication map. A publication map provides a representation of the literature in a two-dimensional (2D) space. Publications are located in the map in such a way that the distance between publications gives an indication of their relatedness. The shorter the distance between publications, the stronger is their relation. A publication map is constructed of the 1462 most frequently cited publications within the delineation of the patient safety literature. Each of these publications has been cited at least 20 times. The locations of the publications in the map are determined using the VOS (‘visualisation of similarities’) mapping technique,7 and a computer program called VOSviewer (http://www.vosviewer.com)8 is used to visualise the map. This program also offers extensive support for exploring the map in an interactive fashion.
In addition to a publication map, a publication cluster map is constructed. Instead of individual publications, this map shows the aforementioned clusters of publications, thereby providing a more high-level overview of the patient safety literature.
Analysis at the term level
To analyse patient safety literature at term level, we begin by extracting terms from titles and abstracts of publications. This involves three steps. First, a part-of-speech tagger9 is used to identify nouns and adjectives in the titles and abstracts of publications. Second, nouns and adjectives that belong together are combined into noun phrases. Plural noun phrases are converted into singular ones. In the third step, the 1000 most relevant noun phrases are selected as terms. The relevance of a noun phrase is assessed based on the degree to which the noun phrase clusters together with other noun phrases.10 Only noun phrases that occur in at least 15 publications are considered.
The relatedness of terms is determined by counting the number of times terms occur together in the titles and abstracts of publications. The larger the number of cooccurrences of two terms, the stronger their relation. Based on the relatedness of terms, terms are grouped together into clusters and a term map is constructed. A term map works in a similar way as a publication map. Terms are located in a 2D space, and the distance between terms serves as an indication of their relatedness.
Analysis of developments over time
To identify changes in the interest in research topics over time, publication rates are calculated for two time periods, 2000–2005 and 2006–2010. For each cluster of publications and each time period, the number of publications as a percentage of the total number of publications in the time period is determined. Next, for each cluster, a ratio is calculated by dividing the percentage of publications in the period 2006–2010 by the percentage of publications in the period 2000–2005. A ratio above one indicates a relative increase in publications over time, while a ratio below one indicates a relative decrease in publications. To identify changes over time in the terms that are used in the patient safety literature, the mean publication year is calculated for each term. A term's mean publication year indicates whether a term is used more in earlier years or more in later years within the period of analysis.
Results
Publication map
In recapitulation, a total of 8480 publications were identified of which the 1462 most frequently cited publications were used to create a publication map (figure 1A). Interactive versions of all produced maps are available online. The URLs of the interactive maps are provided in the figure captions. Please note that to access the online maps Java needs to be installed on your computer. The publication map illustrates the citation relations between highly cited publications and shows how publications cluster together. The clustering is illustrated in figure 1 by the use of different colours. The figure generally shows a clear separation of the different colours. The 19 clusters identified by our clustering technique were examined manually to assign an appropriate label to each of them. The labels and descriptions of the content of the clusters are given in table 1. Clusters 1 and 2 were given the same label because they seem to represent similar types of publications. In the publication map, these two clusters are more intermingled than the others, which is especially well visible when zooming in on the area of the two clusters (figure 1B).
Clusters of publications
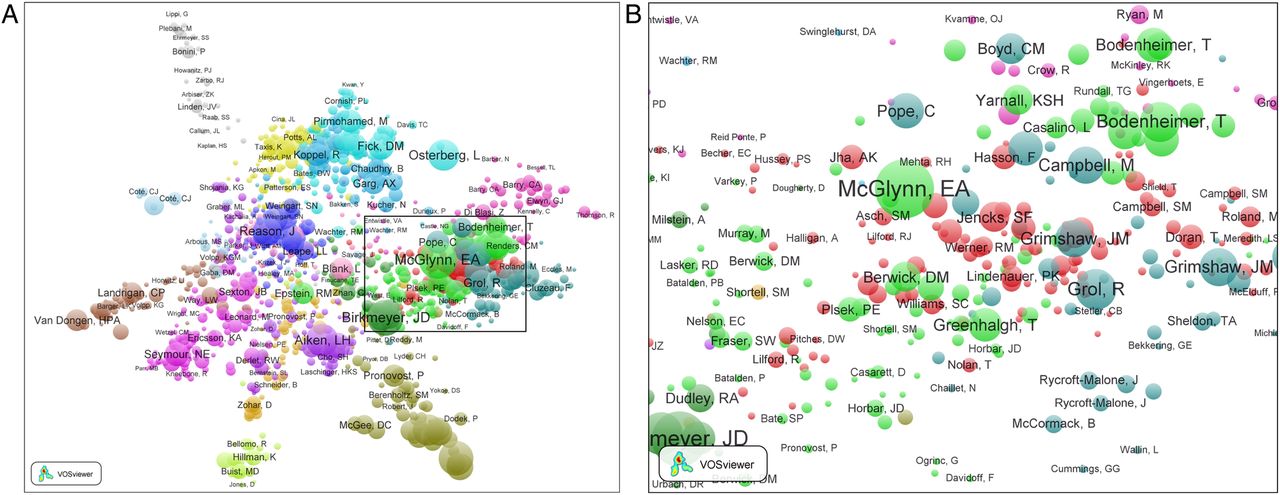
(A) Publication map based on citation relations between frequently cited publications (N=1462). The map shows groups of publications that have been clustered together. Every cluster is shown in a different colour. An interactive version of the map is available online at http://www.vosviewer.com/maps/patient_safety/publications/. (B) Zooming in on clusters 1 (green) and 2 (red), the two clusters that are more intermingled than the other clusters.
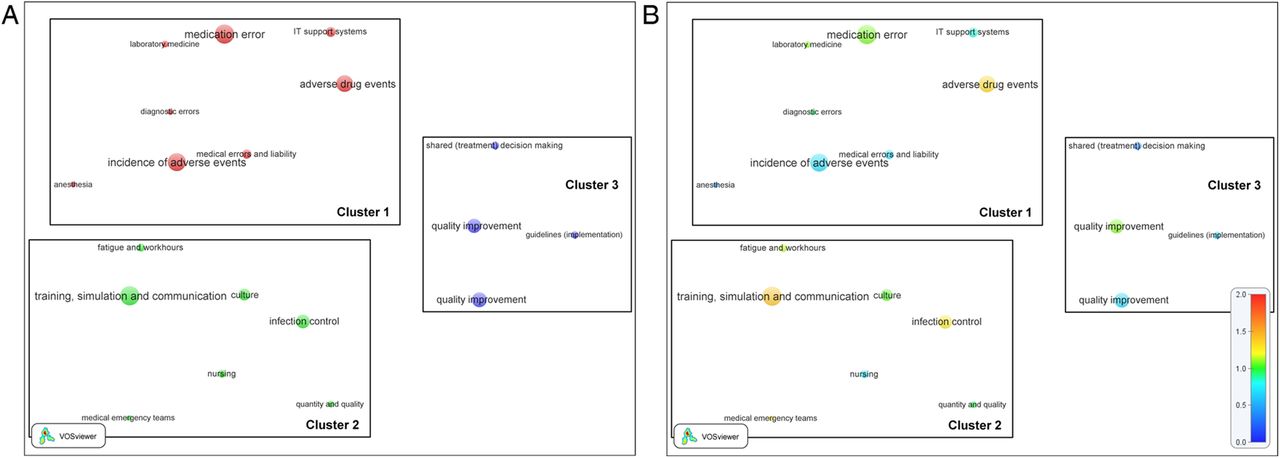
Publication cluster map: the publication cluster map extracted from the publication map gives a more schematic overview of the 19 clusters of publications (figure 2A). Using our clustering technique, the 19 clusters can be grouped into three main categories, each of which is indicated by a different colour. Each category represents a field of patient safety research: category 1 represents research that identifies the magnitude of patient safety problems by measuring and reporting the amount of problems, category 2 represents research that focuses on identifying and understanding patient safety risk factors, and category 3 represents research that focuses on the implementation of solutions mostly on an organisational or national level. Category 1 contains the largest number of publications (N=3569), representing 42% of all publications included in the analysis, followed by category 2 (N=2616), which represents 31% of all publications. Category 3 contains the smallest number of publications (N=1602), representing a mere 19% of the total number of publications.

(A) Publication cluster map with colours indicating three main categories of patient safety research. Category 1: research that identifies the magnitude of patient safety problems by measuring and reporting the amount of problems. Category 2: research that focuses on identifying and understanding patient safety risk factors. Category 3: research that focuses on the implementation of solutions. http://www.vosviewer.com/maps/patient_safety/clusters1/. (B) Publication cluster map with colours indicating the trend in a cluster's publication rate. For each cluster, a ratio was calculated by dividing the percentage of publications in the period 2006–2010 by the percentage of publications in the period 2000–2005. A ratio above one indicates a relative increase in publications over time, while a ratio below one indicates a relative decrease in publications. Increases in publication rates can be seen mostly in category 2 (patient safety risk factors). In categories 1 and 3, publication rates tend to decline or are stable. http://www.vosviewer.com/maps/patient_safety/clusters2/.
Figure 2B shows an increase in publication rates mostly in category 2, the category dealing with research on patient safety risk factors. In categories 1 and 3, publication rates tend to decline or are stable, with the exception of the cluster on adverse drug events in category 1. The publication rate of this cluster has increased considerably over time (ratio of 1.5). Publication rates and ratios per cluster are displayed in table 1. Notice in table 1 that the number of publications in the second time period, 2006–2010, is about 55% larger than the number of publications in the first time period, 2000–2005, despite the fact that the first time period covers 6 years while the second time period covers only 5 years. Looking at the Scopus database as a whole, the increase in the number of publications between the periods 2000–2005 and 2006–2010 is less than 20%, so considerably lower than the 55% increase that we find for the patient safety literature.
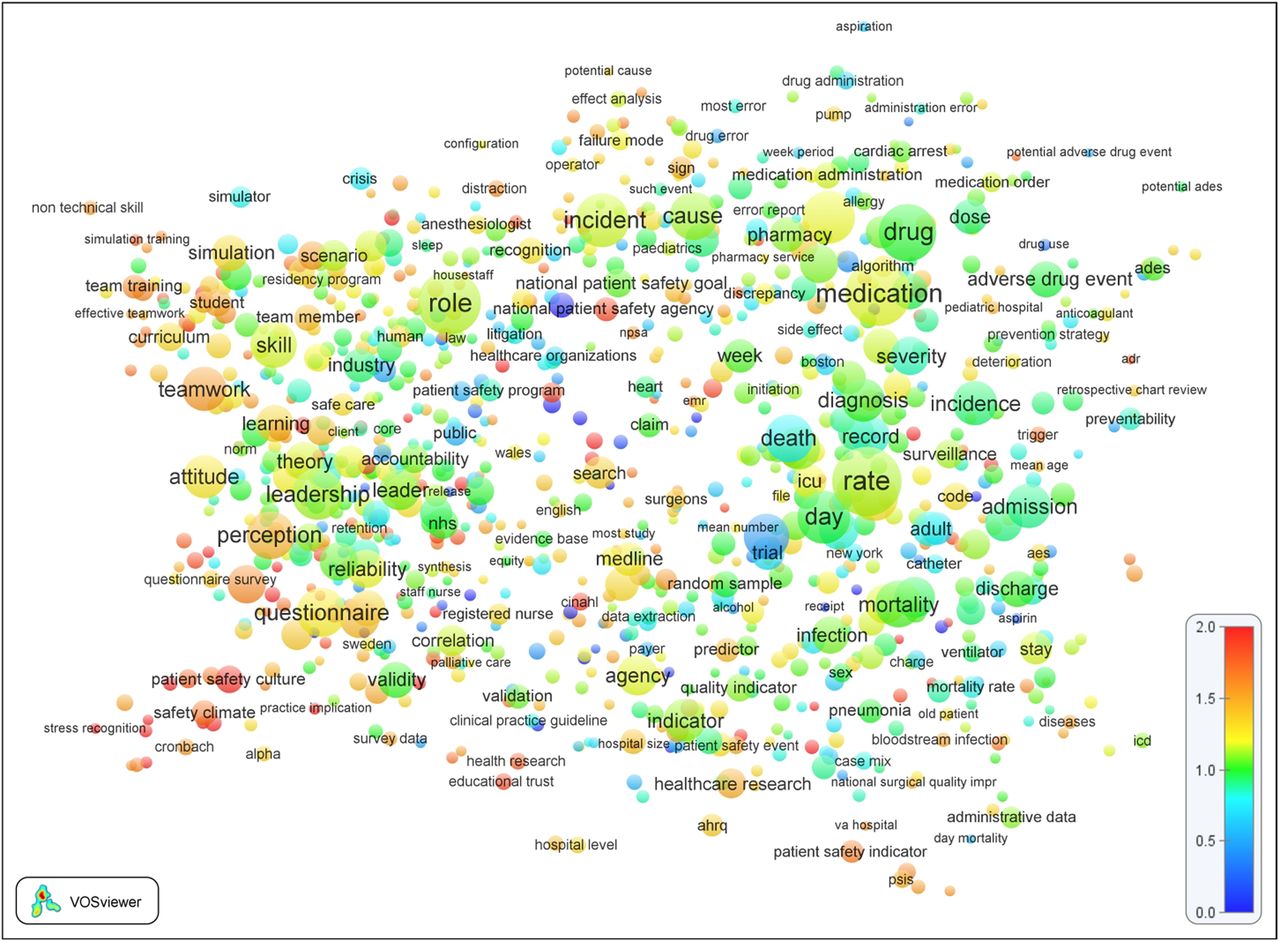
Term map: The term map (figure 3A) shows five clusters of terms that are used in patient safety literature. These clusters contain terms concerning: (1) medication; (2) measuring harm; (3) patient safety culture; (4) the physician and (5) training, education and communication. Figure 3B provides a so-called density visualisation (produced by the VOSviewer software) of the term map. The density visualisation indicates that terms grossly cluster together in two groups, dividing the map in a left and a right side. Terms on the left side of the map tend to be related to patient safety risk factors. In the publication cluster map, these terms are mostly used in category 2. Terms on the right side of the map mostly relate to measurable patient safety outcome parameters. In the publication cluster map, these terms can be found mainly in category 1, the category concerned with studying the magnitude of patient safety problems. Category 3 in the publication cluster map, which is the category that deals with the implementation of solutions, cannot be identified as a separate group of terms in the term map. When the term map is searched for terms relating to category 3, these terms are found mostly in the middle bottom part of the map. In the density visualisation (figure 3B), this area slightly lights up. Nevertheless, comparing the publication cluster map and the term map, it seems that research on the implementation of solutions does not have a unique vocabulary of terms that allows it to be distinguished from other types of patient safety research.

(A) Term map with colours indicating five clusters of terms: (1) medication (purple); (2) measuring harm (green); (3) patient safety culture (pink); (4) the physician (red) and (5) training, education and communication (yellow). An interactive version of the map is available at http://www.vosviewer.com/maps/patient_safety/terms1/. (B) Density visualisation of the term map. Terms cluster together in two groups, dividing the map in a left and a right side. Terms on the left side tend to be related to patient safety risk factors, while terms on the right side mostly relate to measurable patient safety outcome parameters. An interactive version of the map is available at http://www.vosviewer.com/maps/patient_safety/terms1/.
Figure 4 shows the same term map as figure 3, but this time the colour of a term indicates the term's average publication year. Although more scattered than in the publication cluster map (figure 2B), figure 4 shows a similar increasing trend in publications related to patient safety risk factors, as the corresponding terms are mostly used in recent years.
Term map with colours indicating the mean publication year in which a term was used. Terms that are used more towards 2010 are shown in red, while terms that are used more towards 2000 are shown in blue. An increasing trend in publications related to patient safety risk factors can be observed, as the corresponding terms are mostly used in recent years. An interactive version of the map is available at http://www.vosviewer.com/maps/patient_safety/terms2/.
Discussion
When conventional literature research using criteria based on keywords or MeSH terms is unsuccessful due to the complexity and massiveness of the researched topic, analysis based on bibliometric data can give insight into the structure of a research field. There is an extensive body of research on information retrieval techniques that aim to simplify literature search in the biomedical sciences.11 ,12 Although our work can be considered related to this line of research, our focus is not so much on retrieving individual scientific publications but more on obtaining a broad overview of the structure of the literature on a particular research topic.13–16 Our approach seems especially useful when dealing with complex topics that cannot easily be represented by one or a few keywords or MeSH terms.
The present dataset was validated with a random sample of 100 of the 8480 publications, of which only 4% was not related to patient safety, indicating a good representation of the field. With the clustering process 693 publications could not be assigned to a cluster because they have no or almost no citation relations with other publications. For this reason these publications are presumed to be of less importance to the field of patient safety. Excluding these publications from the rest of the analysis does not influence the results because only the most highly cited publications are used to create the publication map. It should be noted, however, that for some publications in the Scopus database no data on the references given to other publications is available. Publications for which this is the case are also more likely to be among the 693 publications excluded from the analysis.
The publication cluster map shows that there are three main categories of patient safety literature. The publication rates of the categories are not equally divided. Research into the magnitude of the problem (category 1) is more highly represented and research into implementing solutions (category 3) is less represented. Research focusing on identifying and understanding patient safety risk factors (category 2) is also less represented than research on the magnitude of the problem, although there is an increase in publication rates in this category and therefore further growth can be expected. It is of concern though that a decline in publication rate is observed in the category ‘implementing solutions’, which is a category that already has a relatively small number of publications. This may be considered especially problematic given the fact that improvement in patient safety can only be established by actual implementation of solutions, not only by identifying and understanding flaws in the system.
The three main categories can be divided into 19 clusters each representing an area of patient safety research. The WHO patient safety research cycle describes five areas of patient safety research: (1) measuring harm, (2) understanding causes, (3) identifying solutions, (4) evaluating impact and (5) translating evidence into safer care.17 These five areas can be matched quite well to the categories found in the publication cluster map, thereby supporting the clinical validity of the map. Category 1 contains research into area 1 (measuring harm), category 2 contains research into areas 2 and 3 (understanding causes and identifying solutions) and category 3 contains research into areas 4 and 5 (evaluating impact and translating evidence into safer care).
The term map shows a gross division of terms into two sides, outcome parameters (right) and risk factors (left). This resembles a previously described framework of risk domains explaining patient safety in surgery according to a systems approach. This framework depicts patient safety as a balance between risk factors and measurable outcome parameters.18
A number of limitations of our analysis need to be mentioned. First, the results of the analysis depend on the approach taken to delineate the patient safety literature. The use of alternative criteria for identifying patient safety publications might have led to a different view on patient safety literature. Various technical limitations need to be kept in mind as well. The publication map relies on citation relations between publications. Citations are given for a multitude of reasons. Some citations reflect a strong topical relatedness between the citing and the cited publication, but this is not the case for all citations, and we have not been able to distinguish between these different types of citations. In case of the term map, terms may sometimes be ambiguous due to problems with synonyms and homonyms. Furthermore, both the publication and the term map are restricted to a 2D space, which means that they may not always be able to represent the relatedness of publications or terms in the most accurate way. The clusters of publications or terms that were created have the restriction that each publication or term can belong to one cluster only, making it difficult to properly represent publications and terms that relate to multiple topics.
In conclusion, large amounts of literature can be analysed using bibliometric data. Visualising this data using tools such as VOSviewer makes it possible to obtain a broad overview of the structure of the literature on a particular topic of interest. This approach can be very useful for improving one's understanding of a complex research topic such as patient safety. Other complex multidimensional research fields (eg, technology assessment) can be analysed in a similar way. This method of analysing literature may help to suggest new research directions or alternative research priorities. For patient safety research in particular, this method suggests that research on implementing patient safety improvement initiatives receives relatively limited attention.
References
Footnotes
-
Contributors SPR has contributed to the conception and the design of the study, and to the analysis and interpretation of data. She has drafted the article and has given final approval of the version to be published. NJvE and LW have contributed to the conception and the design of the study, and to the analysis and interpretation of data. They have revised the manuscript critically for important intellectual content and have given final approval of the version to be published. FWJ has contributed to the analysis and interpretation of data. NJvE, LW and FWJ revised the manuscript critically for important intellectual content and have given final approval of the version to be published.
-
Funding This research received no specific grant from any funding agency in the public, commercial or not-for-profit sectors.
-
Competing interests None.
-
Provenance and peer review Not commissioned; externally peer reviewed.
-
Data sharing statement No additional data are available.