Article Text

Abstract
Objectives The impact of the national salt reduction programme in the UK on social inequalities is unknown. We examined spatial and socioeconomic variations in salt intake in the 2008–2011 British National Diet and Nutrition Survey (NDNS) and compared them with those before the programme in 2000–2001.
Setting Cross-sectional survey in Great Britain.
Participants 1027 Caucasian males and females, aged 19–64 years.
Primary outcome measures Participants’ dietary sodium intake measured with a 4-day food diary. Bayesian geo-additive models used to assess spatial and socioeconomic patterns of sodium intake accounting for sociodemographic, anthropometric and behavioural confounders.
Results Dietary sodium intake varied significantly across socioeconomic groups, even when adjusting for geographical variations. There was higher dietary sodium intake in people with the lowest educational attainment (coefficient: 0.252 (90% credible intervals 0.003, 0.486)) and in low levels of occupation (coefficient: 0.109 (−0.069, 0.288)). Those with no qualification had, on average, a 5.7% (0.1%, 11.1%) higher dietary sodium intake than the reference group. Compared to 2000-2001 the gradient of dietary sodium intake from south to north was attenuated after adjustments for confounders. Estimated dietary sodium consumption from food sources (not accounting for discretionary sources) was reduced by 366 mg of sodium (∼0.9 g of salt) per day during the 10-year period, likely the effect of national salt reduction initiatives.
Conclusions Social inequalities in salt intake have not seen a reduction following the national salt reduction programme and still explain more than 5% of salt intake between more and less affluent groups. Understanding the socioeconomic pattern of salt intake is crucial to reduce inequalities. Efforts are needed to minimise the gap between socioeconomic groups for an equitable delivery of cardiovascular prevention.
- EPIDEMIOLOGY
- NUTRITION & DIETETICS
- PREVENTIVE MEDICINE
- PUBLIC HEALTH
- STATISTICS & RESEARCH METHODS
This is an Open Access article distributed in accordance with the Creative Commons Attribution Non Commercial (CC BY-NC 4.0) license, which permits others to distribute, remix, adapt, build upon this work non-commercially, and license their derivative works on different terms, provided the original work is properly cited and the use is non-commercial. See: http://creativecommons.org/licenses/by-nc/4.0/
Statistics from Altmetric.com
Strengths and limitations of this study
-
The National Diet and Nutrition Survey is a rolling programme of screening of a nationally representative sample of the British population regarding diet, nutrient intake and nutritional status.
-
This analysis is the first evaluation of the effect of a national programme of salt reduction on social inequalities.
-
The Bayesian approach allows for spatial variations as well as the contribution of known and unknown confounders to be determined.
-
Estimates of dietary intake are reinforced by the parallel update of food composition tables on salt content.
-
Dietary salt intake was assessed by 3-day or 4-day food diaries. This is at variance with the 2000–2001 survey when dietary salt intake was assessed with 7-day dietary records.
-
Only salt coming from food was assessed, with no inclusion of discretionary salt deriving from that added to food at the table, and during the cooking process.
-
The definitions of socioeconomic status were based on occupation and educational attainment.
-
Results are based on the Caucasian respondents of the survey, since the representation of ethnic minority groups is still insufficient for independent analysis.
-
Limitations are also due to the relatively small number of spatial units and regional classifications.
Background
High blood pressure (BP) is the most common, yet preventable, cause of morbidity, disability and death worldwide, responsible for more than half the deaths from coronary heart disease (CHD), stroke and cardiovascular disease (CVD).1 The risk of CVD is now becoming more prevalent in low-income and middle-income countries2 and, within countries, is more prevalent in socially disadvantaged groups.3 A reduction in high BP with antihypertensive medications significantly reduces BP and CVD.4 However, the majority of events in the population occur in the range of BP not qualifying for drug therapy.5 A population approach to achieve small BP reductions across the whole range of BP levels would therefore avert the majority of CVD events.6 Finally, in low-income and middle-income countries the implementation of healthcare programmes of detection, management and control of hypertension with drugs is still haphazard due to high costs and lack of healthcare infrastructures,7 ,8 making non-pharmacological public health programmes of primary prevention a cost-effective priority.9 ,10
Evidence from a variety of sources shows a consistent relationship between salt intake and BP, so that a moderate reduction in salt intake reduces BP in a dose-dependent manner, in men and women, young and old, from all ethnic groups and at any level of BP.11 Furthermore, there is evidence to suggest that these effects on BP could lead to a significant reduction in cardiovascular events, and crucially in strokes.12 ,13 Several approaches can be taken to reduce population salt intake11 and national and international organisations have now developed policies and started population programmes aiming at a reduction in population salt intake,14 a cost-effective prevention policy15 ,16 with rapidly occurring health benefits.17 ,18
Dietary salt, primarily sodium chloride, is commonly used for food preservation and seasoning. In most westernised countries, like the UK, approximately 75% of salt consumed is hidden in processed and restaurant foods whereas only about 15% comes from discretionary use (added at the table or in cooking by the consumer or food handler).19
Driven by this evidence, the UK Food Standards Agency (FSA) initiated a salt reduction programme in 2003, aiming to reduce the average salt intake to 6 g/day in the UK population.20 Later, the FSA and the Department of Health worked together with the food industry to reduce the sodium content in processed foods by setting voluntary salt reduction targets, ran a public campaign to raise customer awareness and developed a food labelling scheme.21 After 10 years, salt intake in the UK has decreased by 1.4 g/day, a 15% reduction, from 9.5 to 8.1 g/day.22 This reduction has been associated with a BP reduction of 3.0/1.4 mm Hg and a parallel decline in CHD and stroke mortality.22 The sodium content of processed food in supermarkets has also been reduced by 20–30%,23 particularly in packaged bread, the biggest contributor of salt intake in the British diet.24
Health inequalities are variations in health status across individuals in a population.25 Health inequalities by socioeconomic status (SES) are common. CVD is more prevalent in socioeconomically deprived populations and groups within populations. Low SES is associated with hypertension and high risks of stroke, CHD and renal failure.26 These groups are more likely to depend on cheaper unhealthy processed food diets, high in salt.27 The Marmot Review28 affirmed social inequalities as important determinants of ill-health in the British population, highlighting the social gradient in health inequalities, whereby people of poorer background not only die sooner but spend more of their lives with disabilities. There are different methods to measure inequalities in health.3 ,25 ,29 ,30 Health inequalities arise from a complex interaction of many factors, one of which is poor diet and nutrition. Health inequalities are preventable through government policies aimed at the population as a whole.28 In general, ‘downstream’ preventive interventions with focus on individual behavioural changes are more likely to increase health inequalities than ‘upstream’ social or policy interventions.31 Among the former, media campaigns may be particularly likely to increase inequalities while the latter tend to reduce health inequalities, as they are usually ‘structural’.32 ,33 Furthermore, the risk of hypertension associated with low parental social status can be modified by an improvement in social status later in life,34 suggesting effective targets for public health policies and political interventions. In a previous analysis using the National Diet and Nutrition Survey (NDNS) 2000–2001, we identified significant spatial and socioeconomic patterns of salt intake (measured by dietary sodium and urinary sodium) in Britain.35 In 2105 men and women aged 19–64 years, salt consumption was assessed using both 7-day dietary records and 24 h urinary sodium excretion. Socioeconomic position was defined both on head of household occupation and also on participant's educational attainment. Bayesian geo-additive models via Markov Chain Monte Carlo simulations were used to test the independent associations accounting for linear and non-linear effects and spatial variations. Dietary and total salt consumption were higher in Scotland and in lower socioeconomic groups, whether assessed by occupation or by educational attainment (with difference estimates varying from 4% to 9%). As the UK programme has successfully reduced the population salt intake, it is yet unknown whether this national programme has made any change in this inequality. Thus, this paper aims to examine the spatial and socioeconomic patterns of salt intake using recently released UK NDNS data (2008–2011), and compare the possible change of these patterns before and after the implementation of the UK salt reduction programme.
Data and methods
This analysis was conducted using data from the 2008–2011 British NDNS. This survey is part of a national programme set up in 1992 to provide a cross-sectional and nationally representative sample of the British population regarding diet, nutrient intake and nutritional status. Details of the fieldwork and the survey are described elsewhere.36 In 2008, it changed to a Rolling Programme to better capture trends and to quickly meet political needs. One thousand to 1500 people aged 1.5–94 years are recruited every year as a representative sample of the general population in the UK (including England, Wales, Scotland and Northern Ireland). Participants are classified into three age groups: 1.5–18 years, 19–64 years and 65 years and over. The fieldwork for the latest survey was carried out throughout 2008–2011 to account for any possible seasonal variations in dietary intake. At the household level, about 26% of the 9990 issued household addresses were selected for the survey in 3 years. On an individual level, 3073 people participated in the interview by completing a series of questionnaires and measurements, including a 3-day or 4-day food diary, a sociodemographic background interview, height and weight measurements, smoking and drinking assessments by self-completed questionnaires and an assessment of physical activity by self-completed questionnaires or ActiGraph. Seventy-five per cent (unweighted for age, N=2318) of the participants were then visited by a nurse. This procedure included physical and BP measurements, a blood sample and 24 h urine collection, and collection of data on prescribed medicines. At this stage, 53% (unweighted for age, N=1614) of the interviewed participants provided 24 h urine sample (data not released to date). Of the total participants, 39% (N=1186) were adults (19–64 years). Caucasian respondents accounted for 90% (N=1069) of the adult population. Ethnic minority groups were excluded since estimation on few participants may not be representative of their ethnic group, particularly when compared by region. Finally, participants from Northern Ireland were also excluded due to small numbers (n=42), leaving a total sample size of 1027.
Height and weight were measured to the nearest 0.1 cm and 0.1 kg, respectively, to calculate body mass index (BMI=weight/height (kg/m2)). BP measurements were taken three times in a sitting position. The average of the second and third reading was used as the participant's BP level. SES was measured by two indicators, educational attainment and occupation. Educational attainment was based on the information of the highest qualification achieved. Some participants obtained foreign qualifications or were still in full-time education. Hence, a missing value was assigned to those participants. Occupation was determined by the socioeconomic classification (SEC) of the household reference person. Unlike the previous cross-sectional programme (based on The Registrar-General’s Social Classes), the rolling programme defines the SEC by the National Statistics SEC (NS-SEC),37 which is developed from the Standard Occupational Classification 2010 (SOC2010). Details of the definitions of the classification can be found in the NDNS year 3 report.38 The NS-SEC grouped the participants into eight occupational classes: (1) higher managerial, administrative and professional; (2) Lower managerial, administrative and professional; (3) Intermediate; (4) Small employers and own account workers; (5) Lower supervisory and technical; (6) Semiroutine; (7) Routine; and (8) Never worked and long-term unemployed. The SES information was simplified into 3-class version39: (1) Higher managerial, administrative and professional (containing level 1–2); (2) Intermediate (level 3–4); (3) Routine and manual (5–7). There were only 18 participants in the ‘Never worked and long-term unemployed’ category (level 8). Hence, they were coded as missing values. Meanwhile, some participants classified as full-time students or other occupations not stated or inadequately described were also coded as missing values. Marital status included five categories: (1) single, (2) married and living with husband or wife, (3) married and separated, (4) divorced, (5) widowed. With the information of whether they were living with a partner, the marital status used in this analysis was coded as either living alone or living with partner. Smoking habit was derived from questions concerning smoking history. Based on their smoking history, the NDNS participants were recorded as current, former or non-smoker. Daily sodium intake was the outcome of interest. The food diary provided each participant's nutrient and energy intakes in weekdays and weekends. Sodium and energy intakes and alcohol consumption were based on the average of the 4-day dietary data. However, salt used in cooking and on the table (discretionary salt) was not measured.
Geographical boundaries
The NDNS rolling programme was conducted across the UK, including England, Scotland, Wales and Northern Ireland.40 The regional classification of England used in the rolling programme was different from the classification used in previous surveys, particularly in the north and south east part of England, which was mainly due to the use of Government Office Regions 2011. Details can be found on the website of the Office for National Statistics.41 As the Bayesian models are unable to make estimation over disconnected regions (ie, Northern Ireland and the rest of Great Britain), data collected from Northern Ireland were excluded from this study. Therefore, the analysis was limited to mainland Britain, and only boundary data of England, Scotland and Wales were collected from UKBORDERS.
Statistical methods
The Kruskal-Wallis test was used to compare the regional difference of dietary sodium intake. Bayesian geo-additive models were employed to analyse the spatial and socioeconomic patterns of sodium intake while accounting for the linear or non-linear effects of a range of important covariates, as detailed elsewhere.35 Four models were built and assessed. One level of each categorical factor was set as the reference level for effect assessment. Cube root transformation was used to normalise the dietary sodium intake. This was identical to the transformation used in our previous analysis.35 Deviance information criterion (DIC) was used for model selection. The model with the smallest DIC value was preferred (see online supplementary appendix 1). The descriptive analysis and tests were conducted using SPSS V.21 (IBM Corp., Armonk, New York, USA). Model estimations were conducted in BayesX V.2.1 (07.05.2012).42 The statistical significance level was set as α=0.05 in the descriptive analysis and α=0.1 in the models.
Results
One thousand and twenty-seven Caucasian participants were included in the analysis. The age and sex adjusted characteristics of the study population are summarised in table 1. The mean age was 43.3 (95% CI 42.5 to 44.0) years and women accounted for 56.4% (N=579) of the sample. 27.1% of the participants had a higher educational attainment, 31.1% an A level, below degree or equivalent educational attainment and 25.5% a General Certificate of Secondary Education (GCSE) or equivalent educational attainment. Participants in higher socioeconomic groups accounted for 45.9% of the sample.
Age and sex adjusted characteristics of the population of the National Diet and Nutrition Survey 2008–2011
Dietary sodium
The median sodium intake was 2245 (IQR=1092) mg/day, which approximated to 5.6 g of salt/day (100 mg sodium=0.25 g salt). The median energy intake was 1799 (IQR=761) kcal/day. Figure 1 shows the observatory map of sodium intake by region. Sodium intake was highest in Scotland, followed by the West Midlands. The regional differences, however, were not statistically significant (p=0.145; table 2).
Dietary sodium intake (without discretionary salt consumption) by region in the 2008–2011 National Diet and Nutrition Survey sample of Caucasian participants

Estimated posterior mean residual spatial regional effects of dietary sodium intake. The colour band represents the range of regional effect. Shades in red/green correspond to high/low level of dietary sodium consumption.
The DIC results of the models were presented in online supplementary appendix 1. Model 3 with linear assumption of the covariates performed the best in terms of the DIC value. Hence, the results of Model 3 were presented in table 3. Once adjusted for all confounders in the model, dietary sodium intake significantly decreased with age and men had higher dietary sodium intake than women. As expected, dietary sodium intake was positively associated with body mass as a result of its association with energy intake. Participants at the lowest end of educational attainment (no qualification) had significantly higher dietary sodium intake than the reference group (higher education at degree level; 5.7% (0.1%, 11.1%); online supplementary appendix 2). To avoid the effect of residual confounding, a set of models with five-category occupation was also examined. No substantial change, particularly in terms of the statistical significance, was detected between the two approaches (results not shown). A similar trend (though not statistically significant) was observed between dietary sodium intake and occupation.
Fixed effect of dietary sodium intake in the 2008–2011 National Diet and Nutrition Survey sample of Caucasian participants
Comparison with the 2000–2001 NDNS
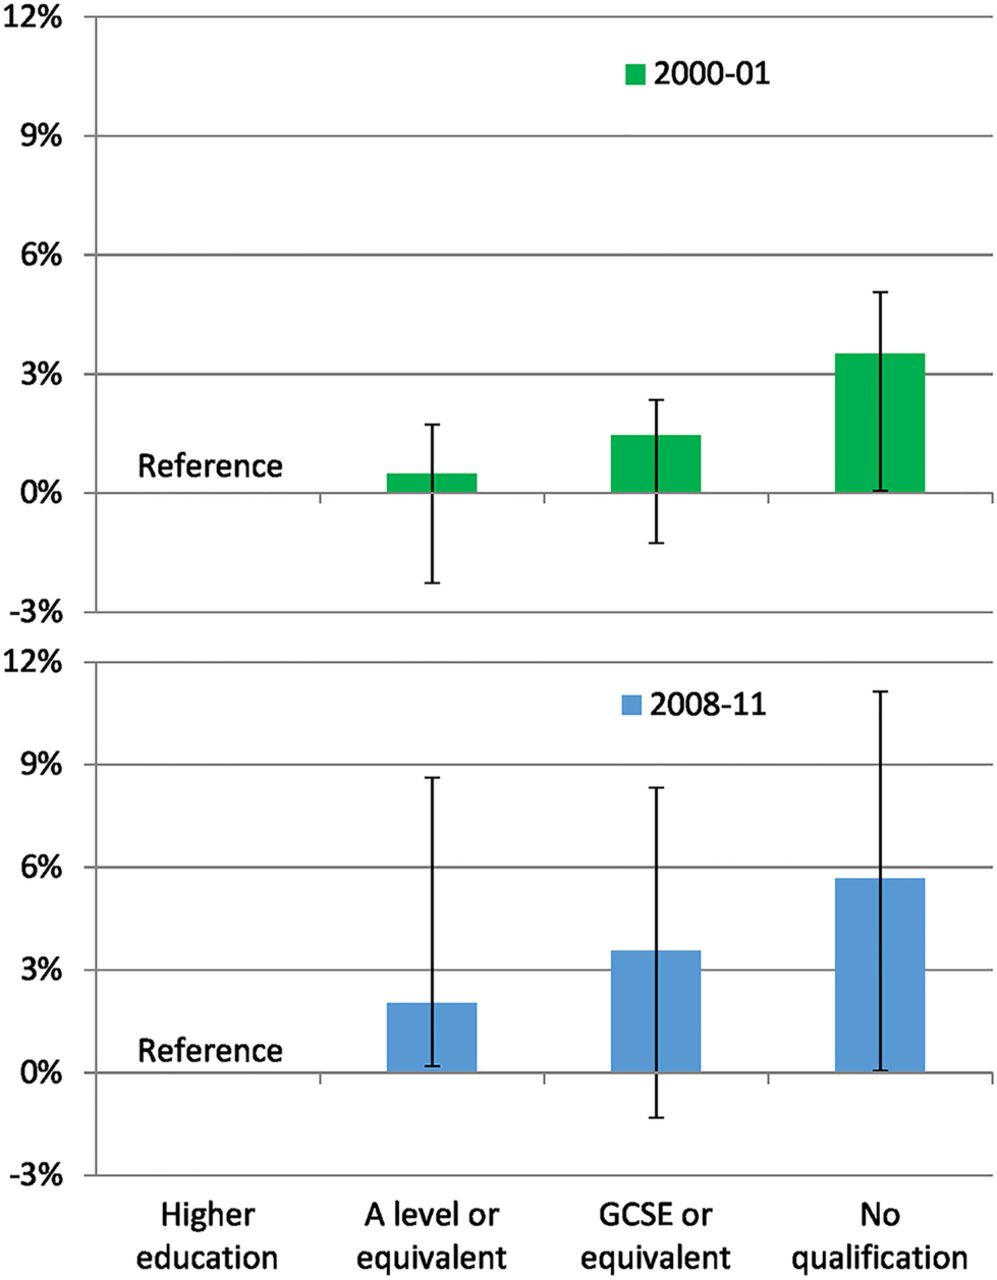
Compared with the analysis of the NDNS 2000–2001,35 while the spatial differences in dietary sodium intake in NDNS 2008–2011 still followed the pattern of increasing levels from south to north (with Scotland showing the highest), the results were no longer statistically significant (figure 1 and table 2). Between the two surveys (almost 10 years apart) there was an average reduction in dietary sodium intake of 366 mg/day (or 0.9 g of salt/day). Crucially, the socioeconomic gradient remained (figure 2). If anything, the proportional gap appeared to widen (from 3.5% (0.1%, 7.2%) to 5.7% (0.1%, 11.1%)) between those with no qualification and the reference group (higher education at degree level; see online supplementary appendix 2).

The effect of education attainment (and 90% credible intervals) on dietary sodium intake in Britain in 2000–2001* (top) and 2008–2011 (bottom). Note: Higher education (degree level) was used as the reference level. The effect of each educational attainment was derived by assuming a 2500 mg dietary sodium intake/day (approximately 6.26 g/day in salt, not including discretionary salt intake) for an adult holding a degree (reference). The effect is considered significant if the entire credible interval does not include 0. *Although the Bayesian geo-additive models were used using the same set of factors with the same model setting, ‘social class’ was defined using a different classification in 2000–2001. In addition, the dietary sodium, energy and alcohol intakes were measured based on a 7-day dietary record in 2000–2001 and on 4-day food diaries in 2008–2011.
Discussion
Our analysis confirms a socioeconomic gradient in dietary salt intake in Britain in 2008–2011 independent of a geographic gradient. In addition, it shows for the first time that after 10 years of a national programme of population reduction in salt intake, social inequalities in salt consumption have remained. This study extends our original approach of analysing spatial variations of salt intake to establish the contribution of socioeconomic variations and other confounders after 10 years of a population-based programme of salt reduction, thus providing a unique opportunity to evaluate effects on inequalities.
Strengths and limitations
The study has strengths. The NDNS is a rolling programme of screening of a nationally representative sample of the British population regarding diet, nutrient intake and nutritional status. This analysis is the first evaluation of the effect of a national programme of salt reduction on social inequalities. The Bayesian approach allows us to determine spatial variations as well as the contribution of known and unknown confounders. Finally, estimates of dietary intake are reinforced by the fact that food composition tables on salt content have been updated recently.
The study has limitations. Dietary salt intake was assessed by 3-day or 4-day food diaries. This is at variance with the 2000–2001 survey when dietary salt intake was assessed with 7-day dietary records.35 Notwithstanding the general comparability of group estimates using the two methods,43 ,44 in this round only salt coming from food was assessed, with no inclusion of discretionary salt deriving from that added to food at the table, and during the cooking process. Discretionary salt intake may account for approximately 15% of the total salt consumption,19 and additional socioeconomic inequalities in salt consumption may well depend on further variations in discretionary use. Total salt intake is best measured by 24 h urinary sodium excretion.45 ,46 In the 2000–2001 analysis both spatial and socioeconomic patterns were comparable with dietary and total salt estimates.35 The definitions of SES were based on occupation and educational attainment. While limited, these definitions are comparable to those used in 2000–2001.35 Our results are based on Caucasian respondents, since the representation of ethnic minority groups was still insufficient for an independent analysis. The generalisability of the findings is therefore limited to Caucasians. Limitations are also the relatively small number of spatial units and regional classifications.35 The possibility of residual confounding cannot be ruled out completely.
Context
The UK initiated a nationwide salt reduction programme in 2003/2004 based on several public awareness campaigns, setting progressing targets on the salt content of processed food led by the FSA, a voluntary agreement with the food industry to reformulate bread and processed foods and a rolling programme of repeated surveys to monitor the salt intake of the population11 and the salt content of some food categories.24 The programme has been successful and resulted in a 1.4 g/day (15%) reduction in salt consumption in the English population by 2011, as measured by 24 h urinary sodium excretion (from 9.5 g/day in 2003 to 8.1 g/day in 2011).22 During the same period of time population BP fell by 3.0/1.4 mm Hg (2.7/1.1 mm Hg in those not on treatment for hypertension) and both stroke and IHD mortality decreased by 36%.22 The average salt level in bread fell from 1.23 g/100 g in 2001 to 0.98 g/100 g in 2011, and the number of products meeting the 2012 targets increased from 28% in 2001 to 71% in 2011.24 Our study indicates a 0.9 g/day reduction in population dietary salt intake between surveys, which should be interpreted as primarily deriving from food reformulation rather than by behavioural modifications in the use of discretionary salt at the table and in cooking.
Implications for policy
The diet of socioeconomically disadvantaged groups is made up of low-quality, salt-dense, high-fat, high-calorie unhealthy cheap foods.3 ,47–53 A behavioural approach to healthy eating is unlikely to bring about the changes necessary to halt and reverse the non-communicable diseases epidemic and it may widen inequalities.11 ,32 ,54 SES inequalities in dietary access and consumption of healthy foods are widely documented28 both within countries3 and between countries,55 and for salt intake are detectable in children56 as well as adults.35 Australian children from a low SES have on average 9% greater intake of salt from food sources compared to those from a high SES.56 In our study these differences are estimated to be between 5% and 6%.
The findings of a sustained SES gradient in population dietary salt intake from 2000–2001 to 2008–2011 is disappointing, as one would have expected a larger reduction in lower SES following a population-wide approach.32 There are multiple interpretations of these findings. First, our results do not indicate that the total salt consumption is still higher in low SES as we do not have measures of 24 h urinary sodium excretion in the 2008–2011 survey that are directly comparable with those taken in 2000–2001. However, in the 2000–2001 survey both measures (dietary sodium and 24 h urinary sodium) were used and the results were consistent.35 Second, to counterbalance the higher dietary salt intake in low SES, the same groups should have reduced discretionary salt substantially following public awareness campaigns, an effect not anticipated32 and not reported as yet in the literature. Third, the inequalities we detect for dietary salt intake could be even greater if we assumed that the consumption of junk food from unregulated street retailers is more common in people of low SES. Indeed, recent results from the analysis of data for take-home food and beverage purchases from British households in 2010 indicates that shopping baskets of higher SES groups are healthier (proportionally more purchasing of fibre, protein and total sugars and less sodium) than those of lower SES groups.27 Fourth, it is possible that the reformulation of food items (beyond bread) has covered, disproportionately, food items not predominantly purchased by low SES groups. A more detailed monitoring of household food purchasing in relation to targeted reformulation and improved access by acting on pricing should be included in surveillance methods to reveal potential targets to reduce social inequalities in salt intake. Fifth, the UK salt reduction programme started with three waves of media campaigns to increase awareness and change behaviour. The engagement with industry, which included target settings and food reformulation, was implemented later and its effects might not have had enough time to impact on social inequalities.
Conclusions
Social inequalities in salt intake have not seen a reduction following the national salt reduction programme and still explain more than 5% of salt intake between more and less affluent groups. Understanding the socioeconomic pattern of salt intake is crucial to reduce inequalities. Efforts are needed to minimise the gap between socioeconomic groups for an equitable delivery of cardiovascular prevention.
Acknowledgments
The analysis was carried out under the Terms of Reference of the WHO Collaborating Centre for Nutrition (UKN-219).
References
Supplementary materials
Supplementary Data
This web only file has been produced by the BMJ Publishing Group from an electronic file supplied by the author(s) and has not been edited for content.
Files in this Data Supplement:
- Data supplement 1 - Online tables
Footnotes
-
Contributors FPC developed the idea, obtained funding, supervised the analysis and drafted the manuscript. CJ carried out the statistical analysis and prepared the draft methods and results. FPC acts as guarantor.
-
Funding The Bupa Foundation (MR-12-002).
-
Competing interests FPC is an unpaid member of CASH, WASH, UK National Forum, UK Public Health NACD; unpaid technical advisor to NICE, the WHO and the Pan-American Health Organization; and Trustee of the Student Heart Health charity.
-
Ethics approval West Midlands BREC (158-01-2012).
-
Provenance and peer review Not commissioned; externally peer reviewed.
-
Data sharing statement No additional data are available.
Linked Articles
- Correction