Article Text

Abstract
Objectives To examine whether the first admission to hospital after the age of 60 has been postponed to higher ages for men and women in Sweden, in line with the shift in mortality.
Design This nationwide observational study was based on data obtained from national registries in Sweden. The study cohort was created by linking the Register of the Total Population in Sweden with the National Patient Register and the Swedish Cause of Death Register.
Setting The entire Swedish population born between 1895 and 1950 was followed up between 1987 and 2010 with respect to hospital admissions and deaths using the national registry data.
Primary outcome measures The time from age 60 until the first admission to the hospital, regardless of the diagnosis, and the time from age 60 until death (remaining life expectancy, LE) were estimated for the years 1995–2010. The difference between these two measures was also estimated for the same period.
Results Between 1995 and 2010 mortality as well as first hospital admission shifted to higher ages. The average time from age 60, 70, 80 and 90 until the first hospital admission increased at all ages. The remaining LE at age 60, 70 and 80 increased for men and women. For the 90-year-olds it was stable.
Conclusions In Sweden, the first hospital admission after the age of 60 has been pushed to higher ages in line with mortality for the ages 60 and above. First admission to the hospital could indicate the onset of first severe morbidity; however, the reorganisation of healthcare may also have influenced the observed trends.
- Hospital Admission
- Trends
- Death
- Mortality
- Morbidity
- Sweden
This is an Open Access article distributed in accordance with the Creative Commons Attribution Non Commercial (CC BY-NC 3.0) license, which permits others to distribute, remix, adapt, build upon this work non-commercially, and license their derivative works on different terms, provided the original work is properly cited and the use is non-commercial. See: http://creativecommons.org/licenses/by-nc/3.0/
Statistics from Altmetric.com
Article summary
Strengths and limitations of this study
-
Our study has a nationwide coverage resulting in a large population without any selection bias.
-
The longitudinal design allowed us to identify the first hospital admission and to follow individuals over time to estimate the hospitalisation-free time from the age of 60.
-
This study focuses on the time after the age of 60 until the first admission to the hospital, not taking into consideration subsequent events.
Introduction
Life span has continuously increased for many countries including Sweden during the 20th century1 and even earlier. This trend was initiated by reductions in infant and child mortality, however, since the 1950s, most part of the mortality reduction was observed for older ages.2 This has resulted in a rapid increase in the proportion of old individuals in the population.3 In Sweden, the number of individuals that live to celebrate their 100th birthday has increased considerably from 1969 to 2009 (a 9-fold increase for men and a 18-fold increase for women).4 The question of whether health has improved at a similar pace as life expectancy (LE) has become very important. Has morbidity decreased faster than mortality (compression of morbidity5), slower than mortality (expansion of morbidity6), or at the same pace as mortality (relative compression of morbidity7)? A potential challenge with an aging population is an increase in the number of individuals with chronic diseases, leading to an increased demand for medical care.8 This scenario may, however, not be true if morbidity is postponed to higher ages parallel to the increase in LE.9
Previous research has not reached a consensus on how the health of the elderly has changed over time,10 ,11 mainly since health is a multidimensional concept measured by different indicators. In the research on ageing, measures of disability and functional limitations have been most commonly used.12 Several studies have also examined incidence trends of major diseases among older individuals with different results,9 ,13–16 some diseases have declined9 ,13 ,15 whereas some appear to have been stable or even increasing.16
In addition to examining disease-specific trends, overall admission rates to the hospital over time could be informative in order to interpret changes in health and healthcare over time. In the present study, we examined trends in first hospital admission after the age of 60 for the period 1987–2010, that is, whether the first hospital admission has been postponed to higher ages, for men as well as women in Sweden. Trends in the first admission to the hospital were compared with trends in mortality.
Material and methods
Study cohort
The study cohort was created by linking the register of the total population in Sweden with the National Patient Register, the Swedish Cause of Death Register, and the Longitudinal Integration Database for Health Insurance and Labour Market Studies (LISA). In Sweden, all individuals have a unique personal identification number, which makes it possible to identify them in all registries. All databases were linked using this personal identification number. The linkage was conducted by Statistics Sweden and the researchers received deidentified data sources with a reference number (unique for each individual) instead of the personal identification number.
The Swedish Register of the Total Population17 has nationwide coverage since 1968. It was used to collect information regarding the date of birth and migration status of individuals in the study cohort.
In order to minimise the risk of including individuals whose emigration or death has not been properly recorded in the Register of the Total Population, the LISA database18 was used, which includes information about individuals’ pensions and social transfers on an annual basis.
The National Patient Register19 has nationwide coverage since 1987 and was used to collect information about the inpatient care received by individuals living in Sweden from 1987 to 2010.
The Swedish Cause of Death Register20 was used to identify all deaths occurring inside or outside Sweden (for individuals registered in Sweden). The Swedish Cause of Death Register as well as the National Patient Register are maintained by The National Board of Health and Welfare.
Setting
All men and women above the age of 60, born between 1895 and 1950 and living in Sweden in 1987 were included in the study cohort. They were followed for hospital admissions and deaths from 1987 to 2010. The follow-up ended at whichever of the following dates occurred first; date of first hospital admission after the age of 60, date of death, date of migration or 31 December 2010.
Statistical analysis
The graphical representation of the study measures can be found in figure 1.

Description of study measures.
Mortality
Period life tables were constructed for the calendar years 1995–2010 to obtain the remaining LE, and the expected distribution of deaths. Calculations were based on age-specific death risks, estimated by dividing the number of deaths for each calendar year with the total number of individuals at risk in that calendar year (ie, population at the beginning of the calendar year). The remaining LE at a given age, for each calendar year, was derived from the life table by dividing the total number of person-years after a given age with the number of persons alive at that age. The expected distribution of deaths was calculated by multiplying the age-specific death risk with the probability of being alive at that age.
First hospital admission
First admission to the hospital was defined as the first admission after the age of 60 with a minimum duration of two nights. Fatal as well as non-fatal events were taken into account.
Since the National Patient Register had complete national coverage first in 1987, it was not possible to know whether individuals had any hospital admissions before 1987. Consequently, since we were interested in capturing the first admission to the hospital after the age of 60 that was independent of any admissions happening before (ie, we wanted to exclude readmissions), we applied a 7-year transition period that has been previously used by the Swedish National Board of Health and Welfare in their calculations of incidence of myocardial infarction.21 Thus, all individuals hospitalised between 1987 and 1994 were excluded from the study population. In the next step we tested whether the 7-year period was sufficient by comparing the age-specific hospital admission rates using the longest possible follow-up period, 23 years (from 2010 and back to 1987), and by restricting the follow-up to 7 years (from 2010 and back to 2003). The calculations showed that a period of 7 years was likely not long enough; the rate of admission appeared to be overestimated in the beginning of the period. In order to account for this overestimation, age-specific correction factors, derived from the comparison, were applied to the years 1995–2010. The correction factors weighted down the admission rates in the beginning of the follow-up period.
Analyses of first hospital admission followed the same procedure as for deaths, using period life tables to estimate the time until the first admission to the hospital and the expected distribution of first hospitalisations. The age-specific risk of being admitted to the hospital for the first time after the age of 60 was calculated based on the number of admissions for each calendar year divided with the population at the beginning of the calendar year. The time at a given age until the first admission to the hospital, for each calendar year, was derived by dividing the total number of hospitalisation-free person years after a given age by the number of persons without an admission to the hospital at that age. The expected distribution of first hospital admissions was calculated by multiplying the age-specific risk of being admitted to the hospital with the probability of being free of hospitalisation at that age.
The International Classification of Diseases (ICD) 9 and 10 was used to determine the causes of hospitalisations and deaths. All causes were taken into account.
Sensitivity analyses
An admission to the hospital for a minimum duration of two nights was chosen for the analysis to ensure some degree of severity of a disease. In the sensitivity analysis we altered the minimum stay in the hospital between 1 and 16 nights to examine the impact our definition of hospital admission had on the trends. After a careful examination of our data, we observed that hospital stays that were longer than 16 nights were not frequent. Therefore, we chose to vary the minimum stay in the hospital between 1 and 16 nights.
In addition, to evaluate the impact on the trends from two major causes of hospitalisations and deaths, sensitivity analyses were made where we excluded all cardiovascular diseases (CVD), and all malignancies, respectively. CVD was defined as; ICD9 codes: 340–359, ICD10 codes: I00–I99. Malignancies were defined as: ICD9 codes: 140–206, ICD10 codes: C00–C97.
Results
In figure 2A,B the expected distribution of deaths for the ages 60–100 is presented for 4 calendar years, 1995, 2000, 2005 and 2010, for men (2A) and women (2B). Corresponding results of the expected distribution of first hospital admissions for 60-year-old to 100-year-old individuals, for the same calendar years, are shown in figure 3A men and figure 3B women. Vertical lines show the remaining LE at age 60 and the time from age 60 until the first admission to the hospital for each calendar year.

Distribution of all-cause mortality, (A) for men and (B) for women, for 4 calendar years, ages 60–100. Vertical lines present the remaining life expectancy, at age 60 for the same calendar years.

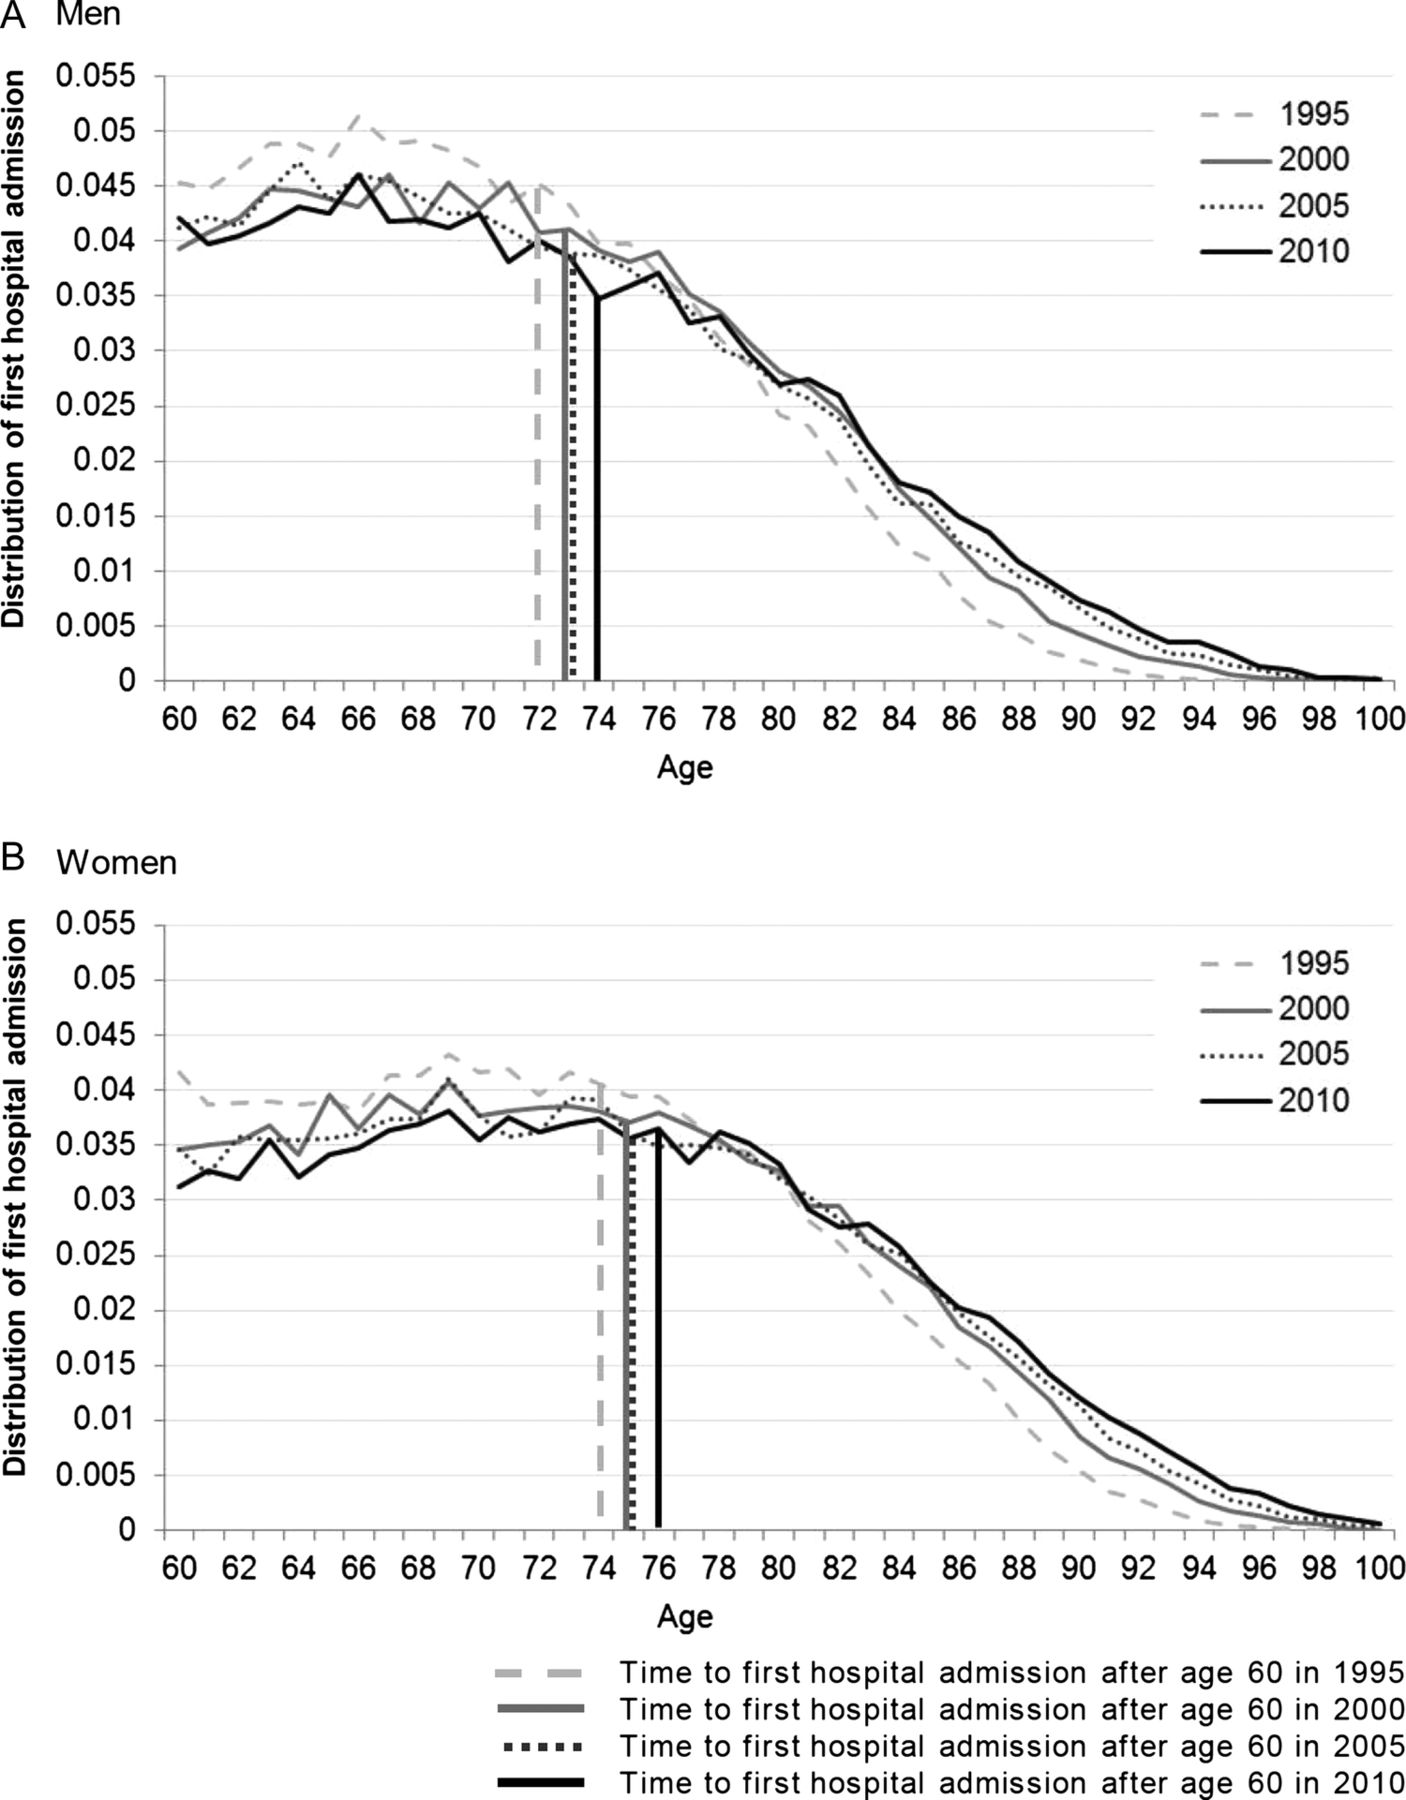
Distribution of all-cause first hospital admission, (A) for men and (C) for women, for 4 calendar years, ages 60–100. Vertical lines present the time to first hospital admission after the age of 60 for the same calendar years.
For men as well as women there has been a shift in mortality towards older ages over time, which is visible from the shift of the curves to the right (figure 2A,B). The remaining LE at the age of 60 increased from 21.3 years in 1995 to 24.0 years in 2010 for men and from 25.5 to 27.0 years for women. A similar shift to higher ages between 1995 and 2010 was also observed for the first hospital admission, for men as well as women (figure 3A,B). The time after the age of 60 until the first admission to the hospital increased from 12.2 to 14.0 years for men and from 13.9 to 15.9 years for women.
While mortality curves appear to have become somewhat compressed over time (curves became narrower with a higher top), the ones representing first hospital admission seem to have shifted without being compressed.
In figure 4A,B, the remaining LE and the time until the first admission to the hospital are shown for different ages (60, but also for 70, 80 and 90 years) over time. For men, the remaining LE increased for all ages except for the 90-year-olds where it remained rather stable. The time until first hospital admission increased for all ages, also for the 90-year-olds (figure 4A). For women, there was an increase in the remaining LE as well as the time until first hospital admission for all age groups (figure 4B). For men as well as women the increase in remaining LE and time until first hospital admission was strongest for the 60-year-olds to 70-year-olds as compared with the 80-year-olds and 90-year-olds.

Remaining life expectancy (LE) and time to first admission to the hospital after the ages of 60, 70, 80 and 90, (A) for men and (B) for women.
Sensitivity analyses
No changes in the first hospital admission trends were observed when we re-ran the analyses varying the number of days admitted to the hospital from 1 to 16 (results not shown but available on request).
Censoring all CVD as a cause of death from the overall mortality resulted in an increase in the remaining LE at the age of 60 for men as well as women and for all calendar years, but had no impact on the shape of the trends, the curves still showed a similar shift. The same was true for malignancies. Similarly with mortality, censoring CVD or malignancies from all causes of first admission to the hospital had no impact on the trends (results not shown but available on request).
Discussion
The purpose of this study was to investigate time trends in the first admission to the hospital after the age of 60 in relation to mortality trends, for the period 1987–2010, for men as well as women in Sweden. The age of 60 was chosen because we were interested in hospital admissions related to morbidity in the older population. All causes of hospital admissions were taken into account, including elective surgery, which has increased over the period. However, we do not believe that this has an impact on our findings since such procedures still constitute a minor part of all hospital admissions in Sweden (main causes of hospital admissions are CVDs and neoplasms), and an even smaller part of first hospital admissions after the age of 60 (eg, hip replacement stands for less than 0.01% of all first hospitalisations above the age of 60).
Our results showed that there has been a shift towards older ages for the first hospital admission meaning that individuals live longer until their first hospital admission occurs. The same pattern was observed for mortality. For men, the remaining LE at the age of 60 increased more than the time from age 60 until the first hospitalisation. For women the opposite was true. This means that the time after the first hospital admission until death has increased for men and decreased for women. For the ages 70, 80 and 90, the shift of the remaining LE and first hospital admission was larger for younger ages (70-year-olds) compared to the oldest (80-year-olds and 90-year-olds); results for men and women were similar at these ages.
A convenient interpretation of the shift of the first hospital admission to higher ages is that it represents a shift of morbidity. However, a more cautious interpretation requires the consideration of the changes in the organisation of healthcare in Sweden between 1987 and 2010. Such changes are for example the shift from inpatient to outpatient care for some diagnosis, and also changes in the length of stay once hospitalised over time (which however, should not affect time to first hospital admission). Furthermore, the number of hospital beds in Sweden has decreased over the same period22; however, this could be a consequence of a more efficient healthcare, not necessarily affecting the likelihood of getting admitted to the hospital.22
The Swedish National Board of Health and Welfare has published a report regarding the causes of hospital admissions between 1987 and 2010 in Sweden.23 CVDs and neoplasms were the two main causes of all admissions to hospitals in Sweden. This is confirmed in our data also for the first hospital admission; the two main causes were then followed by injury, poisoning and certain other consequences of external causes (ICD 10 codes: S00–S99 and T00–T98, ICD 9 codes: 800–999), diseases of the musculoskeletal system and connective tissue (ICD 10 codes: M00–M99, ICD 9 codes: 710–739), and diseases of the digestive system (ICD 10 codes: K00–K93, ICD 9 codes: 520–579). In another report, the Swedish National Board of Health and Welfare also investigated which diagnoses switched from treatment in an inpatient to an outpatient setting.24 It is suggested that even though some diseases are now more commonly treated with day surgery in the outpatient care, very few diagnoses that were previously treated only with inpatient care, are now treated solely in an outpatient setting (such as cataract, glaucoma, and eye diseases in general). For diseases related to the circulatory system, the number of surgery events in outpatient setting per admission in inpatient setting was 0 .07 in 2010.24 However, the reports present the total number of persons with the specific disease for every year. Any changes in the age structure and size of the population seem not to have been taken into account. Also, the proportions treated in outpatient surgery24 are not given in age groups; it may be that younger individuals are treated in an outpatient setting to a higher extent than older individuals who are generally at higher risk of side effects. It is possible that over the period 1995–2010 some diseases have better control in primary/outpatient care therefore delaying admission to inpatient care. Our trends would then not necessarily mirror a healthier population but perhaps a population that has postponed severe illness.
Regarding the changes in the length of stay once hospitalised, the length of stay in hospitals in Sweden decreased between the years 1995 and 2010.25 The average in-hospital period (excluding geriatric and psychiatric care) was 5.03 days in 1998 and 4.31 days in 2010, a 14.3% decrease.24 This is supported by a Danish study of the oldest-old, comparing hospitalisations in the cohort of 1895 with the cohort of 1905. The younger cohort had more frequent hospital admissions but a shorter length of hospital stay.26 To examine the impact of this possible bias we ran a sensitivity analysis varying the number of days admitted to the hospital from 1 to 16, but no changes in trends were observed.
To sum up, in favour of the first interpretation of the shift in trends of first hospital admission to higher ages—a shift of first severe morbidity—is the decline in the incidence of important public health diseases such as myocardial infarction and stroke.9 ,15 Better control of diseases in primary care setting, making the outcome of diseases less severe, could be another aspect that may have contributed to this trend, allowing for a shift of the first admission to the hospital after the age of 60 to higher ages over time. Finally, since no changes in trends were observed when excluding two major causes of hospital admissions and deaths for individuals over the age of 60, CVD and malignancies, the observed shift indicates a rather universal change in the onset of the use of inpatient care and deaths. However, a partial shift from inpatient care to outpatient care and a decrease in the number of hospital beds in Sweden need to be taken into consideration when interpreting the trends.
A distinct advantage of our study is its nationwide coverage resulting in a large population without any selection bias. Any hospital admission could be identified irrespective of the type of hospital (public as well as private hospitals are included in the National Patient Register). The longitudinal design allowed us to identify the first admission to the hospital and to follow individuals over time to estimate the hospitalisation-free time from the age of 60.
Conclusion
This study showed that the time at first hospital admission for men and women over the age of 60 in Sweden has been postponed to higher ages between 1995 and 2010. This was in line with the postponement of age at death for the same period. Men experienced a larger increase in the remaining LE at age 60 than women. Men and women experienced a similar shift in time to first hospital admission. This result may be an indicator of a postponement of first severe morbidity to higher ages, even if policy changes in the healthcare sector cannot be ruled out completely as a confounding factor. Future research should look into trends of subsequent hospitalisations, and together with studies of incidence trends in major diseases, describe the overall health of the aging population.
References
Footnotes
-
Contributors KK, SD, TA, AA and KM were involved in the conception and design of the study, interpretation of the results, and critical revisions to the contents of the manuscript and approved the final version. KK and TA performed the analysis of the data. KK and KM drafted the manuscript.
-
Funding Swedish Research Council for Health, Working Life and Social Research (Forskningsrådet för hälsa, arbetsliv och välfärd, FAS) (grant number: 2011-0843).
-
Competing interests None.
-
Ethics approval An ethics approval for this study was obtained from the Regional Ethics Committee in Stockholm, Dnr 2011/136-31/5.
-
Provenance and peer review Not commissioned; externally peer reviewed.
-
Data sharing statement No additional data are available.