Article Text

Abstract
Objective: Transient elastography (TE) is gaining popularity as a non-invasive method for predicting liver fibrosis, but intraobserver and interobserver agreement and factors influencing TE reproducibility have not been adequately assessed. This study investigated these aspects.
Setting: Tertiary referral liver unit.
Patients: Over a 4-month period, 200 patients with chronic liver disease (CLD) with varying aetiology consecutively underwent TE and liver biopsy.
Interventions: TE was performed twice by two different operators either concomitantly or within 3 days of the bioptic procedure (METAVIR classification).
Main outcome measures: Intraobserver and interobserver agreement were analysed using the intraclass correlation coefficient (ICC) and correlated with different patient-related and liver disease-related covariates.
Results: 800 TE examinations were performed, with an indeterminate result rate of 2.4%. The overall interobserver agreement ICC was 0.98 (95% CI 0.977 to 0.987). Increased body mass index (>25 kg/m2), steatosis, and low staging grades (fibrosis (F) stage <2) were significantly associated with reduced ICC (p<0.05). Intraobserver agreement ICC was 0.98 for both raters. Using receiver operating characteristic curves, three diagnostic TE thresholds were identified: >7.9 kPa for F⩾2, >10.3 for F⩾3 and >11.9 for F = 4. TE values assessed by the two raters fell within the same cut-off of fibrosis in 88% of the cases for F⩾2, in 92% for F⩾3 and 91% for F = 4.
Conclusions: TE is a highly reproducible and user-friendly technique for assessing liver fibrosis in patients with CLD. However, because TE reproducibility is significantly reduced (p<0.05) in patients with steatosis, increased BMI and lower degrees of hepatic fibrosis, caution is warranted in the clinical use of TE as a surrogate for liver biopsy.
- A, necroinflammatory activity
- ALT, alanine aminotransferase
- AST, aspartate aminostransferase
- BMI, body mass index
- CLD, chronic liver disease
- F, fibrosis stage
- GGTP, and gammaglutamiltransferase
- HBV, hepatitis B virus
- HCV, hepatitis B virus
- ICC, intraclass correlation coefficient
- IQR, interquartile range
- NASH, non-alcoholic steatohepatitis
- ROC, receiver operating characteristic
- TE, transient elastography
- US, ultrasonography
- fibroscan
- liver fibrosis
- cirrhosis
Statistics from Altmetric.com
- A, necroinflammatory activity
- ALT, alanine aminotransferase
- AST, aspartate aminostransferase
- BMI, body mass index
- CLD, chronic liver disease
- F, fibrosis stage
- GGTP, and gammaglutamiltransferase
- HBV, hepatitis B virus
- HCV, hepatitis B virus
- ICC, intraclass correlation coefficient
- IQR, interquartile range
- NASH, non-alcoholic steatohepatitis
- ROC, receiver operating characteristic
- TE, transient elastography
- US, ultrasonography
Liver fibrosis is the prognostic hallmark of chronic liver diseases (CLD), and is currently best evaluated by histological examination of the liver.1,2 However, liver biopsy has several disadvantages, including poor patient compliance, sampling errors, limited usefulness for dynamic follow-up, and a risk of complications typical of invasive procedures.3–7 In addition, the predictive power of histology may be weakened not only by sampling variability, but also by the non-linear grading of the currently available staging systems.4 Together, these constraints of liver biopsy have boosted the search for non-invasive methods to assess progression of fibrosis, which is of strategic importance in the management of patients with CLD.
Staging systems based upon a combination of biochemical tests can have either a positive or negative predictive value for the diagnosis of clinically important fibrosis, but their overall diagnostic accuracy is far from optimum.8,9,10 Transient elastography (TE) is a recently developed, non-invasive device designed to predict liver fibrosis, based upon a mechanical wave generated by vibration.11–13 The measurement of the speed of propagation of the wave across the hepatic parenchyma provides an estimate of the liver elasticity, which in turn is a surrogate marker of liver fibrosis.11–13
In preliminary studies, TE showed greatest accuracy in identifying patients with CLD accompanied by marked fibrosis or cirrhosis,13–21 but the studies did not provide hard data on the reproducibility of the test, which is an important prerequisite for the widespread application of TE in clinical practice. The three studies reporting on TE reproducibility were, in fact, all underpowered in terms of sample size of the cohorts, distribution of the aetiology of the disease, and analysis of host and disease-related covariates that may interfere with TE performance.13,17,18 The present study aimed to assess the intraobserver and interobserver agreement of TE in a large cohort of consecutively recruited patients with CLD of varying aetiology, and to evaluate the effects on TE reproducibility of patient and liver disease-related covariates.
PATIENTS AND METHODS
Patients
Between October 2005 and February 2006, all consecutive patients who underwent a liver biopsy for diagnostic or therapeutic purposes at the A.M. & A. Migliavacca Center for Liver Disease also underwent two TE examinations (Fibroscan; Echosens, Paris, France). Inclusion criteria were either of serum alanine aminotransferase (ALT) levels >1.5 the upper normal limit, either persistently or intermittently, in the presence of serum markers of infection with hepatitis B or C virus (HBV, HCV), or a suspected diagnosis of alcoholic hepatitis or non-alcoholic steatohepatitis (NASH), or cholestatic autoimmune diseases. Patients with ascites were excluded from the study. Patients fulfilling these criteria were enrolled after obtaining their written informed consent. The study protocol was approved by the ethics committee of our institute.
Transient elastography
The procedures were performed by two independent investigators (MF and CR) who were blinded to the clinical, serological and histological data. The right lobe of the liver was accessed through an intercostal space while the patient was lying in the dorsal decubitus position with the right arm in maximum abduction. Using the Fibroscan ultrasonography (US) guide, a portion of liver of at least 60 mm thickness, free of large vessels, was identified for examination. The rate of successful measurement was calculated as the ratio between the numbers of validated to total measurements. The results were expressed as a median value of the total measurements in kPa. Only examinations with at least 10 validated measurements and a success rate of at least 65% were considered reliable. The cut-off point of >65% for the success rat, which is higher than that reported by previous studies.14–16,20,21, was chosen to maximise the consistency of the results for TE reproducibility. In addition, the median value of successful measurements was considered as representative of the liver stiffness in a given patient only if the interquartile range (IQR) of all validated measurements was <30% of median values. TE was performed twice by each investigator, who repeated the examination on two separate days. The first examination was carried out on the day that liver biopsy was performed, and the second TE examination was performed within 3 days of the biopsy procedure. Both investigators had undergone a previous training period in which each had performed at least 50 TE measurements. The analysis of TE reproducibility (in terms of both interobserver and intraobserver agreement) was based on the results of the four TE examinations (two performed by each rater). Subsequently, only the first TE determination (independently of the rater performing the examination) was used to assess both the diagnostic accuracy of the technique and to identify the diagnostic cut-off values that best discriminate each level of fibrosis.
Ultrasound-assisted liver biopsy
Before the liver biopsy procedure (and in all cases in the previous 2 weeks), patients had undergone a standard US scan of the abdomen using standard equipment (iU22; Philips, Bothell, Washingon, USA) with a detailed study of the liver, spleen and main vessels. Liver biopsy was performed by experienced hepatologists with a 16G Menghini needle (Biomol; Hospital Service, Rome, Italy) under US guidance. The liver tissue was fixed in formalin and embedded in paraffin was. Sections of liver tissue, 5 μm thick, were stained with H&E and Masson trichrome, and were examined by an expert liver pathologist (MFD), who was blinded to the results of liver stiffness measurement and to the clinical data. Only samples with a length >15 mm and including at least 12 complete portal tracts were considered adequate. Liver fibrosis and necroinflammatory activity were semiquantitatively evaluated by the METAVIR scoring system.22,23 Fibrosis (F) was staged on a four-point scale according to METAVIR (F0, no fibrosis; F1, portal fibrosis without septa; F2, portal fibrosis and few septa; F3, numerous septa without cirrhosis; F4, cirrhosis). Necroinflammatory activity (A) was also graded on a four-point scale (A0, none; A1, mild; A2, moderate; A3, severe). The length of each liver specimen (in millimetres) and the number of fragments were recorded.
Steatosis in liver specimen was arbitrarily graded from 0 to 3 (0, <5%; 1, 5–24%; 2, 25–49%; 3, ⩾50% of fatty hepatocytes). The degree of steatosis on US scans was determined using the decrease in the echo amplitude (e.g. degree of posterior beam attenuation caused by the high reflectivity of the fatty tissue), which shows attenuation in the posterior segments of the liver (grade 1), a loss of echoes from the diaphragm (grade 2) or a loss of echoes from the walls of the portal vein (grade 3).24,25
Other measurements
Serum ALT, aspartate aminostransferase (AST) and gammaglutamiltransferase (GGTP) levels were measured by an automatic system at 37°C (normal values for ALT and AST ⩽40 IU/L, for GGTP ⩽50 IU/L). Commercially available enzyme immunoassays were used to determine serum hepatitis B surface antigen, antibodies to hepatitis B core antigen and anti-HCV. Serum HCV RNA was detected by nested reverse transcription (RT)-PCR using primers to the 5′ non-coding region. The minimum detectable level was approximately 20 IU/mL, using a panel of infected sera calibrated to the World Health Organization International Standard. The diagnosis of alcoholic hepatitis was based on the consumption of >30 g ethanol per day in women and 50 g ethanol per day in men.26 The diagnosis of NASH was based on internationally agreed criteria.27
Statistical analysis
The correlation between TE results and such histological features as fibrosis stage (F) and necroinflammatory activity (A), was analysed by Spearman’s rank correlation coefficient (ρ). TE results (kPa) were given as median values. Intraobserver and interobserver agreement was analysed using the intraclass correlation coefficient (ICC).28 As TE results are a continuous response variable, inter-rater and intrarater agreement between two or more raters was adequately measured by ICC. Using analysis of variance, ICC measures the TE variability rates attributable to the patients. ICC values range from +1 (100% agreement; all the variability being due to patient characteristics) to −1 (100% disagreement; all the variability being due to the raters’ performance). An ICC equal to 1 means that all TE variability relates to patient variability (patient effect) and that there is no variability related to the raters (rater effect). As ICC decreases, the rater effect begins to predominate over patient effect. Interrater agreement was calculated as the agreement between the first liver TE measurement of the two observers. Intrarater agreement was calculated as the agreement between the first and the second TE evaluation.
For intraobserver agreement, the rater was treated as a fixed effect(ICC(3,1)); whereas for interobserver agreement, rater was considered as a random effect (ICC(2,1)). Agreement was classified as poor (ICC = 0.00 to 0.20), fair to good (ICC = 0.40 to 0.75) or excellent (ICC >0.75).29
The effect on agreement of body mass index (BMI, kg/m2), degree of liver steatosis (0 vs 1–3, both at US and on liver histology), severity of liver disease expressed as international normalised ratio, ALT, AST and GGT levels, platelet count, aetiology of liver disease, histological activity and fibrosis were also weight assessed. Intrarater agreement over three periods (0–30, 31–60 and 61–120 days of consecutive TE examinations) was also analysed to assess the effect of rater learning. Receiver operating characteristic (ROC) curves were constructed to define the best cut-off points for stiffness to distinguish different stages of liver fibrosis (F⩾2, F⩾3 and F = 4 according to METAVIR).
For descriptive purposes, the Bland-Altman plot,30 reporting for each patient the means of the ratings of the two raters versus the differences of ratings, was also plotted. This plot allows the graphical inspection of interobserver agreement according to the TE values, thus it was used as a graphical tool to evaluate trends of disagreement across mean values of TE. In addition, systematic TE overestimation or underestimation between raters can be appreciated by simple visual inspection of the plot.
The study was conducted and written according to the Standards for Reporting of Diagnostic Accuracy (STARD).32
RESULTS
In total, 200 patients were enrolled; table 1 summarises their demographic, clinical and laboratory characteristics at the time of liver biopsy and TE examination. There were 117 men (58%) and 83 women (42%) with a mean (SD) age of 53 (11) years (range 31–71). The aetiology of CLD was HCV in 155 (78%) patients, HBV in 16 (8%), excess alcohol consumption in 5 (2%), NASH in 13 (7%), and miscellaneous in the remaining 11 (5%).
Main clinical and demographic characteristics of the 195 consecutive patients who underwent both TE and liver biopsy
Overall, 800 TE examinations were performed by the two investigators, each one having performed the examination twice in 200 patients. The overall rate of indeterminate results was 2.4%. Indeterminate results were due to high BMI (>28 kg/m2) in four patients (two men and two women) in whom TE was unreliable because of the high rate of unsuccessful determinations (success rates 45% and 34%, respectively) and to narrow intercostal space in one patient. Mean (SD) duration of TE was 3.8 (2.3) minutes. The mean (SD) liver stiffness value was 10.6 (11.5) kPa (range 2.4 to 75, median 7.5). The mean (SD) number of measurements per patient was 12.0 (3.4) (range 10–44). Success rates ranged from 65 to 100% (mean (SD) 91 (8%)).
The overall interobserver agreement ICC was 0.98 (95% CI 0.977 to 0.987) (fig 1). No significant difference was observed in ICC values for gender, patient age, or aetiology and severity of liver disease. High BMI (⩾25 kg/m2) and steatosis on both liver histology and US (>24% of fatty liver cells) were associated with reduced interobserver ICC (table 2). Low or absent histological stages for hepatic fibrosis were also associated with reduced ICC values (0.60 vs 0.99), compared with patients with marked fibrosis (METAVIR stage F = 0–1 vs F⩾2).
Results of analysis of interobserver agreement

Overall interobserver agreement between rater 1 and 2.
Liver biopsy was successfully performed in all patients, yielding liver specimens of 28.6 (9.8) mm (range 15–55), with 76% of the specimens being >20 mm. Marked fibrosis (F⩾2) was present in 100 cases (50%), and severe fibrosis/cirrhosis (F⩾3) was observed in 53 patients (26%). There were 76 (38%) patients with grade 1 steatosis; 26 (13%) had grade 2 or 3, and 98 (49%) had no steatosis. Figures 2 and 3 show TE stiffness results, stratified according to the histological features of necroinflammatory activity and fibrosis stage. A significant positive correlation was found between TE values and fibrosis stage (ρ = 0.70) and between TE values and necroinflammatory activity (ρ = 0.51).

Boxplot reporting transient elastography (TE) results according to the necroinflammatory activity of the 195 patients who underwent both TE and liver biopsy. The mean is indicated by a plus (+) sign. Bars show the minimum and maximum values, median, and quartiles. The box width is proportional to the sample size of the subgroups.
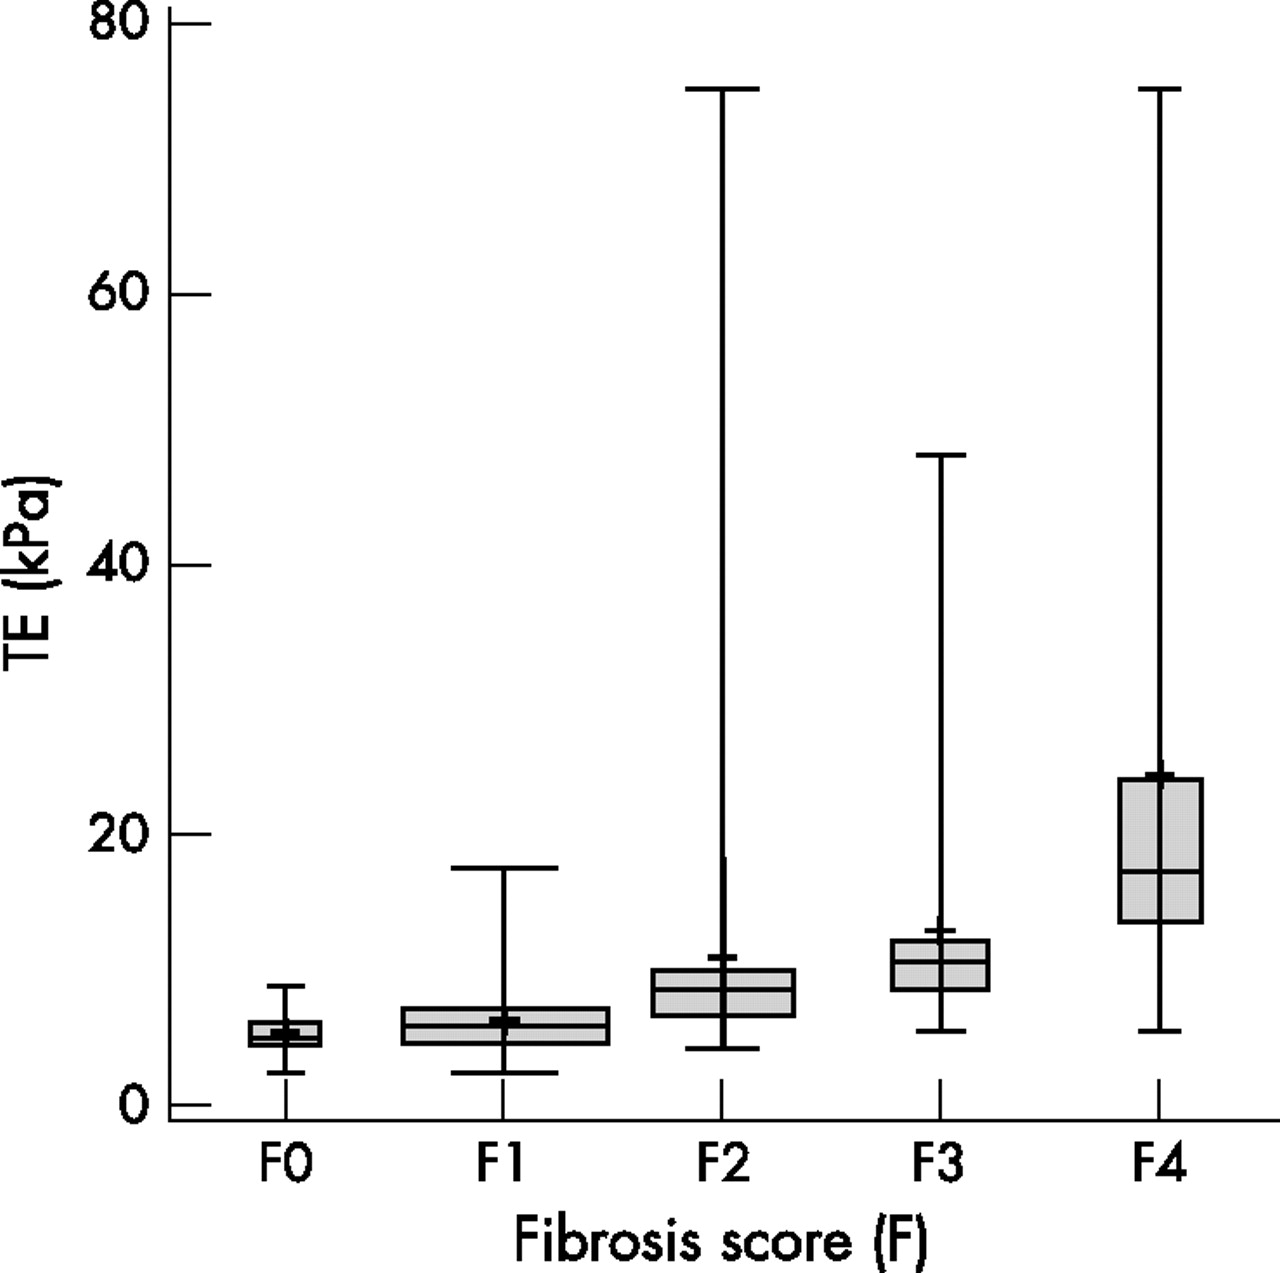
Box plot reporting transient elastography (TE) results according to the fibrosis score (F) of the 195 patients who underwent both TE and liver biopsy. The mean is indicated by the plus (+) sign. Bars indicated the minimum and maximum value, the median and the quartiles. The box width is proportional to the subgroups sample size.
Using ROC curves (fig 4), three threshold values for TE were identified: >7.9 kPa for marked fibrosis (F⩾2; sensitivity 72%, specificity 84%); >10.3 kPa for severe fibrosis (F⩾3; sensitivity 76%, specificity 90%) and >11.9 kPa for cirrhosis (sensitivity 91% and specificity 89%). The corresponding areas under the ROC curve were 0.86 (95% CI 0.81 to 0.89) for F⩾2, 0.87 (0.83 to 0.93) for F⩾3 and 0.90 (0.85 to 0.98) for F = 4. The proportion of concordant TE examinations by the two operators was 88% for stage F⩾2, 92% for F⩾3 and 91% for F = 4.

Receiver operating characteristic (ROC) curves for TE (kPA) for different fibrosis thresholds: (A) marked fibrosis or greater (F⩾2), (B) severe fibrosis or greater (F>3), (C) and cirrhosis (F = 4).
The intraobserver agreement ICC was 0.98 for both raters (fig 5). As raters became more familiar with the procedure, ICC increased to almost absolute values after only 1 month of daily practice (first vs second vs third period: 0.97 vs 0.99 vs 0.99; table 3).
Rating learning effect. Intraclass correlation coefficients (ICC) for raters 1 and 2 for three time points during the study

Intra-observer agreement for rater 1 (left) and rater 2 (right).
Bland-Altman plot (fig 6) showed no systematic overestimation or underestimation between the two raters (mean difference 0.3), without any trend of difference across the mean ratings. Only eight patients scored outside the limits of agreement.

Bland and Altman plot. The solid line represents the mean of the difference of ratings. The dashed lines define the limits of agreement (mean of the difference (2 SD)).
DISCUSSION
This study indicates that TE is both a reliable and a highly reproducible non-invasive method for assessing hepatic fibrosis in patients with CLD, being characterised by very high interobserver and intraobserver agreement overall. However, both constitutional and liver disease-related factors may have a negative effect on the reproducibility of TE, with some consequences on the actual transferability of the technique.
Recently, prospective studies of patients with chronic hepatitis C14,17,18 and CLD with varying aetiology16,20,21 suggested that TE has a good diagnostic accuracy in identifying advanced fibrosis (F3) or cirrhosis (F4), but the assay was less accurate for prediction of moderate liver fibrosis. Indeed, in three large series of patients with CLD,14–16 the ranges of diagnostic accuracy of TE for F2, F3 and F4 were, respectively, 55–67%, 65–85% and 76–87% for sensitivity and 84–90%, 85–95% and 91–97% for specificity.
In our study, three threshold values for TE: >7.9 for marked fibrosis (F⩾2 sensitivity 72%, specificity 84%); >10.3 for severe fibrosis (F⩾3, sensitivity 76%, specificity 90%) and >11.9 for cirrhosis (sensitivity 91% and specificity 89%) were identified. TE showed high degrees of accuracy accompanied by relevant reproducibility and transferability, which are critical factors closely related to both precision and accuracy.
Our findings on reproducibility of TE fill the gap in literature (that is, the lack of evidence of good interobserver and intraobserver agreement of TE in patients with CLD of varying aetiology) and provide information on covariates that may affect the reproducibility of the examination. Previous studies reporting satisfactory reproducibility of TE with a standardised coefficient of variation were all flawed by inadequate sample size and inclusion of few patients with advanced fibrosis. In the study by Sandrin et al,13 intraobserver and interobserver variation in TE was investigated in only 15 patients and found to be around 3%; however, it had wide variation (2–18%). A similarly small study by Saito et al,18 based upon two measurements 3 months apart, reported markedly discordant results in 5 of 15 patients investigated. Finally, in a study of 40 patients with chronic hepatitis C with normal or near-normal serum ALT values, the inter-rater agreement was reported to be excellent (weighted κ = 1.0), but the study power was attenuated by the absence of F4 cases and the presence of only five F3 cases.17 In addition, the fibroscan assay was performed 6 months after the liver biopsy examination, on average. Importantly, the liver specimens included a median of seven portal tracts (range 4–12), which is considered suboptimum for diagnostic accuracy in liver fibrosis.4
By investigating a large series of patients, we were able to show the existence of patients with CLD for whom intraobserver agreement was influenced by variables such as BMI and hepatic steatosis. Although the differences in the interobserver agreement due to fat accumulation were small (0.98–0.94 for BMI and 0.98–0.90 for steatosis), our data suggest that TE should be used cautiously as a surrogate of liver biopsy for assessing liver fibrosis in patients with fat problems. The interaction of fat with low-frequency vibrations of TE may affect the signal to noise ratio—that is, the relevant parameter for assessing liver stiffness. Mild hepatitis fibrosis (F0/F1) was another potential cause of reduced interobserver agreement with TE that led to downgrading from “excellent” to “fair to good” agreement between the two raters in five patients. The exclusion of the five outlier patients led to a substantial increase in ICC, from 0.605 to 0.840. Interestingly, the difference in the agreement between F0/F1 and F >2, although significant (0.98 vs 0.84), was of less magnitude. Because the magnitude of ICCs (which we calculated from an analysis of variance model) is affected by within-patients and between-patients variance, we think that in our study the clinical heterogeneity of the patient population was partly responsible for the high ICCs estimates as suggested by the high between-patients variance of our sample. Anyway, the agreement was still excellent when using a non-parametric approach (data not shown, overall Kendall’s W = 0.9). We think that that variability of TE results is influenced by even slight repositioning of the transducer, and that this is greater for patients with lower grades of liver fibrosis than for patients with higher grades. This may have implications in clinical practice because, unlike the other confounder (steatosis), the degree of liver fibrosis cannot be confidently anticipated by US examination.
In our study, TE was not only highly reproducible, but was also reliable, as shown by the high proportion of concordant results by the two raters for a given histological stage of fibrosis. The proportion of concordant TE examinations was 88% for F⩾2, 92% for F⩾3 and 91% for F4. Interestingly, the low rates (<3%) of indeterminate results were almost exclusively associated with high BMI (>28 kg/m2), thus confirming a recent study in France in which a BMI >28 was the only covariate associated with TE failure (odds ratio = 10).19
Finally, the technique was user-friendly and very precise, as indicated by the excellent intraobserver agreement ICC; the rating learning curve showed absolute intraobserver reproducibility after only 1 month of training with 50 examinations.
One major strength of our study was the high predictability for fibrosis in the liver samples collected by percutaneous biopsy. Indeed, >75% of liver specimens were >20 mm in length, and each sample included >12 portal tracts.4,23 The length of the liver specimen is of paramount importance when comparing the diagnostic performance of a non-invasive test such as TE with liver histology, as the risk of false negative results of histology in the quantification of liver fibrosis is inversely related to the length of the biopsy core specimen.4 The histological reference standard was therefore rather imperfect in previous studies that used small liver cores (<15 mm), due to the high probability of underestimating the stage of liver fibrosis.3 Furthermore, to allow a better comparison with data in the literature, we used the METAVIR scoring system as a standard reference for the assessment of liver fibrosis and comparison with TE results. The concomitant performance of TE and liver biopsy minimised the risk of paradox bias due to disease progression or regression or to treatment response.
We acknowledge that in 18 (9%) patients with a diagnosis of alcoholic hepatitis or NASH, the METAVIR score was not appropriate to assess hepatic fibrosis, as it does not evaluate the particular steatohepatitis feature of pericellular “chicken-wire” fibrosis.31 However, by subgroup analysis, the diagnostic accuracy of METAVIR in patients with alcoholic hepatitis or NASH did not substantially differ from that of the overall group.
We also acknowledge that the study was limited to patients selected for liver biopsy, whose distribution could be skewed towards more severe forms of viral hepatitis, thus leading to a possible selection bias. However, patients with advanced liver fibrosis or cirrhosis made up 27% of our patient population, a figure similar to 14 or even lower than 15,16 those reported by other clinical series undergoing tests with TE.
Another interesting point of the present study is the demonstration that necroinflammatory activity influences TE values. Spearman’s correlation coefficient and TE boxplots, in fact, clearly show a steady increase of TE values in parallel with increased necroinflammatory classes (fig 2). Unfortunately, the necroinflammatory activity of the liver also cannot be anticipated by US examination, a fact that can reduce the diagnostic accuracy of TE in the clinical practice. This is confirmed to some extent by a recent study showing a correlation between serum ALT values and TE results in patients with chronic hepatitis,33 although ALT is a less accurate marker than histology of the necroinflammatory activity of the liver.
In clinical practice, doctors should be aware that interference by necroinflammatory activity and overlap between adjacent stages of hepatic fibrosis may limit the diagnostic accuracy of TE. This is particularly true for the intermediate fibrosis stage, due to the wide range of outliers, which render the technique less accurate for allocation of the correct fibrosis stage to the patient.
Studies have shown that the sequential use of conditionally independent tests (e.g. serum tests combined with ultrasonography) enhances the overall diagnostic accuracy of hepatic fibrosis staging compared with their individual use.34 Consequently, we suggest that the combined use of TE with other diagnostic techniques could improve its overall performance and should be confirmed in further studies.
In conclusion, TE was a highly reproducible and user friendly non-invasive technique, characterised by an excellent interobserver and intraobserver agreement; however, its performance may be altered by high BMI, which affects both the feasibility and reproducibility of the test, and by steatosis and mild liver fibrosis, which affect interobserver agreement.
Acknowledgments
This study was funded in part by a grant from Roche S.P.A., Italy
REFERENCES
Footnotes
-
Published Online First 25 January 2007
-
Competing interests: None to declare
Linked Articles
- Digest