Article Text

Abstract
Objective To examine the effects of different timing of structured interventions for workers on sick leave due to low back pain on return to work (RTW), and the consequences for costs and benefits.
Methods Literature reviews were conducted to identify RTW curves and to estimate treatment effects, costs and benefits of structured interventions among workers on sick leave due to low back pain. RTW curves were mathematically described by Weibull functions and intervention effects, expressed by hazard ratios, were used to adjust these Weibull functions. Subsequently, these functions were used to evaluate the theoretical effects of interventions on reduction in number of days on sick leave and on the benefit–cost ratio.
Results The cost-benefits of a RTW intervention among workers on sick leave due to low back pain were determined by the estimated effectiveness of the intervention, the costs of the intervention, the natural course of RTW in the target population, the timing of the enrolment of subjects into the intervention, and the duration of the intervention.
Conclusion With a good RTW in the first weeks, the only early interventions likely to be cost-beneficial are inexpensive work-focused enhancements to early routine care, such as accommodating workplaces. Structured interventions are unlikely to have an additional impact on the already good prognosis when offered before the optimal time window at approximately 8 to 12 weeks. The generalisibility of the effectiveness of a RTW intervention depends on the comparability of baseline characteristics and RTW curves in target and source populations.
- Return to work
- intervention
- cost-effectiveness
- low back pain
- occupational health practice
- musculoskeletal
- sickness absence
Statistics from Altmetric.com
- Return to work
- intervention
- cost-effectiveness
- low back pain
- occupational health practice
- musculoskeletal
- sickness absence
What this paper adds
There is substantial heterogeneity in the effectiveness of interventions on return to work (RTW) among workers on sick leave due to low back pain.
Theoretical modelling of effects of interventions in different RTW patterns shows that timing of enrolment of workers into the intervention, duration of the intervention, and natural course of RTW are crucial factors.
Generalisibility of the effectiveness of a RTW intervention depends on comparability of baseline characteristics and RTW curves in the target and source populations.
Studies on RTW interventions should report the full RTW curves of the intervention and reference groups to facilitate generalisibility.
Before implementing a particular intervention, one should ensure that the RTW pattern in the target population as well as the nature and timing of the intervention are conducive to success.
Introduction
Low back pain has long been recognised as an important source of morbidity and disability in many occupational populations.1 Low back pain, for most people, is characterised by recurrent episodes of pain and consequent disability, varying in severity and impact.2 3 Most episodes subside uneventfully within days or weeks, with or without medical intervention, although about half of those affected will still experience some pain and functional limitation after 12 months.2 3 Attempts to predict who will fail to recover in a timely manner have had limited success.4–6 It has been argued that prevention and treatment should focus on preventing low back pain becoming chronic and on disability resulting from low back pain rather than on preventing the onset of pain.7 8 In working populations, low back pain may lead to a spell of sickness absence. Although work disability and sickness absence are different entities, sickness absence is increasingly being used as a health parameter of interest when studying the consequences of disability in occupational groups.9 The Clinical Standards Advisory Group in the United Kingdom reported a return to work (RTW) within 2 weeks for 75% of all back pain absence episodes and suggested that approximately 50% of all work days lost due to back pain in the working population are by the 85% of people who are off work for less than 7 days.1 In studies on the duration of compensation claims for lost-time due to back injury, it has been estimated that 40% of all workers will have returned to work within 2 weeks, whereas less than 10% will still be off work at 6 months.7 It is commonly observed that the probability of resuming work diminishes with time on sick leave.10
The RTW pattern over time has important consequences for the appropriate timing of the best window for effective clinical and occupational interventions. Current evidence on vocational rehabilitation indicates that a stepped care approach is required. Simple interventions involving effective coordination and cooperation between primary healthcare and the workplace will be sufficient to help the majority of workers achieve an early RTW. The second step with more expensive, structured interventions is reserved for those who are having difficulties returning.11 In the first step of rapid RTW, which may happen even without specific intervention, the cost-effectiveness of interventions will be difficult to establish,7 10 but, since only existing resources are required, this is of little consequence. In the second step, structured interventions typically have been provided at between 4 weeks and 3 months,12 but there is little evidence on the optimal timing of such interventions for workers on sick leave due to low back pain. It might reasonably be anticipated that the specific combination of the sick leave pattern over time and the effectiveness of the intervention will largely determine the optimum time to structured interventions for workers still off work. The aims of the present paper are to examine the theoretical effects of different timing of structured interventions for workers on sick leave due to low back pain on RTW, and to evaluate the consequences for costs and benefits of these interventions.
Methods
Study approach
The approach taken in this study consists of three steps. In the first step, a review of the literature was conducted to select two RTW curves among workers on sick leave due to low back pain with sufficient contrast in RTW rates to demonstrate the influence of the timing and effectiveness of interventions on RTW. In the second step, intervention studies among workers on sick leave due to low back pain were reviewed for a quantitative characterisation of the effect of the intervention on the RTW rate, expressed in a measure of effect such as hazard ratio (HR) or rate ratio (RR). In addition, the costs and benefits of the interventions selected were retrieved for further analysis. In the third step, the selected RTW curves were fitted to a mathematical function that best described the RTW rate over time. The measures of effect of the interventions, derived from step 2, were incorporated in the mathematical function to calculate the theoretical effects on the RTW rates of different timings for the start of the intervention. These theoretical effects were linked to the costs and benefits of the interventions in order to evaluate their consequences for the cost-benefits of return to work interventions.
Selection of RTW curves
A literature search was carried out in PubMed and Embase (1980–2006), using the following keywords: (MeSH) low back pain, sick leave, worker's compensation (Textword) back-ache, return-to-work, work loss. Studies were included if (i) the study population consisted of workers with low back pain in various occupations, (ii) sickness absence due to back pain among these workers was objectively determined from the first day of sick leave onwards, and (iii) RTW after an episode of sickness absence due to back pain was the outcome measure. Studies were excluded if (i) the study design was a (randomised) controlled trial, since the focus of the analysis was on the natural course of RTW, and (ii) RTW was studied in a specific occupational group not representative of the general workforce. In total, four studies were identified with a suitable RTW curve among workers on sick leave due to low back pain.13–16 The two studies with the largest contrast in RTW rates were selected for further analysis.14 16
Selection of intervention studies
A literature search was carried out in PubMed and Embase (1980–2006). In PubMed the following keywords were used and modified for Embase: (MeSH-terms) low back pain, sick leave, worker's compensation, and randomised controlled trial (RCT). Studies were included if (i) the study design was an RCT, (ii) the study population consisted of workers on sick leave due to low back pain in various occupations, (iii) RTW was an outcome measure, and (iv) as measure of treatment effect a HR or RR was presented in the original article. For the purpose of the current study, a RR was regarded as a good approximation of a HR. When available, costs and benefits of the interventions were also retrieved. In total, 10 RCT studies were identified with a quantitative measure of the intervention effect on RTW among workers on sick leave due to low back pain.17–27 In five of the 10 studies, information on costs and benefits was also available.21 28–31
Modelling approach for intervention effects on RTW curves
Differences in RTW between intervention and reference groups are usually depicted with Kaplan–Meier estimates of the respective probability functions of remaining on sick leave. In the statistical analysis of these survival data, the Cox's proportional hazards regression model has become the established norm.32 The model assumes baseline hazards to vary (unrestrictedly) over time and the HR between intervention group and control group to be constant. In RCTs the effect of an intervention is usually presented as an HR, estimated by a Cox regression analysis with adjustment for important prognostic factors. However, this technique is not a parametric approach since baseline hazards are allowed to vary over time. Thus, HRs across different intervention studies are difficult to compare with respect to expected RTW within a certain period. In addition, it is not possible to estimate the effect of the intervention on RTW outside the observed period of RTW. This may be the case in studies with follow-up too short for all workers to have returned to work.
When data are available on a RTW curve over time, a fully parametric approach may be used to describe the observed RTW curve. A Weibull function can be fitted, characterised by a scale parameter λ and a shape parameter k, which allows the simultaneous description of treatment effects both in terms of HRs and also in terms of the relative increase or decrease in survival time.32 In case of a RTW curve, the latter term may reflect that the RTW rate will decrease with prolonged sick leave. Appendix A presents the mathematical formula for a Weibull function and the description of how the HR will influence the estimated duration of sick leave. The Weibull function was chosen above other parametric models, since it retains the proportional hazard in its formula and, thus, can be adapted to previously published findings.
The Weibull distribution, describing a RTW curve, enables the evaluation of the theoretical cost-benefits of different timings of interventions on workers on sick leave due to low back pain. This evaluation was carried out in four phases. First, the two RTW curves selected in step 1 were fitted to a Weibull model (basic model), with as measure of deviance the lowest overall sum of squares between observed and estimated proportion of workers returned to work at the end of each week. Second, the HR values of RTW interventions identified in the literature review were used to adjust the scale parameter λ in the Weibull model and obtain an intervention Weibull model with a faster RTW (intervention model). The area under the RTW curve (AUC) represents the total volume of days on sick leave and the difference in AUCs between the intervention model and the basic model will give the improvement in sickness absence days due to the intervention. This gain was defined as the reduction in the average number of days on sick leave per worker. In order to investigate the influence of different times of starting the intervention among those workers still on sick leave, intervals of 2 weeks were used to calculate the reduction in sickness absence at each 2-week period of starting the intervention. Third, it is reasonable to assume that some time will elapse between the start of the intervention and its effect on RTW. Hence, two time lags of 2 and 4 weeks, respectively, were introduced, reflecting that the intervention will take some time before having effects (a delayed effect). Fourth, the reported costs and benefits of interventions were linked to the estimated gains in RTW in order to evaluate the consequences of different timings of interventions. For each possible situation, a benefit–cost ratio (BC ratio) was calculated, from a societal perspective, where benefits were the costs saved due to a reduction in sick leave and costs were the expenditures for the intervention, as derived from the selected studies.
Results
Figure 1 depicts the two RTW curves selected from the literature with the strongest contrast. The slowest RTW curve was based on duration of lost-time claims due to a back injury among workers in 1991 in Ontario, Canada.16 The fastest RTW curve was based on compensated absence from work due to non-specific back pain among a random sample of workers granted compensation in 1988 in Quebec, Canada.14 Both RTW curves showed a good fit to a Weibull model, with the slow RTW described by λ=5.4 and k=0.42, and the fast RTW curve by λ=2.1 and k=0.54.

Observed return to work curves after a sickness absence period due to low back pain, as presented in the scientific literature, and fitted curves according to a Weibull distribution.
Table 1 describes the results from 10 RCTs on interventions on RTW. The effects on RTW varied from HR=0.7 to HR=2.4, with five out of 10 studies demonstrating a statistically significant effect of the intervention on RTW. The start of the interventions varied from 10 days to 12 weeks after first day of sick leave, with a focus on 4–8 weeks. The duration of the interventions varied from a single session19 to an intensive graded activity programme with maximum duration of 12 weeks.22 The content of the interventions varied in intensity, with eight structured multimodal interventions with multiple sessions and two interventions with a single visit to a specialist physician.19 27
Assessment of the effects on return to work of interventions on workers on sick leave due to low back pain in randomised controlled trials
Table 2 presents the available information on costs and benefits from five of the 10 studies described in table 1. The interventions costs ranged from €212 to €1614,28 with lower costs for workplace interventions than medical structured interventions.
Costs and benefits of return to work interventions on workers on sick leave due to low back pain, described in randomised controlled trials
Figure 2 presents the theoretical effects on reduction in sickness absence (days per worker enrolled in the intervention) of interventions starting at different elapsed times of sick leave under the assumption of an immediate effect on RTW. The first observation is that the theoretical interventions were much more beneficial in the slow RTW curve than the fast RTW curve. In fact, a very powerful intervention with a HR=2.5 among workers with a fast RTW had less effect on gains in sickness absence days than a considerably less powerful intervention with HR=1.5 among workers with a slow RTW. For the fast RTW curve, the best intervention with HR=2.5 resulted in 1.5–1.7 times higher gains than the modest intervention with HR=1.5. The effects of different starting times of the interventions suggest that the most appropriate time window is somewhere between 6 and 14 weeks. For the slow RTW curve, the differences in gains varied by a factor of 1.7–2 with the optimum time window approximately between 8 and 12 weeks.
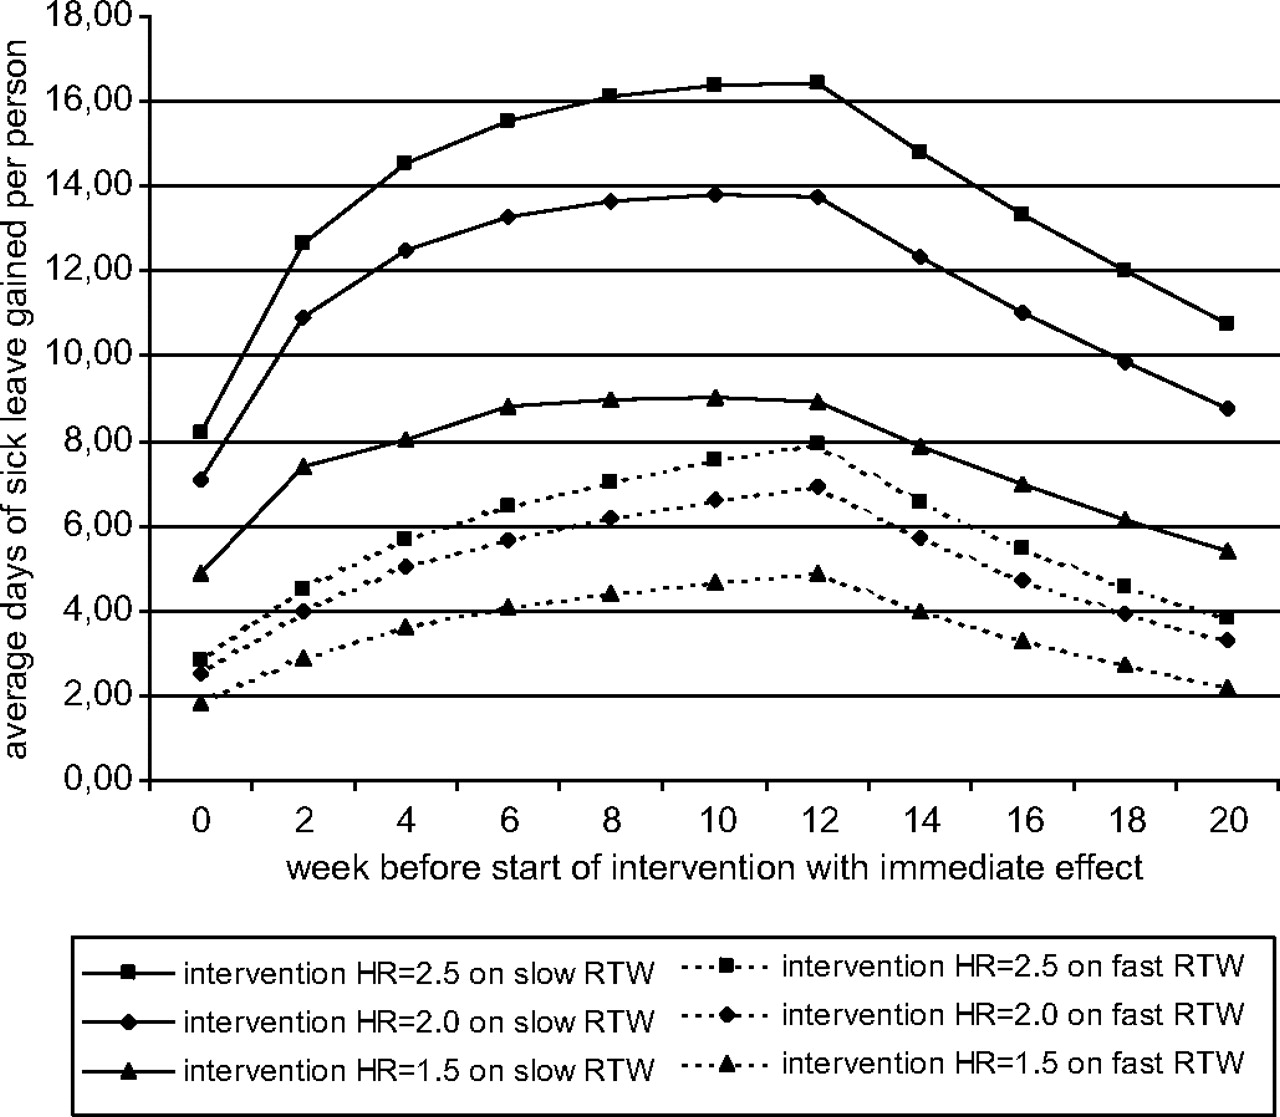
The estimated effects on reduction in sickness absence (days per worker enrolled in the intervention) of interventions starting at different elapsed times of sick leave, with the assumption of an immediate effect on return to work (RTW), stratified by intervention effects and type of RTW curve.
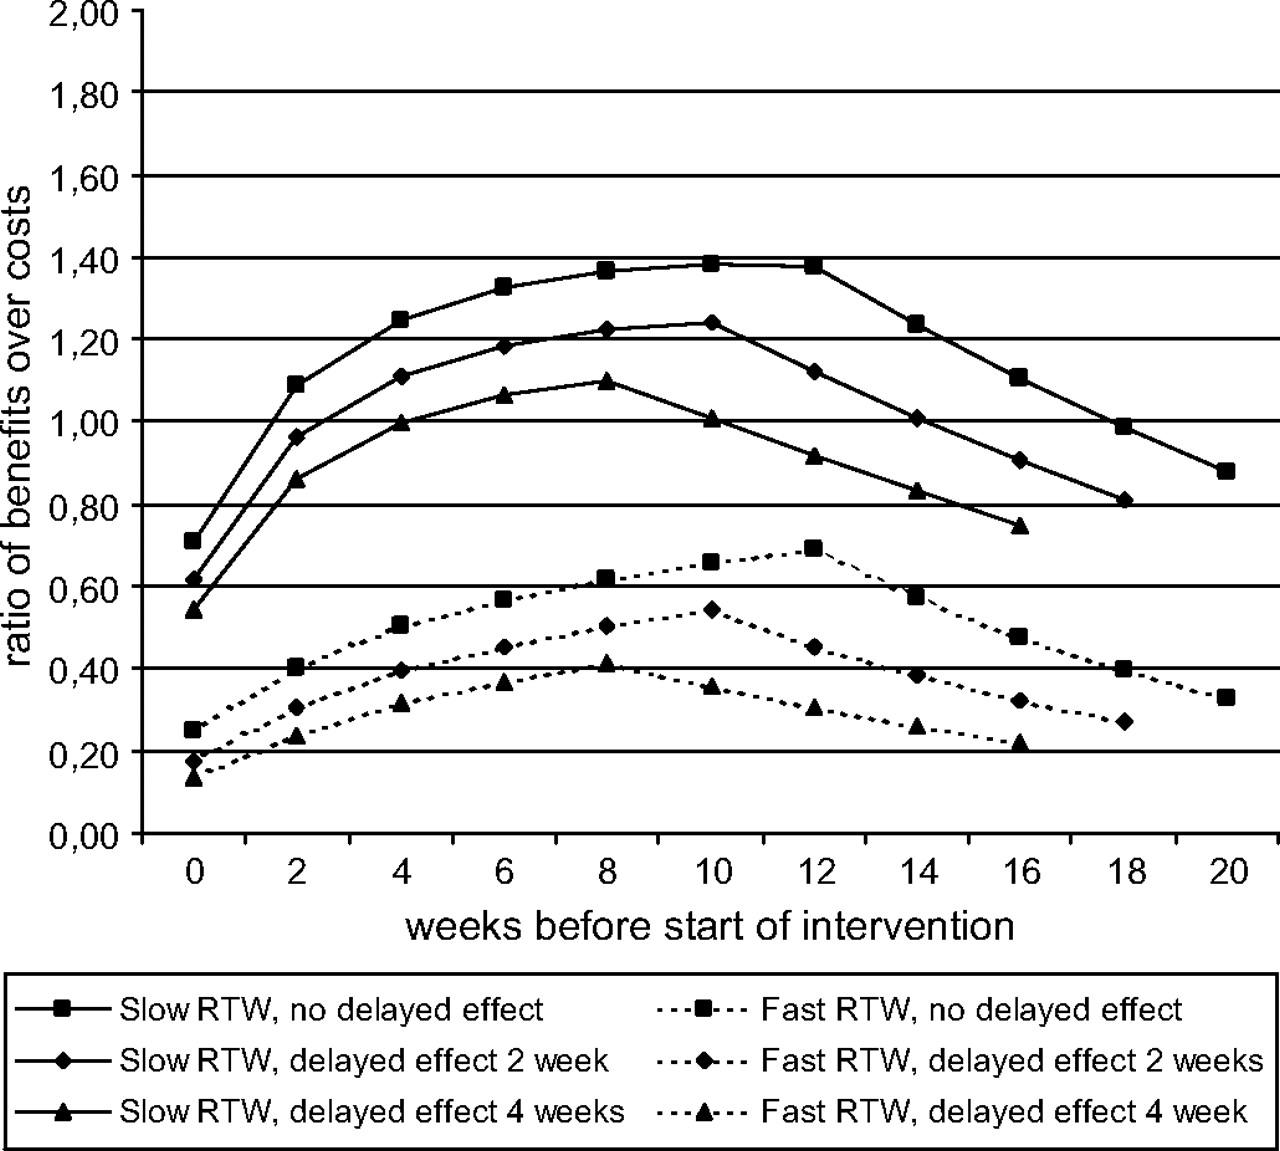
Figure 3 describes the evaluation of the trade-off between benefits and costs, the actual starting time of the intervention, and the assumed delay in time before the intervention will have its effect on RTW. This evaluation assumes an intervention with an effect size of HR=2.0 and overall costs for the intervention of €1000 per worker involved. For all intervention situations with a natural fast RTW curve, the BC ratio was below 1, indicating that the costs exceeded the benefits. When reducing the intervention costs to €500, all situations with a time delay in effect had BC ratios below 1, except for an intervention starting after week 10 and a delay in effect of 2 weeks (BC ratio=1.08). With a slow RTW curve, the assumption on the duration of the delay of effect also had a profound influence on the BC ratio. Without a delayed effect, all starting times after 2–18 weeks for an intervention with HR=2.0 had beneficial BC ratios above 1. However, when introducing a delay in effect of 2 weeks, the appropriate time window reduced to 4–14 weeks and a delay in effect of 4 weeks reduced the time widow to 6–10 weeks. An increase in intervention costs from €1000 to €1500 resulted in all situations in a BC ratio less than 1.
The benefit–cost ratio of an intervention with an overall effect of HR=2.0 and intervention costs of €1000 for a slow and fast RTW curve with time lags of 0, 2 and 4 weeks between the start of the intervention and the start of effects on RTW.
Discussion
This study showed that the cost-benefits of a structured RTW intervention among workers on sick leave will be determined by the effectiveness of the intervention, the natural speed of RTW in the target population, the timing of the enrolment of workers into the intervention, and the costs of the intervention.
Among workers absent due to low back pain, a stepped care approach is attractive from a cost-benefit perspective, since it intends to deliver only what is needed when it is needed for the individual, while permitting allocation of resources to greatest effect at the population level. This begs the question, however, of precisely when which intervention should be taken. The modelling showed that a powerful intervention (HR=2.5) in a target population with a fast RTW was less effective than a less powerful intervention (HR=1.5) in a target population with a slow RTW. The most appropriate time window for a structured intervention was approximately between 8 and 12 weeks. In target populations with a fast RTW rate financial benefits will be difficult to achieve, even for interventions with costs below €500. However, this does not preclude the possibility that cost-neutral work-focused enhancements to early routine care may reduce the number of workers needing structured vocational rehabilitation interventions and, ultimately, contribute to cost savings.11
These conclusions are strongly influenced by three assumptions underlying the modelling approach, most notably the shape of the RTW curves, the magnitude of the structured intervention effect, and the costs and benefits of the intervention. The literature search on RTW curves resulted in four studies of which the two RTW curves with the strongest contrast were chosen as illustrative examples. The fastest RTW curve after a spell of sickness absence due to low back pain showed a RTW of 59% after 2 weeks and 93% after 3 months.14 The slowest RTW curve had a RTW of 43% after 2 weeks and 79% after 3 months.16 The difference between both RTW curves may stem from various sources, such as the definition of RTW and case-criteria of workers with low back pain. The fast RTW curve was based on duration of sickness absence, whereas the often cited three-phase model of Frank and colleagues was derived from length of time on compensation for lost work time. It has been shown that measures of lost work days may be substantially shorter than duration of work disability with wage replacement benefits.33 The population of the fast RTW curve consisted of workers with non-specific low back pain, whereas the slow RTW curve encompassed all cases of low back pain with lost-time claims. There is some evidence that workers who received a specific diagnosis from their physician were much more likely to recover slowly than those with a non-specific initial diagnosis.14 34 Different eligibility criteria, policies and procedures may also have contributed to the differences in RTW curves between both compensation claim systems.
A second important assumption was the magnitude of the intervention effect, quantified by the HR. In 10 intervention studies, the effects on RTW varied from HR=0.7 to HR=2.4, with five out of 10 studies demonstrating a statistically significant effect of the intervention on RTW. No attempt was made to evaluate the influence of differences in target populations, intervention contents and timing of intervention on the observed heterogeneity in effectiveness. When keeping the results from table 1 in mind, with five out of 10 studies reporting a HR of 1.5 or less, assuming an intervention effect with a HR of 1.5 is possibly much closer to present reality than a HR of 2.5. However, this does not imply that considerably higher HRs are unachievable, since none of the interventions described embodied all the vocational principles that have been found essential for securing early RTW.11
The third assumption relates to the costs and benefits retrieved from intervention studies. The intervention costs ranged from €212 to €1614, with three interventions less than €500, three interventions between €500 and €1000, and two interventions exceeding €1000 per worker. The benefit–cost ratio not only depends on the actual costs of the intervention, but also on the monetary value assigned to one lost work day. In the Dutch studies this value was put at about €100 per day, derived from the gross average annual income of a worker according to a national guideline for economic evaluations.35 This value may be larger when the employer's costs associated with this loss of productivity exceed the daily wage, for example, due to damages incurred because of missing an important deadline. On the other hand, compensation mechanisms, such as colleagues taking over work or workers making up for lost work after return to work, may reduce the costs for absence.36 37 It is also important to note that the cost–benefit ratio does not reflect the health effect from the intervention. Thus, a intervention with a poor cost–benefit ratio may have a good cost-effectiveness ratio when the expenditure for the intervention results in a substantial improvement in quality of life.
The fitted Weibull distributions closely resembled the observed fast and slow RTW curves (figure 1), with shape parameters of 0.54 and 0.42, respectively. These shape parameters reflect that fact that the probability of returning to work diminishes with time on sick leave. It has been shown that the power and sample sizes for survival analysis are heavily dependent on the shape parameter of the Weibull distribution.38 Hence, interventions that will reduce the time-dependent deceleration of RTW have a greater potential to be cost-effective. In our modelling approach, the theoretical impact of an intervention could only be evaluated by assuming different scale parameters (related to different HRs observed in published articles) and keeping the shape parameter constant. It is conceivable that the interventions described in table 1 also reduce the decreasing RTW rate over time and have influenced the shape parameter, but this information is unfortunately not available from the scientific literature. In addition, it is also possible that the same intervention introduced earlier or later during sick leave is more or less effective, characterised by a higher or lower HR, but unfortunately the available studies do not allow such inference.
The analysis of the timing for structured interventions suggests that the optimum time window for an effective structured intervention is at approximately between 8 and 12 weeks. The steepness of the RTW curves in the first weeks demonstrates that most workers with low back pain absence will return to work rapidly. With a high RTW in the first weeks, the only early interventions likely to be cost-beneficial are inexpensive work-focused enhancements to early routine care, such as accommodating workplaces.11 Structured interventions are unnecessary at an early stage and are unlikely to have an additional impact on the already good prognosis and, thus, will not be cost-benefical.39 At the same time, interventions initiated too late will suffer from the diminished RTW rate after 12 weeks and the currently available interventions will at best have a low probability of success. At 3 months out of work the obstacles for return to work will be difficult to overcome and more complex, intensive interventions will be required that address social factors in addition to healthcare and workplace interventions.8 11 The conclusions on effective interventions in our approach are based on days of sick leave gained, which differs slightly from the well-known concept of number needed to treat. Frank and colleagues have used this last measure to illustrate that with a constant proportional gain of the intervention over time, the number of workers needed to treat with the intervention in order to achieve an additional person to return to work will reduce over time.7 Their approach differs from our approach, since we have assumed a constant HR rather than a constant proportion.
The conclusions about the cost-benefits of structured interventions were strongly influenced by the natural course of RTW. Figure 2 illustrates that even a highly effective intervention (HR=2.5) in a source population with a naturally slow RTW will become cost-ineffective in a target population with a much faster RTW. It has been noted before that this phenomenon may partly explain the contradictory results of similar intervention programmes in different occupational populations, since differences in RTW curves will greatly influence the overall effect size of the intervention.23 40 For future studies, it is strongly suggested that the potential cost-effectiveness of an apparently effective intervention should be evaluated a priori through comparison of the RTW curves in the source population and the target population. It is also recommended that the full Kaplan–Meier curves of intervention and reference groups in a RCT be reported in order to facilitate such a comparison.
The results from introducing a time delay into the modelling between the start of the intervention and its effect on RTW highlights another pitfall hampering the effectiveness of interventions. Enrolment in an intervention programme for several weeks may obstruct the natural RTW and, hence, introduce a detrimental effect.10 The introduction of a delay in effect of several weeks strongly reduced the appropriate time window for effective interventions and also reduced the likelihood of a cost-beneficial intervention. These findings indicate that the introduction of a structured intervention at weeks 8–12 with a duration of more than 4 weeks should be carefully considered. Moreover, the findings suggest early RTW should be facilitated during the course of the structured intervention, rather than waiting until some notional time point or until the person is free of symptoms.11 40
The modelling approach in this study should not be regarded as providing the ultimate evaluation of the effectiveness of structured interventions on RTW. However, the application of published effects of interventions to Weibull functions of RTW curves enabled us to evaluate a wide range of assumptions in interventions that otherwise are very difficult to appraise. This theoretical exercise also illustrated that the generalisibility of the effectiveness of a RTW intervention across different populations not only depends on comparability of baseline characteristics in the target and source population, but on equal RTW curves as well. Patterns of RTW will be influenced by patient characteristics41 and treatment regimens, as well as by the characteristics of the compensation system, for example, eligibility and generosity of compensation and interference with litigation. Hence, the effectiveness of a RTW intervention cannot be regarded as a fixed trait and great care must be taken in summarising existing evidence into single measures of effectiveness.
In conclusion, this study showed that the cost-benefits of a RTW intervention among workers on sick leave due to low back pain can usefully be modelled, and will be determined by the estimated effectiveness of the intervention, the costs of the intervention, the natural course of RTW in the target population, the timing of the enrolment of subjects into the RTW intervention, and the duration of the intervention. The latter three factors are seldom taken into consideration, although their impact may easily exceed the influence of the classical measures of effectiveness, such as effect size or HR. Before implementing an intervention, it should be verified whether the features of the RTW pattern in the target population as well as the nature and timing of the intervention are conducive to success.
Appendix A Mathematical description of the hazard ratio in a Weibull distribution
The Weibull distribution is characterised by a scale parameter λ, an exponential term, and a shape parameter k, an acceleration term with a relative increase (k larger than 1) or decrease (k smaller than 1) over time, resulting in a survival function S(t)=exp−(t/λ)k with a cumulative hazard H(t)=(t/λ)k, whereby t=survival time. When the acceleration term is constant over time, that is k=1, the Weibull distribution reduces to a straightforward exponential distribution S(t)=exp−(t/λ) and the logarithm of the scale parameter λ will become equal to minus the regression coefficient b (ie, the log of the HR) in a conventional Cox regression model with H(t)=H0(t)*exp(b).
In the Weibull distribution the scale parameter λ is a function of different covariates, expressed by the formula λ=exp(b0+bi*xi), whereby b0 is a constant and bi is the regression coefficient of the effect of covariate xi, for example, the intervention effect. With imputation of this formula in the cumulative hazard of the Weibull function, the cumulative hazard H(t)=(t/exp(b0+bi*xi))k=(exp(−b0)*t)k*exp(−b1*k*xi). The intervention effect is expressed by the term exp(−b1*k*xi), whereby xi takes the value 1 for the intervention group and 0 for the reference group. Thus, the intervention effect in the Weibull function is expressed by exp(−bi*k), which equals the estimated HR of the intervention. Hence, the log HR=−bi*k and with known shape parameter k and known HR of the intervention effect, the regression coefficient bi can be calculated. Subsequently, this regression coefficient is used to calculate the adjusted scale parameter λ for the intervention.
References
Footnotes
Alex Burdorf is the guarantor of the paper. He accepts full responsibility for the work, the conduct of the study, has access to all data, and controls the submission process and decision to publish.
Competing interests None.
Provenance and peer review Not commissioned; not externally peer reviewed.