Article Text

Abstract
Background Ambient air pollution has been consistently associated with exacerbation of respiratory diseases in schoolchildren, but the role of early exposure to traffic-related air pollution in the first occurrence of respiratory symptoms and asthma is not yet clear.
Methods We assessed the association between indexes of exposure to traffic-related air pollution during different periods of life and respiratory outcomes in a birth cohort of 672 newborns (Rome, Italy). Direct interviews of the mother were conducted at birth and at 6, 15 months, 4 and 7 years. Exposure to traffic-related air pollution was assessed for each residential address during the follow-up period using a Land-Use Regression model (LUR) for nitrogen dioxide (NO2) and a Geographic Information System (GIS) variable of proximity to high-traffic roads (HTR) (>10 000vehicles/day). We used age-specific NO2 levels to develop indices of exposure at birth, current, and lifetime time-weighted average. The association of NO2 and traffic proximity with respiratory disorders were evaluated using logistic regression in a longitudinal approach (Generalised Estimating Equation). The exposure indexes were used as continuous and categorical variables (cut-off points based on the 75th percentile for NO2 and the 25th percentile for distance from HTRs).
Results The average NO2 exposure level at birth was 37.2 μg/m3 (SD 7.2, 10–90th range 29.2–46.1). There were no statistical significant associations between the exposure indices and the respiratory outcomes in the longitudinal model. The odds ratios for a 10-µg/m3 increase in time-weighted average NO2 exposure were: asthma incidence OR=1.09; 95 CI% 0.78 to 1.52, wheezing OR=1.07; 95 CI% 0.90 to 1.28, shortness of breath with wheezing OR=1.16; 95 CI% 0.94 to 1.43, cough or phlegm apart from cold OR=1.11; 95 CI% 0.92 to 1.33, and otitis OR=1.08; 95 CI% 0.89 to 1.32. Stronger but not significant associations were found considering the 75th percentile of the NO2 distribution as a cut-off, especially for incidence of asthma and prevalence of wheeze (OR=1.41; 95 CI% 0.88 to 2.28 and OR=1.27; 95 CI% 0.95 to 1.70, respectively); the highest OR was found for wheezing (OR=2.29; 95 CI% 1.15 to 4.56) at the 7-year follow-up. No association was found with distance from HTRs.
Conclusions Exposure to traffic-related air pollution is only weakly associated with respiratory symptoms in young children in the first 7 years of life.
- Exposure assessment < Methodology, speciality
- Pollution < Materials, exposures and occupational groups
- Land Use Regression Model
This is an Open Access article distributed in accordance with the Creative Commons Attribution Non Commercial (CC BY-NC 3.0) license, which permits others to distribute, remix, adapt, build upon this work non-commercially, and license their derivative works on different terms, provided the original work is properly cited and the use is non-commercial. See: http://creativecommons.org/licenses/by-nc/3.0/
Statistics from Altmetric.com
- Exposure assessment < Methodology, speciality
- Pollution < Materials, exposures and occupational groups
- Land Use Regression Model
What this paper adds
-
Respiratory disorders and asthma are common chronic disease in childhood, and air pollution has been consistently shown to exacerbate existing asthma among schoolchildren.
-
The role of exposure to air pollution in the development of childhood asthma and the timing of first occurrence of respiratory symptoms is still debated.
-
We analysed, in a longitudinal way, the effect of pollution on respiratory symptoms in a birth cohort, considering exposure since birth.
-
No clear association was found, and only marginally increased ORs emerged between time-weighted exposure to NO2 and respiratory symptoms during the first 7 years of life. The strength of association seemed to increase with age.
Introduction
Recent epidemiological research has suggested that several diseases in children (ie, asthma, allergies, respiratory infections, neurodevelopmental disorders) may have their origin in prenatal and early postnatal life. Chronic exposures to toxins at this time may have potential lifelong health consequences, especially exposure to air pollution.1–3
Respiratory disorders and asthma are the most common chronic diseases in childhood, and the prevalence of asthma has continuously increased worldwide over the latter part of the 20th century.4 ,5 Although explanations for rapid changes in prevalence are unknown, environmental factors, independently of, and jointly with, genetic factors, are thought to be partly responsible. Air pollution has been consistently shown to exacerbate existing asthma among schoolchildren,6 however it is unclear whether outdoor air pollutants hasten asthma onset.7 The role of exposure to air pollution in the development of childhood asthma and the timing of first occurrence of respiratory symptoms has been controversial.8 ,9 Earlier cross-sectional studies on associations between traffic exposure and asthma and respiratory symptoms in childhood reported associations with proximity to major roads or traffic intensity as a proxy for exposure to air pollutants.10–12 It has been suggested then that living near busy roads leads to adverse respiratory health effects and some cohort studies on children have indicated associations between traffic-related air pollution and doctor's diagnosis of asthma,13 or asthmatic symptoms.14 However, other studies have not shown a relationship between air pollution and asthmatic symptoms, such as a case-control study on infants below 2 years of age,15 and a retrospective cohort of schoolchildren in Oslo.16 Two recent prospective cohort studies,17 ,18 have indicated that a possible relationship might exist but the effect sizes are small and difficult to detect. A recent meta-analysis of 10 European birth cohorts within the ESCAPE project found a clear association between air pollution and respiratory infections, as pneumonia and otitis media.19
Prospective birth cohorts with repeated follow-up represent the best design to properly evaluate the role of these exposures on onset of respiratory diseases in childhood.20 ,21 One of the key issues in air pollution studies is exposure assessment. Recent investigations used modelling approaches with high-resolution estimates of small-scale variations in air pollution. In particular, the land use regression (LUR) model is a widely used instrument to estimate air pollution on a large urban scale. Some investigations using this approach,20–23 have observed increases in respiratory symptoms among children exposed to higher levels of traffic-related air pollution. However, birth cohort studies, even with 8 years of follow-up,23 have considered as relevant the exposure to air pollution at birth, hence not considering potential residential changes during the follow-up and the possible problems of exposure misclassification or measurement error.24
The present work aims to evaluate the effect of exposure to ambient air pollution during the first 7 years of life on the risk of asthma and respiratory symptoms in a birth cohort, using different exposure indices estimated at various follow-up periods.
Material and methods
Study population and follow-up
The Gene and Environment Prospective Study in Italy (GASPII) is a prospective birth cohort study.25 A cohort of newborns was enrolled at delivery in two large obstetric hospitals in Rome from June 2003 to October 2004. Information about population, enrolment and follow-up are summarised in figure 1. Of 1290 eligible women, 704 gave their consent corresponding to 719 newborns (11 sets of twins, 1 of triplets); there was a tendency for participant mothers to be older and of a higher educational level than non-participants. The final enrolled cohort consisted of 708 children, as 10 withdrew the consent soon after enrolment and one died few days after birth. A face-to-face interview was conducted with the mother after delivery to collect baseline information regarding the pregnancy. Information on subsequent health outcomes and additional variables was obtained using questionnaires at 6 months (phone interview), 15 months (phone interview), 4 years, and 7 years (face-to-face interview of mothers) for 694, 664, 581 and 497 children, respectively (figure 1).
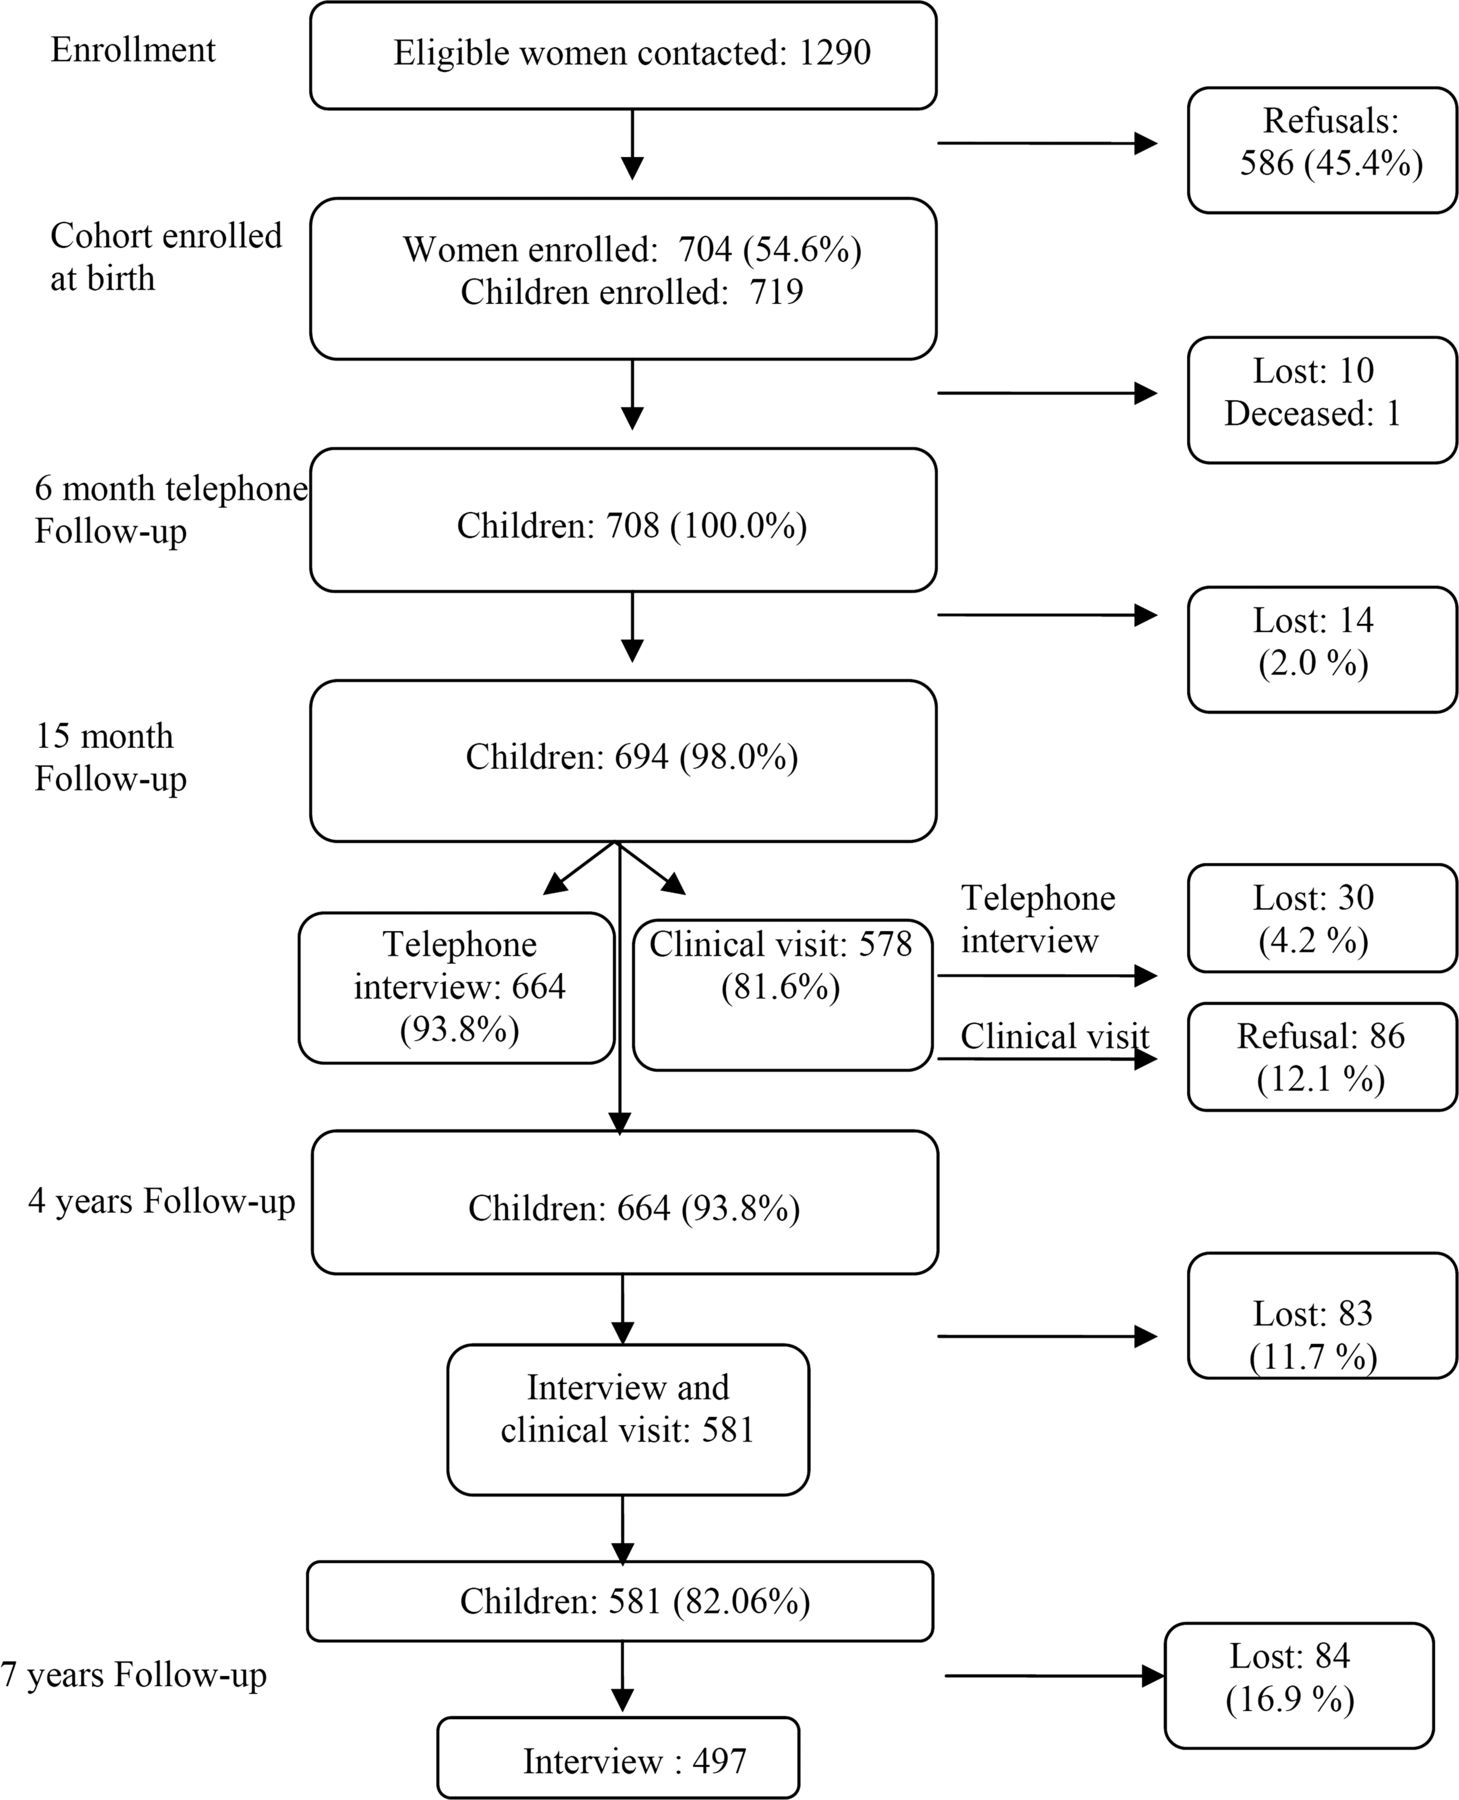
Flow chart of the birth cohort and the subsequent follow-up.
The respiratory questionnaire was adapted from the International Study on Asthma and Allergies in Childhood (ISAAC) questionnaire for school children. We considered the following respiratory outcomes: doctor-diagnosed asthma (at 6 months the term ‘asthmatic bronchitis’ was also accepted), wheezing, shortness of breath with wheezing, cough or phlegm apart from cold, otitis and lower respiratory infections (acute bronchitis, bronchiolitis, pneumonia). The latter two symptoms were not recorded at 7 years follow-up. The reference period for the first follow-up was since birth, whereas the following interviews concerned occurrences since the previous interview.
Exposure assessment
Each participant's exposure to air pollutants was assessed at each follow-up on the basis of the residential address, using geographical information system (GIS) variables as indicated below, and estimated nitrogen dioxide (NO2) concentrations from a LUR model.
We geo-coded each subject's residence (for all follow-up periods) using the Italian road network (TeleAtlas, Italy). Traffic data for all major roads in Rome were provided by the City Council of Rome (year 2005). We defined as high-traffic roads (HTR) all road segments where at least 10 000 vehicles travelled per day.
Air pollution concentrations at the address of each participant in different periods were estimated by land-use regression models, developed for the city of Rome in 200726: three simultaneous one-week measurements of NO2 were taken in 78 locations throughout the city, at different times of year (winter, spring, fall), to calculate annual average concentrations. The average (SD) annual NO2 value at the 78 sites was 44.6 μg/m3 (SD 11.0), and the following variables were the predictors in the multivariate model: altitude, coordinates, distance from the city centre, size of the census block, length of road with more than 10 000 vehicles/day in the 150 m buffer. The model had a coefficient of determination (R2) equal to 0.704, and the root mean squared error was 0.132 μg/m3. NO2 was predicted at the different addresses of each child using the equation from the LUR model.
We also calculated another exposure index based on GIS indicators at each address: the proximity of the residence to the nearest HTR. We collected all geographical variables using ArcGis 9.2. We use the Word Geodetic System 1984 (WGS84) with the Universal Transverse Mercator 33N (UTM33N) as coordinate system and map projection. Other indexes, such as the total length of HTR segments within a 150 m buffer zone, and traffic density within the 150 m buffer were not considered, as they were predictors of the LUR model.
We considered three exposure indexes, based on different exposure time windows: exposure at birth, current exposure (calculated at residence 6 months before the date of interview), and time-weighted average exposure (from conception to 6 months before the date of interview).The first two indexes were defined as annual average NO2 concentration at birth and current address, respectively. To calculate the time-weighted average exposure index to NO2, we weighted each value provided by the LUR for a specific address by the duration of residence (for the residential history, the mother was contacted at 6 months, 15 months, 4 years and 7 years). In this calculation, we obtained a set of time-dependent values representing lifetime average exposure for each follow-up. If the child never moved, the time-weighted value was identical to the estimated value of NO2 from the LUR for that address; otherwise, it took into account the mean exposures at different addresses at each time period.
We excluded children with missing information about pollution levels and/or geocoded address (ie, children who moved outside Rome municipality during follow-up).
Statistical analysis
The correlation between exposure indices was analysed using the Spearman correlation coefficient. The longitudinal associations between air pollution variables and health outcomes at 6 months, 15 months, 4 years and 7 years were analysed using the generalised estimation equations (GEE) approach with a logit link (OR) and stationary correlation structure. The model included interaction terms between exposure and age. Results for continuous NO2 values were presented for 10 μg/m3 increase, whereas for continuous distance to HTR a 100 m increase was used. In evaluating time-weighted average NO2 exposure for the GEE analysis, for each follow-up the exposure was considered only until that specific date, for example, for outcome for follow-up 15 months, only exposure data to month 15 has been considered.
Several potential confounders were considered in the analyses, according to the available literature on respiratory symptoms in children: gender, age, breastfeeding at 3 months, day care attendance, presence of any pets in the home, siblings, maternal and paternal smoking, maternal smoking during pregnancy, maternal and paternal education, presence of moulds or dampness at home, familial asthma or allergies. For the sake of simplicity, we fitted the multiple models considering all potential confounders simultaneously.
We evaluated the association using continuous variables; however, since the size of the study was limited, we also used dichotomous variables with cut-off points based on the 75th percentile of the distribution for NO2 and the 25th percentile for distance from HTR (alternative cut-offs were chosen with similar results). Therefore, we reported continuous variable results (per 10 µg/m3 and per 100 m distance, respectively) and associations for dichotomous variables, defined as below and above the 75th and 25th percentiles. Crude associations were reported in online supplementary appendix table S3.
We considered the robustness of the results regarding various methodological aspects in several sensitivity analyses. In order to test the relevant time-window of exposure possibly related to respiratory symptoms, we compared results obtained with the main exposure index (time-weighted average exposure) with results obtained with exposure at birth and current exposure. We addressed the potential misclassification of the geocoded addresses, as we used a probabilistic approach in the process of geocoding. The main results were compared to an analysis restricted to the perfectly joined addresses. Finally, we considered the potential confounding role of ozone, a known environmental risk factor for asthma. The results of the sensitivity analyses are described below and reported in the online supplementary tables.
Results
During the whole study period we geocoded 96.4% of the total addresses. After excluding children with missing exposure information, and after excluding children from the twins (only one was chosen randomly from the 11 twin couples and the triplets), 672–486 children for each follow-up period were left for the final analysis. During the study period, several children moved; at the last follow-up at 7 years, 323 out of 486 children (66.5%) had not changed their residential address from time of birth.
The characteristics of the 672 children included into the analyses are presented in table 1.
Description of the study population, 672children enrolled at birth
Most participants were born at term from Italian mothers. More than 47% were still breastfed at 3 months, while 13% were exposed to parental smoking at 15 months (12.5% of mothers smoked during pregnancy). A relatively high proportion of parents had a university degree (greater than 30%), and about 10% of parents had a chronic respiratory disease, such as asthma or chronic bronchitis.
Table 2 summarises the prevalence of respiratory symptoms for each follow-up period.
Frequencies of respiratory health outcomes according to the follow-up period
Incidence (new cases during the follow-up) of doctor-diagnosed asthma is also shown. At 6 months, wheezing was present in 18% of the babies but only 3.6% had a diagnosis of asthma or asthmatic bronchitis. The prevalence of respiratory disorders was highest at 15 months (wheezing 29%) but declined thereafter, with the exception of asthma (up to 7% at 7 years) and otitis, (30.5% at 4 years). A clear trend of increased asthma incidence and prevalence was present, as expected.
Online supplementary figure S1 shows the map of Rome with HTRs, the geocoded addressees of the cohort, and the estimated NO2 concentrations. Note that the cohort was resident in the northeast part of Rome due to the location of the recruitment centres. The distribution of the main exposure indices at birth (see online supplementary table S1) indicates a large variability in exposure, with a range of exposure values for NO2 from 15 to 60 μg/m3 (range 10–90th percentile: 29–47).The 75th percentile of NO2 values (at birth) was 42.0 μg/m3, close to the annual limit value defined by EU legislation (40 μg/m3, ‘Directive of the European Parliament and of the Council on ambient air quality and cleaner air for Europe’, 2008). The 25th percentile of distance from HTR was 86.1 m. Online supplementary table S2 provides the descriptive data of the NO2 levels at each follow-up period. The three exposure indexes of NO2 (at birth, current and time-weighted average) were highly correlated (Spearman coefficient >0.85).
Table 3 reports the adjusted results of the overall longitudinal GEE model on the associations between the two exposure indexes (time-weighted NO2 and inverse distance to HTRs) and the respiratory outcomes for all the follow-up period (the crude ORs are reported in online supplementary table S3).
Associations of nitrogen dioxide (time-weighted average, per 10 µg/m3 and 75th percentile cut-off) and distance from high-traffic roads (Dist HTRs, per 100 m and 25th percentile cut-off) with respiratory outcomes evaluated with the generalised estimation equations (GEE) models in the overall follow-up period
No statistical significant association was found in the GEE models. The strongest associations were found with NO2 exposure, whereas null effects were detected with distance from busy roads. A 10 mg/m3 increase in time-weighted average NO2 was positively associated with asthma incidence (OR=1.086; 95 CI% 0.78 to 1.52), wheezing (OR=1.071; 95 CI% 0.90 to 1.28), shortness of breath with wheezing (OR=1.159: 95 CI% 0.94 to 1.43), cough or phlegm apart from cold (OR=1.109; 95 CI% 0.92 to 1.33) and otitis (OR=1.084; 95 CI% 0.89 to 1.32). Similar associations were found with the dichotomous variables with the strongest effect for asthma incidence (OR=1.414; 95 CI% 0.88 to 2.28 for those above the 75th percentile of NO2).
Figure 2 reports the results for each specific age of follow-up. The single estimates tend to be imprecise with large CIs, but an increase in strength of association appears with age, in particular when the dichotomous NO2 variable was considered, with the highest and statistically significant association for wheezing at age seven (OR=2.29; 95 CI% 1.15 to 4.56).

Associations of nitrogen dioxide (time-weighted average, per 10 µg/m3 and 75th percentile cut-off) and distance from high-traffic roads (Dist HTRs, per 100 m and 25th percentile cut-off) with respiratory outcomes, evaluated at each follow-up period with the generalised estimation equations models.
Sensitivity analyses
Online supplementary table S4 reports the results of the analyses for a 10 μg/m3 increase of NO2 when exposure at birth, current exposure and time-weighted exposure were considered. Although we expected slight differences in the effect estimates, due to the relatively small number of movers, higher associations were found for time-weighted exposure for all outcomes, but not for asthma prevalence. Effect estimates for current exposure were closer to the null. When we explored the possibility of misclassification in geocoding considering only the addresses with a perfect score in the probabilistic linkage procedure between each address and a central database (85% of the entire dataset was used for GEE models), the results remained largely unchanged (see online supplementary table S5).
We used a dispersion model map of annual ozone concentrations (year 2005) over a 1 km × 1 km grid of the city of Rome, provided by the Regional Agency of Environmental Protection of the Lazio region. The values of ozone were inversely correlated on the spatial scale with NO2 values (coeff Spearman: −0.336). There was no statistically significant association between ozone at the residential address and respiratory outcomes in the GEE model. Therefore, when ozone was considered as a potential confounder (quartiles) in the model with NO2 and other traffic-related variables, the estimated ORs were substantially unchanged (see online supplementary table S5).
Discussion
We found no statistically significant association between exposure indices and respiratory outcomes in the longitudinal model of our cohort. In the GEE model, the associations between NO2 exposure and all considered outcomes were all weakly positive, with the strongest association for asthma when the cut-off was on the 75th percentile of the exposure distribution. Age-specific analyses suggest that the association might increase with age, especially for wheezing. Our results are comparable with a recent study that shows weak associations between exposure to pollutants and asthma in a large Swedish birth cohort.17 The relative risk of asthma associated with urban air pollution exposure in that cohort increased between 8 and 12 years of age. Another recent work in a Spanish cohort18 reported comparable but not significant associations between exposure to NO2 during pregnancy, and upper and lower respiratory symptoms during the first 12–18 months of life.
The present study had a limited power because only a few hundreds of children were followed although repeated outcome measurements were available. Other cohort studies of newborns have already addressed the issue of the respiratory effects of traffic-related air pollution in small children.13 ,14 GIS variables and the results of LUR were adopted. Three studies on European birth cohorts (in Germany, The Netherlands and Sweden) followed children until the ages of 4 years and 8 years.21 ,23 ,27 The results of these studies have suggested positive associations with respiratory infections, allergic sensitisation, asthma symptoms and physician-diagnosed asthma. While the first two studies21 ,27performed cross-sectional analysis, the work from the Prevention and Incidence of Asthma and Mite Allergy (PIAMA) study23 had an approach based on longitudinal associations between air pollution levels at the birth address (evaluated with data from an LUR model) and health outcomes, recorded by yearly questionnaires in the first 8 years of life. Possible moves during this period were accounted for with an interaction term between air pollution levels and moving status. Results from the GEE model provided evidence for a positive association between traffic air pollution and asthma incidence in children, with relative risks in the order of 1.2–1.3. When all the evidence is taken together, including the results of the present study, it seems clear that an association is present but the effect size is small.
The LUR model provides estimated NO2 concentrations in our study as in many other investigations. Nitrogen dioxide has been directly related to respiratory infections in experimental studies, but its role remains controversial in general population studies of children. A study on three birth cohorts in Spain and the UK measured indoor NO2 at home during the first year of life for 1161 children28 and found that cumulative rates of lower respiratory tract infections were unrelated to NO2 exposure. Authors suggested that the effects observed in studies on outdoor air are possibly due to copollutants other than NO2. In our studies, as in other studies, NO2 may be considered a good marker of traffic air pollution exposure, whereas it is unclear whether it has a specific direct role.
The LUR model is widely used to assign exposure to populations living in urban areas. The main advantages of this model are the capability to capture small-scale variability in pollution, as well as a less expensive implementation with respect to other models, such as dispersion models. A limitation of the LUR models is their absence of temporal variations and information about their temporal validity. Some studies evaluated this aspect considering temporal LUR models.29 Recently, temporally adjusted LUR model was used in a birth cohort study in Spain, but the study did not find significant associations using this adjustment.18 For exposure assessment in Rome, two LUR models have been performed, the one used here in 2007 and an older one in 1995–1996. A comparison of the results from the two models26 showed a substantial stability in exposure assessment over a period of many years (correlation of the measurements at the same locations=0.79).
Time-weighted exposure was considered as main exposure index in a study on air pollution and allergic sensitisation in the Children, Allergy, Milieu, Stockholm, Epidemiological Survey (BAMSE) Swedish birth cohort.30 The authors found high correlation between time-weighted average lifetime air pollution exposure at residential addresses and total exposure estimates also including day-care and school addresses, and thus, very similar associations with health outcomes.
We have used a time-weighted exposure index using information from only one LUR model, so the temporal aspects of the exposure have not been evaluated. On the other hand, we considered exposure during early life as well as possible residence changes during lifetime. This method should be considered more accurate than the one that uses only at birth or current exposure. In our study, the differences between exposure at birth and time-weighted exposure over the first 7 years of life were small, due to small percentage of movers. The suggestion, however, is to apply this approach to birth cohorts, because the differences are likely to increase over time. The results of our sensitivity analysis indicate that in case of small number of movers exposure at birth and time-weighted average are more related to asthma and respiratory symptoms than current exposure.
In conclusion, the present study did not find a clear link between exposure to traffic-related air pollution and respiratory disorders in children during their first 7 years of life. Only weak associations emerged that seem to increase with age. The results are consistent with previous work in the field and deserve additional follow-up.
Acknowledgments
The present work is a dissertation project by Andrea Ranzi for the Master's Program in Epidemiology at the University of Turin, Italy. We are grateful to Rossella Miglio, Benedetto Terracini and Claudia Galassi for their critical reading and useful comments. All the efforts related to the enrolment and follow-up of the birth cohort has been done from the Department of Epidemiology in Rome, and we acknowledge the following for the field work: Laura Ancona, Paola Calabrese, EleonoraD'Armini, Monica Ferri, Sabella Festa Campanile, Barbara Lazazzera, Paola Lorusso, Sara Protasi and Valentina Ziroli.
References
Supplementary materials
Supplementary Data
This web only file has been produced by the BMJ Publishing Group from an electronic file supplied by the author(s) and has not been edited for content.
Files in this Data Supplement:
- Data supplement 1 - Online supplement
- Data supplement 2 - Online figure
Footnotes
-
Contributors AR, DP and FF took part in the design of the study and interpretation of data. AR performed statistical analysis, DP collected information about children for each follow-up. GC and CB provided GIS information for exposure assessment. AR, DP and FF drafted the manuscript. MD and PL performed a critical revision of the manuscript and offered precious technical advice on how the study might be improved. All authors read and approved the final manuscript.
-
Competing interests None.
-
Ethics approval Ethic Committee of Catholic University of Rome, Italy.
-
Provenance and peer review Not commissioned; externally peer reviewed.