Article Text

Abstract
Aims: To investigate mortality from lung cancer in nickel-cadmium battery workers in relation to cumulative exposure to cadmium hydroxide.
Methods: The mortality of a cohort of 926 male workers from a factory engaged in the manufacture of nickel-cadmium batteries in the West Midlands of England was investigated for the period 1947–2000. All subjects were first employed at the plant in the period 1947–75 and employed for a minimum period of 12 months. Work histories were available for the period 1947–86; the factory closed down in 1992. Two analytical approaches were used, indirect standardisation and Poisson regression.
Results: Based on serial mortality rates for the general population of England and Wales, significantly increased mortality was shown for cancers of the pharynx (observed (Obs) 4, expected (Exp) 0.7, standardised mortality ratio (SMR) 559, p<0.05), non-malignant diseases of the respiratory system (Obs 61, Exp 43.0, SMR 142, p<0.05), and non-malignant diseases of the genitourinary system (Obs 10, Exp 4.1, SMR 243, p<0.05). Non-significantly increased SMRs were shown for lung cancer (Obs 45, Exp 40.7, SMR 111) and cancer of the prostate (Obs 9, Exp 7.5, SMR 116). Estimated cumulative cadmium exposures were not related to risks of lung cancer or risks of chronic obstructive pulmonary diseases, even when exposure histories were lagged first by 10, then by 20 years.
Conclusions: The study findings do not support the hypotheses that cadmium compounds are human lung carcinogens.
- cadmium
- lung cancer
- cohort study
Statistics from Altmetric.com
In 1993, a Working Group of the International Agency for Research on Cancer (IARC) concluded that there was sufficient evidence in humans for the carcinogenicity of cadmium and cadmium compounds.1 Twenty reports relating to seven cohort studies of cadmium workers were available for this evaluation. Only in the cohort study of US cadmium recovery workers had quantitative estimates of cadmium exposure been incorporated into the epidemiological analyses.2–4 Clearly, the statistically significant positive associations between lung cancer risks and cumulative exposure to cadmium reported in two analyses of this cohort2,3 carried out under the auspices of the US National Institute for Occupational Safety and Health (NIOSH) were key findings in the IARC evaluation.1
Since the IARC report, deficiencies in the work history data abstracted by the NIOSH researchers have been highlighted,5 and an analysis incorporating newly abstracted detailed work histories indicated that the lung cancer excess in the cohort was consistent with a number of different hypotheses, including cadmium compounds or arsenic compounds being the carcinogenic agents.6 In addition, quantitative estimates of cadmium exposure have now been incorporated into updated findings for two of the remaining six occupational cohorts.7,8 In neither the cohort of UK copper-cadmium alloy workers nor the study of Swedish nickel-cadmium battery workers was there any indication of lung cancer risks increasing with increasing cumulative exposure to cadmium.7,8 Jarup et al summarised the current position on lung cancer risks in relation to cadmium exposure as “the evidence is weakening”.8 The current report incorporates quantitative cadmium exposure estimates into updated follow up data from the UK study of nickel-cadmium battery workers9 to assist with any re-evaluations of the carcinogenicity of cadmium and cadmium compounds.
MATERIALS AND METHODS
Factory processes
Factory processes have been described in detail elsewhere.10,11 The batteries comprised positive (nickel) and negative (cadmium) electrical plates immersed in an electrolytic solution of potassium hydroxide. Both plates had a framework of mild steel, made up of nickel plated perforated steel strips (pockets), which contained the active materials (positive plates: mainly nickel hydroxide, cobalt, graphite; negative plates: mainly cadmium hydroxide, iron oxide).
In earlier years, the nickel hydroxide was prepared by dissolving nickel powder in sulphuric acid, the resulting sulphate being neutralised and precipitated as the hydroxide; the latter was then mixed with cobalt and graphite. The first step in this process was eliminated in 1973 with the buying-in of the sulphate. Originally, the production of negative active material was an electrolytic process in which cadmium and iron oxides were both deposited onto the cathodes of steam-heated baths. Removing these deposits was a hot, wet, and dirty job. A new process was introduced in 1976; bought-in cadmium oxide was hydrolysed in an enclosed process. Subsequent drying and fragmentation of the hydroxide was still a source of worker exposure.
Platemaking involved the largest single group of workers and technical aspects changed little over the years, apart from improvements in dust control. Metal strips were filled with positive or negative active materials; the filled strips were cut to length and welded or pressed into positive or negative plates. Plates of alternated polarity were then bolted into “groups” in the assembly shop. The electrical potential of the grouped plates was activated in the formation shop by an electrolytic process; the grouped plates were then returned to the assembly shop and placed into steel or plastic cases. The manufacturing process was completed in the charge shop; potassium hydroxide was added and the batteries were charged. Labelling and marking were carried out in final assembly and despatch stores.
Environmental monitoring and dust control
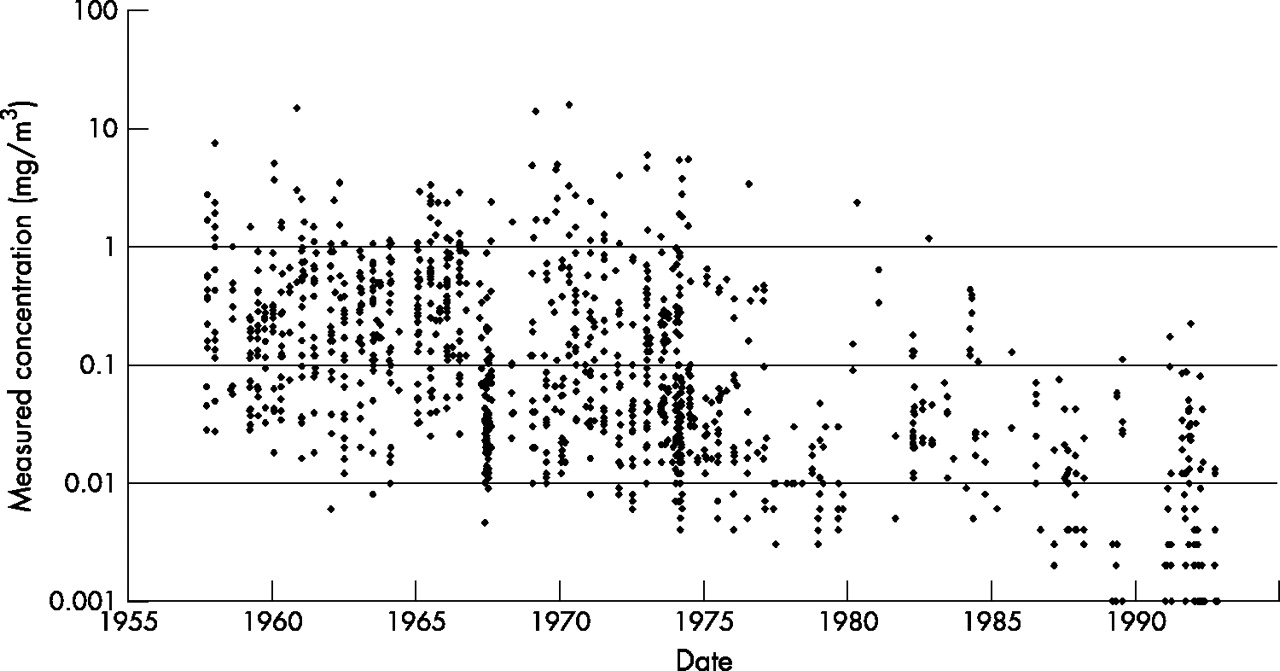
Systematic static sampling was started in 1957 with twice yearly sampling from 19 sites selected to monitor problem areas. In 1969, a new selection of 26 sampling sites was chosen. Mean values by department and time period (with number of available samples) are shown in table 1 and the distribution of measured concentrations is shown in fig 1.
Generation of job exposure matrix

Measured cadmium concentrations (static samples), 1957–92.
Personal sampling began in a tentative manner in 1964 and was more formally established as routine monitoring in 1965. Almost all (98%) of the 2439 personal measurements were made on workers in the platemaking, assembly, and negative active material departments; mean values (with number of available samples) are also shown for successive time periods in table 1 and the distribution of measured concentrations is shown in fig 2. These measures of inhalable dust were collected by Casella samplers with the one- or (later) seven-hole (UKAEA) 25 mm diameter filter holder, sampling at 2 l/min for about two hours (median duration of sampling 115 min; <60 min, n = 183; 90–119 min, n = 1023; 120–149 min, n = 640; 150–179 min, n = 93; ⩾180 min, n = 202). Maintenance personnel were not sampled and platemakers were sampled when they were working with negative plates. A further group of 20 contaminated samples was excluded.

Measured cadmium concentrations (personal samples), 1965–92.
Retrospective exposure assessment
In many occupational epidemiological studies, exposure measurements are not uniformly distributed over the study period. In most cases, in the earlier years of a study, exposure measurements are either totally absent or consist of measurements that are not readily suitable for exposure estimation. In this respect, this study was typical with more than 80% of the personal samples relating to the second half of the study period (see table 1). The static samples were more evenly distributed with 682 samples in the period 1957–73 and 450 samples in the period 1974–92. In most studies, the early years are usually associated with higher level of exposures, and a significant portion of the high exposure values may have to be determined by methods that rely on conjectured or projected relations between work and exposure. Such methods may compromise the interpretation of the epidemiological results by introducing misclassification errors.
The retrospective exposure assessment methods used in this study depended solely on the availability of measured exposure values with an important enabling assumption that the processes and exposures did not change substantially prior to the first available personal exposure measurements. This is a reasonable assumption for two reasons: there were no noted major operational improvements or changes prior to 1965 and the static samples for the earlier years did not show any improvement or deterioration in the measured cadmium levels (see fig 1). For the 1957–65 static samples, the correlation coefficient between year and measured concentration was only 0.064. Static samples are, however, rarely, if ever, an acceptable surrogate for personal exposures and the inclusion of static sample results into the final job-exposure matrix would have introduced significant errors to exposure assessment.12 The lack of a time trend in the earlier static sample measurements suggests that there may well have been constancy in personal exposures prior to 1966, enabling the extrapolation of personal sample results to earlier years.
The internal consistency of the personal exposure measurements was investigated by comparing short duration samples with longer duration samples. For most job categories the short duration samples were significantly higher than the long term samples; we decided not to use the 183 samples with durations less than 60 minutes as these were judged unlikely to reflect eight-hour time weighted average exposure (TWA). In addition, the exposure measurements for a given job class, normalised over a time trend, were investigated for multi-modality. Only a few such cases were discovered and these were at least visually close to unimodal lognormal distributions. The job classifications could, therefore, be considered to be uniform; these observations also verified indirectly that “multi-tasking” was not, in general, practiced at the factory.
A simple least squares fit was used to model the time trend for personal exposures in each of the main departments for the period 1965–92 (the period for which personal samples were available), such that:

where:
E = exposure level (mg/m3)
T = year
C0 = critical exposure (modelled exposure in 1965)
β = decay constant
The critical concentration values, the decay coefficients, and the fraction of the variance explained by the model are summarised in table 2. The decay coefficients and the correlation values are remarkably similar for the major job categories, suggesting that occupational hygiene initiatives and exposure control measures were generalised throughout the workplace. There is a large scatter leading to calculated R2 values between 0.4 and 0.6. However, this amount of scatter is not surprising given that the measurements were obtained from the results of happenstance sampling conducted for purposes other than epidemiological analyses, and the correlation between observed and fitted values is acceptable. The time decay constants are stable. While this might suggest that a pooling of data could be justified and a generalised exposure concentration adjustment for the entire data set could be determined, this was not done for two reasons. Firstly, the averaging required to obtain a single decay constant would necessarily present problems in pooling and normalising the whole data set. Secondly, there might be good reasons for the different decay constants for departmental exposures based either on the relative ease of introducing a given control method in each department or on a different process change schedule being adopted for each operation.
Coefficients for model parameters following statistical modelling
After the calculation of exposure concentration for each department and year, the values were rounded to two significant figures. Examples of the exposure values generated by this process are also shown in table 1. Modelled exposure estimates for 1965 were used for all earlier years. Some of these exposure values incorporate further adjustments to take into account the use of respirators and to derive exposure estimates for maintenance and inspection. The compulsory use of respirators was introduced in 1969 for cadmium casting and recovery workers and in 1989 for negative active material workers. A US study of the protection offered to cadmium workers from the use of filter cartridge respirators found that inhalation exposure was 26% of lapel exposure and this factor has been assumed to apply here.14 It has also been assumed that maintenance and inspection workers spent 25% of their time in platemaking, 10% in assembly, and 5% in negative active material, and that while in these areas, they received 50% of the exposure received by workers from these departments (on the basis that they were not working as closely to the source of the exposure). Finally, individual work histories were cross referenced with the calculated annual departmental exposure concentrations to provide individual cumulative cadmium exposures as a time dependent variable.
The choice between generating many cumulative exposure classes with commensurately many assumptions or generating a few broad exposure classes with as few assumptions as possible was decided in favour of the latter; this being more conservative with respect to potential exposure misclassification errors. The results shown in table 1 suggest that the exposures fall into three classes separated (more or less) by an order of magnitude and the cumulative exposures can be classified by a factor of four separating the exposure class boundaries. It has been shown that the determination of exposure class boundaries is important in the reduction of misclassification errors.13 The exposure measurement data analysed for within and between worker variance as separated by identified tasks showed that the maximum between worker variance was less than 1.25. The conservative assumption of a doubling of the estimated between worker variance due to the uncertainty introduced by estimated respirator efficiency, assumptions made on workers who were not sampled and the estimation of time spent in various undefined tasks suggested that the between worker geometric standard deviation is less than 2.5. This number, in conjunction with the cumulated exposures classified as <400, 400–1599, 1600–4799, and ⩾4800 μg/m3/y resulted in a calculated misclassification rate of less than 10%.
Cohort particulars and follow up data
The cohort under study has been redefined for the purpose of this report and now comprises the 926 male workers first employed in the factory environment in the period 1947–75; all study subjects had a minimum of 12 months employment at the factory.
The Office for National Statistics (ONS) provided information on the vital status of each study subject up to the closing date of the survey (31 December 2000): 457 subjects were alive, 26 subjects had emigrated, 4 subjects were untraced, and 439 subjects were deceased. For all deaths, the underlying cause was provided by the ONS, coded to the 8th or 9th revisions of the International Classification of Disease (ICD). Information was also computerised for those deaths for which lung cancer (ICD-8 162, ICD-9 162) or a chronic obstructive pulmonary disease (ICD-8 490–493, ICD-9 490–496; mainly chronic bronchitis, emphysema, asthma, chronic airways obstruction) was mentioned on the death certificate, but not selected as the underlying cause. Vital status as recorded in the study computer file was double checked with computerised information at the ONS.
Work histories had been abstracted from factory personnel records for the period 1947–86 and in terms of 52 different jobs/departments. Some workers changed job/department at the factory and a total of 1701 work entries were abstracted. The number of entries is shown under each of the 52 job/department headings in table 3. The table also shows how these work headings were classified under the six department headings used in the job-exposure matrix (see table 1). Numbers of study subjects are shown separately by year of hire and by year of leaving employment in table 4. The factory closed down in 1992; work histories were not available for the period 1987–92 and any exposures received in this period were not considered in the later analyses.
Departments used in job exposure matrix in relation to jobs/departments in employment records
Study cohort by year of hire and by year of leaving employment
External standard
Expected numbers of deaths were calculated by applying sex, age, and period specific mortality rates for England and Wales to corresponding person-years-at-risk (PYR). Each study subject contributed PYR from the end of the minimum employment period to the closing date of the study (31 December 2000), death, emigration, or date last known alive, whichever was the earliest. Standardised mortality ratios (SMRs) were calculated as the ratio of observed deaths to expected deaths, expressed as a percentage. These procedures were carried out using the PERSONYEARS programme.15 Data were censored at age 85 years for reasons described previously.16
Internal standard
For the internal analyses, lung cancers and chronic obstructive pulmonary diseases mentioned in any part of the death certificate were selected, thereby introducing two additional malignant cases and 27 additional non-malignant cases unavailable to the underlying cause analyses. A number of variables were considered to have the potential for influencing mortality within the cohort: attained age, calendar period, employment status (still employed/left employment), year of hire, and cumulative exposure to cadmium. Each variable was categorised into a number of levels (see table 5). The models were constructed such that there was at least one death observed at each level of each variable. Any adjustments were made before any statistical modelling was carried out.
Distribution of deaths and person years at risk, 1947–98
The EPICURE computer program17 was used to provide both person-years-at-risk and numbers of deaths for all combinations of all levels of the selected variables (see table 5), and to carry out statistical modelling by means of Poisson regression,18 calculating point estimates of relative risk for categories of cumulative cadmium exposure with and without adjustment for other variables.
RESULTS
External standard
Table 6 shows observed and expected numbers of deaths by site of cancer and by broad categories of non-malignant causes. Significantly increased SMRs are shown for cancers of the pharynx (observed (Obs) 4, expected (Exp) 0.7, SMR 559), non-malignant diseases of the respiratory system (Obs 61, Exp 43.0, SMR 142), and non-malignant diseases of the genitourinary system (Obs 10, Exp 4.1, SMR 243). Non-significantly increased SMRs are shown for a number of causes including lung cancer (Obs 45, Exp 40.7, SMR 111) and cancer of the prostate (Obs 9, Exp 7.5, SMR 116).
Mortality of male workers (n = 926) from a nickel-cadmium battery factory, 1947–2000
Table 7 shows observed and expected numbers of deaths for lung cancer, non-malignant diseases of the respiratory system, and all causes by year of hire and by period from hire (irrespective of how long study subjects remain in the industry). There were no significant trends of SMRs increasing or decreasing either with year of hire or with period from commencing employment. The possible influence of regional effects on the overall SMRs for these causes of death was assessed by reviewing SMRs for all males in the West Midlands region for the years 1970, 1980, and 1990. The SMRs for all causes were 105, 103, and 105 respectively; the SMRs for lung cancer were 102, 99, and 104 respectively; and the SMRs for non-malignant diseases of the respiratory system were 111, 110, and 105 respectively.
Cause specific mortality of male workers (n = 926) from a nickel-cadmium battery factory, by year of hire and by period from commencing employment, 1947–2000
Internal standard
Table 8 shows relative risks of mortality for lung cancer, chronic obstructive pulmonary diseases, and all causes of death combined, adjusted for age and calendar period. The table summarises the results of nine separate analyses; relative risks are shown for unlagged exposure histories and then for exposure histories lagged first by 10 and then by 20 years. There are no significant trends of risks increasing or decreasing with levels of cumulative exposure. Further adjustment for employment status (still employed/left employment) and year of hire had little effect on the findings (not shown in table).
Rate ratios (relative risks) for lung cancer and for chronic obstructive pulmonary disease in relation to cumulative exposure to cadmium
DISCUSSION
The results of these analyses do not indicate that cadmium hydroxide is an occupational lung carcinogen. The SMR of 111 for lung cancer was similar to those for all neoplasms (SMR = 113) and all causes (SMR = 111). There was no suggestion of lung cancer SMRs increasing with period from hire as might be expected if an occupational cancer hazard was present. Of even greater importance was the failure to find any positive trend between estimated cumulative cadmium exposure and lung cancer risks. The presence of a healthy worker selection effect might have worked against identifying a positive trend. However, the absence of an important negative trend between rate ratios for all causes mortality and cumulative cadmium exposure categories suggests that such a selection effect has had little impact on the experience of this study cohort.
Extensive occupational hygiene measurements have been incorporated into these analyses, far more data than has been available to other occupational cohort studies of cadmium workers. In addition, the exposure assessment used a conservative approach to minimise exposure misclassification errors. Nevertheless these hygiene data share some of the limitations existing in the other studies. Data were not available for the earlier years of exposure and no direct measurements were available for maintenance workers and workers in the “non-exposed” departments. It has been necessary to make a larger number of assumptions in deriving exposure estimates for these latter groups of workers. Fortunately, the work history data had been maintained over the period under study by personnel departments that took some pride in keeping high quality records. “Multi-tasking” was not, in general, practiced at the factory; workers had well defined jobs. It is thus possible to have some confidence in the ranking of the final four exposure categories used in the analyses. Smoking data were, unfortunately, not available, though there is no reason to believe that smoking habits would be correlated with the derived cadmium exposure estimates. The approach taken with the retrospective exposure assessment imposed monotonic trends with time. The irregular trend patterns shown by the raw exposure data (see table 1) are not mirrored in the final job-exposure matrix, but these irregularities are believed to be due to non-representative (small number) samples, different sampling approaches adopted in different time periods, and other limitations of happenstance sampling.
There was an excess SMR for non-malignant diseases of the respiratory system. This excess did not appear to be due to exposure to cadmium hydroxide dust; there was no suggestion of a positive trend between risks of chronic obstructive pulmonary disease and estimated cumulative cadmium exposure. This was in marked contrast to the study of UK copper cadmium alloy workers; this did find such a relation, though in the latter study the agent was exposure to cadmium oxide fume and not cadmium hydroxide dust. The significantly increased SMR of 243 for diseases of the genitourinary system (based on 10 deaths) may indicate the late effects of kidney damage. Both renal effects and chronic obstructive pulmonary diseases are known potential consequences of exposure to various cadmium compounds (especially to cadmium fume),19 and these health outcomes could be usefully addressed epidemiologically by pooled analyses of the available cohorts so that enough cases are available for a meaningful statistical analysis.
The hypothesis that cadmium is a human lung carcinogen has been further weakened by these new findings. The toxicological evidence of lung cancer following inhalation induced cadmium exposure pertains to cadmium chloride.20,21 Cadmium chloride is highly soluble (140–168 g/cm3) in comparison to cadmium oxide (insoluble) and cadmium hydroxide (0.00026 g/cm3),22 and this property may be an important determinant in its toxicological behaviour. The animal carcinogenicity of other cadmium compounds is more or less confined to sarcomas.19 The toxicological background taken together with these new epidemiological findings and the further analyses of US cadmium recovery workers,6 UK copper cadmium alloy workers,7 and Swedish nickel cadmium battery workers,8 might indicate that the IARC evaluation of cadmium and cadmium compounds is perhaps suitable for re-examination. Obviously, regulations designed to protect cadmium exposed workforces from unwanted non-malignant health effects and the stringent exposure controls currently practiced are both prudent and desirable. The carcinogenic effects of cadmium exposure in some species of experimental animals could usefully lead to further, larger, better designed epidemiological studies. Unless stronger evidence is provided, however, the claims that carcinogenic effects have been shown in humans ought to be treated with some scepticism.
Acknowledgments
We thank the Office for National Statistics for tracing the cohort and providing death details. We thank Margaret Williams for word processing and Jaswant Bal for computerisation of death details. We thank Barry Lewis, a former environmental health and safety officer at the factory, for advice about factory processes and occupational hygiene surveys. TS thanks the International Lead Zinc Research Organisation (ILZRO) for financial assistance with earlier aspects of this work carried out in the period 1991–97. We thank the parent company for access to archived records.