Article Text

Abstract
Objective: The EMECAM study is a collaborative effort to evaluate the impact of air pollution on mortality in Spain. In this paper the combined results are presented for the short term effects of particulates and sulfur dioxide on both daily mortality for all and for specific causes.
Methods: The relation between daily mortality for all causes, cardiovascular diseases, and respiratory diseases, and air pollution for particulates (daily concentrations) and SO2 (24 and 1 hour concentrations) was assessed in 13 Spanish cities for the period 1990–6. With a standardised method, magnitude of association in each city was estimated by Poisson regression in a generalised additive model. Local estimates were obtained from both single and two pollutant analyses. Lastly, combined estimates for each cause and pollutant were obtained.
Results: For combined results, in single pollutant models a 10 μg/m3 increase in the concentration of the mean of the concurrent and one day lag for black smoke was associated with a 0.8% (95% confidence interval (95% CI) 0.4 to 1.1%) increase in total mortality. The estimates for total suspended particles (TSPs) and particulate matter of aerodynamic diameter <10 μm (PM10) and total mortality were slightly lower. The same increase in concentrations of SO2 was associated with a 0.5% increase in daily deaths. For groups of specific causes, higher estimations were found, specially for respiratory conditions. Peak concentrations of SO2 showed significant associations with the three groups of mortality. When two pollutant analyses were performed, estimates for particulates, specially for black smoke, did not substantially change. The estimates for daily concentrations of SO2 were greatly reduced, but, on the contrary, the association with peak concentrations of SO2 did not show any change.
Conclusions: There is an association between mortality and pollution through particulates among city populations in Spain. Peak rather than daily concentrations of SO2 were related to mortality. Results suggest that populations in Spanish cities are exposed to health risks derived from air pollution.
- air pollution
- particles
- sulphur dioxide
- mortality
- cardiovascular diseases
- respiratory diseases
- meta-analysis
- EMECAM, Spanish multicentre study on air pollution and mortality
- ICD-9, international classification of diseases ninth revision
- BS, black smoke
- TSP, total suspended particles
- PM10, particulate matter less than 10 μm in diameter
Statistics from Altmetric.com
- air pollution
- particles
- sulphur dioxide
- mortality
- cardiovascular diseases
- respiratory diseases
- meta-analysis
- EMECAM, Spanish multicentre study on air pollution and mortality
- ICD-9, international classification of diseases ninth revision
- BS, black smoke
- TSP, total suspended particles
- PM10, particulate matter less than 10 μm in diameter
The scientific and social interest in the effects of air pollution on people's health has notably increased in the past decade as a consequence of the growing evidence of its actual relevance to health of the population and concern about related changes in the near future.1–6 Among the health effect outcomes analysed, mortality, both total and cause specific mortality, has needed a special focus7–10 as a crucial indicator of the impact on the health of communities.
Several approaches have been taken in the analysis of the relation between air pollution and health. The use of different methods, however, has made direct comparison of the results of those studies difficult, and it has even resulted in non-consistent findings. These facts have led to the launching of multicentre projects—such as the APHEA project2,8,9 in Europe or the NMMAPS study in the Unites States.11 Also some experiences at national level have been developed in Europe. In France, in a reliability study about the development of a surveillance system of the effects of air pollution on health, the short term impact of air pollution on mortality has been analysed in nine cities showing significant associations at current concentrations of pollutants.12
In Spain, the EMECAM study (Spanish multicentre study on air pollution and mortality) is a collaborative effort of 12 institutes or health departments. The objective of the EMECAM project is to evaluate, with a standardised method, the short term effect of air pollution on mortality in Spanish urban populations. The cities included in this study are Barcelona, Bilbao, Cartagena, Castellón, Gijón, Huelva, Madrid, Oviedo, Sevilla, Valencia, Vigo, Vitoria, and Zaragoza (fig 1) accounting for more than 9 million inhabitants. These cities represent different sociodemographic, climatic, and environmental situations at the national level. The design of the study and individual results for each city, using Poisson regression with a parametric control of confounders, have been published elsewhere.13 In this paper we present the local and combined results for the short term effects of particulates and sulfur dioxide (SO2) on both daily mortality for all and for specific causes with generalised additive models from single and two pollutant analyses.

Participating cities within the EMECAM project.
METHODS
Data
The daily number of deaths was obtained from the regional mortality registers and was restricted to the residents only. Daily mortality time series in each city for all causes excluding external (ICD-9 001–799), for cardiovascular diseases (ICD-9 390–459), and for respiratory diseases (ICD-9 460–519) were considered the response variables.
The explanatory variables were daily series of particulates (black smoke (BS), total suspended particles (TSP), or particulate matter less than 10 μm in diameter, (PM10)) and SO2. Data on pollutants were obtained from local pollution networks. Four cities (Castellón, Vigo, Vitoria, and Zaragoza) only provided data from manual stations. These types of monitoring stations yield information on daily concentrations of BS, measured by reflectometry, and SO2 determined by spectrophotometry. Data from the automatic stations included TSP and PM10 values, both measured by β-ray atomic absorption, and SO2 measured by ultraviolet fluorescence. For each pollutant the mean daily concentrations (24 hours) were examined (for SO2 from automatic stations 1 hour maximum concentrations were also considered). Data were collected retrospectively and thus measurements were not completely standardised. Nevertheless, a standardising data collection procedure, based on that of the APHEA project,2 was followed: (a) geographic location of the monitoring stations—only urban monitoring sites were considered; (b) completeness criteria for each pollutant—only those stations with data for more than 75% of the whole study period were considered, with a minimum of three sites for each pollutant; (c) applied methods for filling in missing values—missing values in one station were estimated by a regression model based on the values of the remaining stations, allowing also for seasonal variability.13 The number of monitoring stations changed depending on cities and on pollutants, being more than three in all cases.
Correlations between daily measurements at different stations in the same city were very heterogeneous ranging between 0.40 and 0.90 in most of them, however, in a few cities correlation was poorer for some pollutant indicators. In all cities SO2 was positively correlated with particulates (whatever the indicator) with Pearson correlations ranging from 0.20 to 0.70 for BS and TSP, and from 0.20 to 0.80 for PM10.
Daily meteorological data from the National Institute of Meteorology and data on weekly incidence of influenza from local health surveillance systems were also obtained.
Analysis
The EMECAM project analysis approach has an ecological time series design. Briefly, magnitude of association in each city was estimated by a Poisson autoregressive model using a standardised method.13 With this approach we expected counts of daily deaths to follow a non-stationary overdispersed Poisson process where variations could be partly explained for some factors varying with time (air pollution, temperature, and humidity, long term trend, seasonality, incidence of flu , days of the week, holidays, and unusual events). The effect of these variables must be taken into account to avoid confusion in the estimation of the relation between mortality and air pollution.14,15
Estimations for each city
The estimates for each city presented here were obtained through a centralised and standardised protocol with a common definition of variables, questions, and hypotheses for the individual studies.13 To allow for potentially non-linear effects of the potential confounders, regression was done with Poisson regression, allowing for overdispersion in a generalised additive model.17,18 To control for seasonal and long term trends we used loess smoothing functions of time. Loess is a weighted moving regression with a window centered about each value of the explanatory variable.17 The weights are close to one for the central third of the window, decreasing rapidly to zero outside that range.19 The selection of the span, the window that determines the fraction of data included in the moving smooth, was done taking care not to remove short term relations between variables—such as those of air pollutants and mortality. Therefore we fitted different models changing the span for the loess of trend, windows used were 90, 120, 150, 180, and 210 days. The width of the time window for loess was chosen to minimise partial autocorrelation in the residuals. To allow for city specific differences, the smoothing variables were optimised separately for each location.
Calendar patterns in the series were controlled including indicator variables for both separate days of the week and holidays.
For temperature and relative humidity, to control for effects of hot days (very short impact) and cold days (a few days delayed),20 the mean of the current values and the first lag of temperature and humidity, and mean of lags two to four were included. For influenza a smoothed moving average of the number of weekly cases was used to obtain an estimation of the daily incidence. Then the mean of the concurrent day and the first six lags was included in the model. To allow a non-linear form in the relation between mortality and these variables (meteorological and influenza) we used smoothing splines, choosing the number of degrees of freedom (between two to four) to minimise Akaike's information criteria.18 After a core model for each cause was built, the indicators of air pollution were included in a linear form. This decision was based on the results of other work with data from eight Spanish cities19 where BS showed a nearly linear association with daily deaths.
In the exploratory lag by lag analysis of the dynamic relation between each pollutant and daily mortality, we generally obtained the most consistent results for the concurrent day and the first lag.13 Furthermore, this time indicator has been shown to do substantially better than the 1 day indicator only in estimating the effect of particulates.16 Therefore, we chose the mean of the concentrations of the concurrent day and the first lag as the pollutant indicator for estimating the combined effect. For peak concentrations of SO2, however, a more precise estimation was achieved with only the concentrations from the concurrent day, so we chose this indicator here.
As particles and SO2 are correlated, we first used single pollutant models. We then included the other pollutant in the model to assess the changes in the estimates. Two pollutant models for particulate indicators included control for concentrations of SO2. Models for SO2 indicators included control for BS concentrations if available, and TSP or PM10 otherwise. In each case the second pollutant was included as the mean of the concurrent day and day 1 lag concentrations.
Lastly, to control residual overdispersion or serial autocorrelation in the final models, autoregressive terms up to the 6th order were checked, including those in the model when significant.
Combined estimates
The quantitative summary of all individual results, the results for each centre, is given here from meta-analyses that used both graphical and analytical methods. Graphically, the individual as well as the combined relative risks (RRs) associated with a 10 μg/m3 increase in the concentrations of pollutants and their 95% confidence intervals (95% CIs) were plotted. A logarithmic scale was used because 95% CIs are symmetric on this scale. The combined estimates were weighted by city specific regression coefficients, in which the weights were the inverse of the local variances. This method, also called the fixed effect model, has been described in more detail elsewhere.21 Heterogeneity was checked by a χ2 test under the fixed effect hypothesis. Because few studies were combined, the statistical power of the test was very small. In these circumstances, some authors have suggested that the level of statistical significance should be increased above 0.05.22 In our study, if the p value was lower than 0.20, random effect models were also applied. In this case, the variance between cities was estimated with the moment method of Der-Simonian and Laird21 and added to the estimates of the local variance. When the p value for heterogeneity was lower than 0.20 we calculated both estimates—that is, fixed and random effect estimates.
RESULTS
Although the periods of study were not exactly the same for all cities, in all cases they ranged between 1990 and 1996. Table 1 shows the descriptive data on population, mortality, and weather characteristics in the cities within the study.
Population, mortality, and meteorological data from the cities within the EMECAM project
As shown in table 2, air quality data across the participating cities showed considerable variation. Daily mean concentrations of BS varied from 24.6 to 98.1 μg/m3 among cities, TSP daily mean ranged from 55.9 to 82.9 μg/m3, and PM10 24 hour mean concentrations were from 37.8 to 45.1 μg/m3. The daily mean 24 hour concentrations of SO2 ranged from 8.1 to 44.5 μg/m3. In general, BS, TSP, and SO2 showed the same seasonal pattern, with higher concentrations in winter. The correlation between these pollutants and temperature was negative. In Madrid PM10 had a clear seasonal pattern, showing higher concentrations, on average, in winter. However, in the other two cities with PM10 records available (Sevilla and Huelva) this pattern was not found.13
Daily mean (SD) air pollutant concentrations (μg/m3) in the participating cities in the EMECAM project
Figures 2, 3, and 4 show the estimates of the association between air pollution indicators, daily concentrations, and daily mortality for all causes excluding external ones, cardiovascular mortality, and respiratory mortality, respectively, across the cities included in the EMECAM project. The estimates presented correspond to the single pollutant models. Also the combined RRs (95% CI) associated with a 10 μg/m3 increase in the concentrations of the pollutant (mean of the concurrent and the day 1 lag concentrations for all the four pollutants and also the hourly maximum concentration in the concurrent day for SO2) are shown.
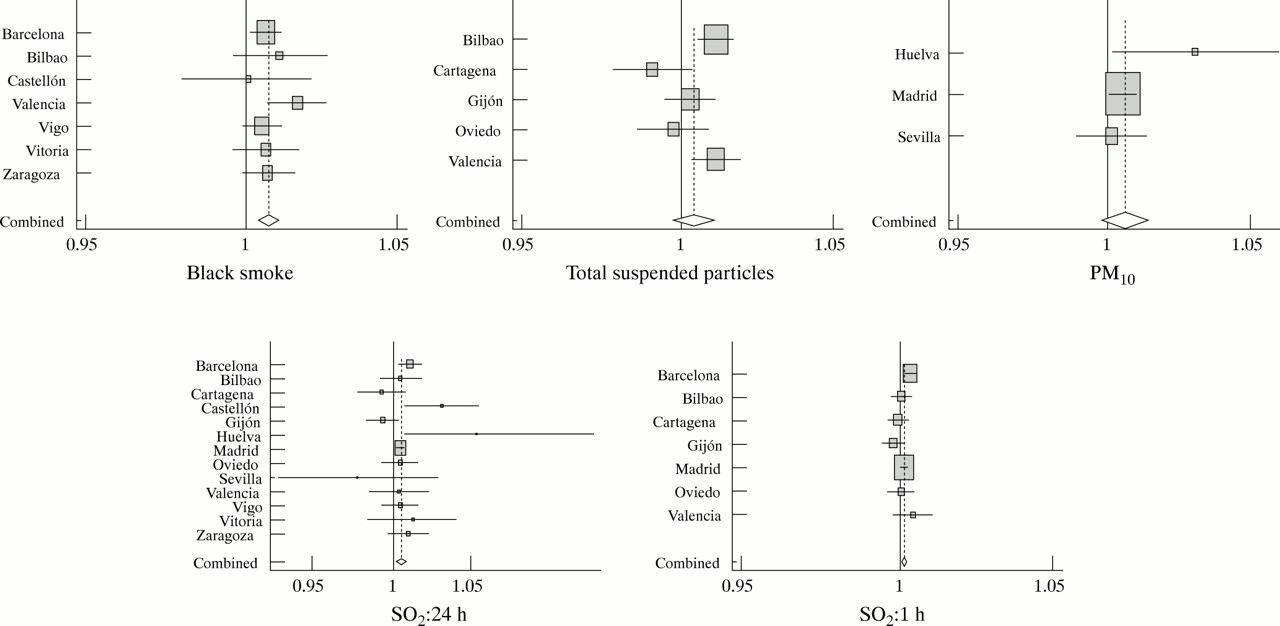
Single pollutant models of association between all daily mortality excluding external causes and air pollution for particulate matter and SO2 in the Spanish cities within the EMECAM project. Results are expressed as the RR (95%CI) for an increase of 10 μg/m3 in the concentration of the pollutant. Mean of concurrent day and day 1 lag concentrations are used (1 hour maximum concentrations of the concurrent day for SO2).

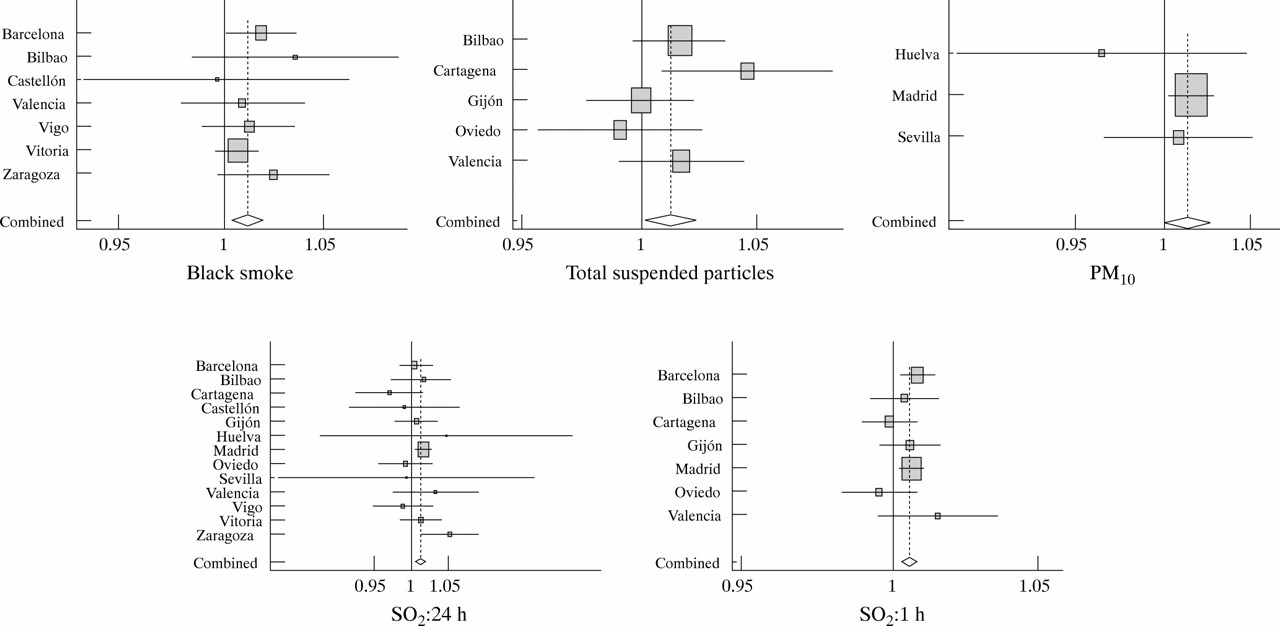
Single pollutant models of association between daily mortality by cardiovascular causes and air pollution for particulate matter and SO2 in the Spanish cities within the EMECAM project. Results expressed as the RR (95%CI) for an increase of 10 μg/m3 in the concentration of the pollutant. Mean of concurrent day and day 1 lag concentrations are used (1 hour maximum concentrations of the concurrent day for SO2).

Single pollutant models of association between daily mortality by respiratory causes and air pollution for particulate matter and SO2 in the Spanish cities within the EMECAM project. Results expressed as the RR (95%CI) for an increase of 10 μg/m3 in the concentration of the pollutant. Mean of concurrent day and day 1 lag concentrations are used (1 hour maximum concentrations of the concurrent day for SO2).
In the local results for particulates (fig 2), all the estimates for the relation between total mortality and BS were positive, reaching significance for Barcelona and Valencia. The estimates for TSP were less consistent with some negative coefficients. For cardiovascular mortality (fig 3) all the estimates for particles except two were positive. In this case the estimates for TSP and PM10 were higher than for total mortality, but only a few of them were significant. For respiratory mortality (fig 4), particle estimates in general were also more highly associated, and, again, there were some negative coefficients.
The estimates for 24 hour SO2 in Madrid showed consistent results in the three groups of causes. In other cities (Barcelona, Castellon, Huelva, and Zaragoza) significant coefficients were also found. The results for the Andalusian cities Sevilla and Huelva presented a very wide 95% CI. The estimates for the 1 hour SO2 value seem to be lower; however, we must consider the different timing of the indicator, and the subsequent range of values. In this case, higher estimates for respiratory mortality were found.
Figure 5 shows the set of combined estimates for the three causes of mortality. The inclusion of SO2 in the models did not affect the estimations for BS and TSP substantially. On the contrary, the association with 24 hour SO2 disappeared when controlled for particles. However, the relation between mortality and peak values of SO2 did not show any change after the inclusion of particles in the models. Lastly, the combined results for PM10 were affected after the inclusion of SO2, changing either to a higher estimate, in the case of total and cardiovascular mortality, or to a smaller estimate, as for respiratory mortality.

Combined estimates of the association between mortality and air pollution for particulate matter and SO2 in the Spanish cities within the EMECAM project. (A) Total mortality excluding external. (B) Cardiovascular mortality. (C) Respiratory mortality. Estimates are provided under single and two pollutant models. Results are expressed as the estimated percentage changes (95%CI) in daily deaths for an increase of 10 μg/m3 in the concentration of the pollutants. Mean of concurrent day and day 1 lag concentrations are used (1 hour maximum concentrations of the concurrent day for SO2). R estimates under random effect models are shown when p of heterogeneity <0.20.
In tables 3, 4, and 5 we summarise the pooled RRs (95% CI) of dying from all causes excluding external ones, cardiovascular disease, and respiratory disease, respectively associated with a 10 μg/m3 increase in the concentrations of each pollutant separately. The combined estimates were obtained as the weighted means of city specific regression coefficients, from both single and two pollutant models, the weights being the inverse of local variances. Such an increase in the mean concentrations of the concurrent and day 1 lag for BS was associated with a 0.8% increase in mortality (95% CI 0.3 to 1.3%) for the two pollutant model under random effect. Results for TSP showed heterogeneity, leading to not accepting the significant association under a fixed effects model. For PM10 a significant effect was found for total mortality, ranging from 0.5% increase in mortality in the single pollutant model to 1.3% in the two pollutant model. Twenty four hour SO2 showed an estimated increase of 0.5% in all daily deaths (95% CI 0.1% to 1.0%) for the same increase (10 μg/m3 in the mean of the concurrent and day 1 lag concentrations). That association disappeared when controlled for particles (0.2%; 95% CI −0.4 to 0.9%). Lastly, a 10 μg/m3 increase in the 1 hour SO2 concurrent day values was significantly associated with a 0.2% excess in total deaths (fixed effect model) in both single and two pollutant models.
Summary relative risks (RRs) (95% CIs) of mortality associated with a 10 μg/m3 increase in the concentration of pollutants across the EMECAM cities (all causes excluding external, ICD-9 001–799)
Summary relative risks (RRs) (95% CIs) of mortality associated with a 10 μg/m3 increase in the concentration of pollutants across the EMECAM cities (cardiovascular mortality, ICD-9: 390–459)
Summary relative risks (RRs) of mortality (95% CIs) associated with a 10 μg/m3 increase in the concentration of pollutants across the EMECAM cities (respiratory mortality, ICD-9: 460–519)
The results for cause specific mortality are summarised in table 4 (cardiovascular mortality) and table 5 (respiratory mortality). Overall, the combined estimates were greater than for total mortality except for cardiovascular mortality and BS and for PM10 and respiratory deaths under the two pollutant model. An increase in 10 μg/m3 in the concentrations of TSP was associated with a 1.0% increase in cardiovascular mortality. For PM10 a similar association was estimated, with a 1.2% increase in the number of cardiovascular deaths. This estimate was twice as high under the two pollutant model. Black smoke showed a robust association with respiratory mortality whereas TSP and PM10 were significantly associated only in single pollutant models. Both 24 hour and 1 hour SO2 had positive associations with cause specific mortality, but this association was only significantly associated with 1 hour SO2 after controlling for the effect of particles.
DISCUSSION
The EMECAM project is a multicentre epidemiological study on the short term effect of air pollution on mortality in urban Spanish populations. Apart from the analysis of the relation between air pollution and mortality in each city, the combined analysis of the results from each city within the project had been planned. The advantages of the standardised meta-analysis techniques, including the lack of publication and selection biases, have been dealt with elsewhere.8,9
In the combined result, we have found a significant positive association between daily mortality—both as total mortality or as caused by respiratory or cardiovascular diseases—and suspended particles in the three indicators analysed, BS, TSP, and PM10. Coefficients obtained for cardiovascular and respiratory causes are, in general, greater than for mortality for all causes.
The size of the association between mortality and particles found here is consistent with previously published studies. In a meta-analysis which included results from several North American cities and London23 a combined effect of the particles was obtained, with an RR of death of 1.006 (95% CI 1.005 to 1.007), for increases of 10 μg/m3 in daily concentrations of TSP. In another meta-analysis with estimates of six eastern cities of the United States24 the RR for PM10 was 1.008 (95% CI 1.005 to 1.011). Within the NMMAPS project the analysis that used the data from 90 large cities showed that an increase of 10 μg/m3 in the daily concentrations of PM10 was associated with a 0.5% increase in the number of daily deaths.11 Levy et al25 have carried out an empirical Bayes meta-analysis with 29 estimates of the relation between PM and mortality from 21 published articles. They obtained an overall estimate of a 0.7% increase in mortality per 10 μg/m3 increase in PM10 concentrations. Finally, Schwartz, in a recent study in 10 cities in the United States, has reported a 0.67% increase in mortality associated with a 10 μg/m3 increase of PM10 in the mean concentrations over 2 days.26
In the meta-analysis for particulates corresponding to the APHEA European project8 a RR of death of 1.004 (95% CI 1.003 to 1.006) was found for increases of 10 μg/m3 in daily concentrations of PM10, and of 1.0026 (95% CI 1.0018 to 1.0034) in concentrations of BS. In this case, the increase was more than twice as high when the cities from Central Europe were excluded from the analysis. In the study for causes of death, the APHEA project,9 Zmirou et al found that a cardiovascular RR of death of 1.008 (95% CI 1.002 to 1.012) was associated with daily increases of 10 μg/m3 in BS and an RR of 1.002 (95% CI: 0.998–1.006) was associated with daily increases of 10 μg/m3 for TSP. Results corresponding to respiratory mortality were RR 1.008 (95% CI 1.00 to 1.016)) for BS and RR 1.010 (95% CI 0 to 1.57) for TSP. These results correspond to western European cities. For central European cities, again, coefficients were lower and non-significant.
In a study carried out in nine French cities12 the combined results for BS showed a 0.6% increase in total and cardiovascular mortality with an increase of 10 μg/m3 of pollutant, with no significant results for respiratory mortality. The association with particles smaller than 13 μm was not significant for death from specific causes but it did show relevance for total mortality. Results from the APHEA2 project including data from 29 European cities27 reported an estimated increase in daily mortality of 0.6% (95% CI 0.4–0.8%) for an increase of 10 μg/m3 in daily BS or PM10. Climate was found to be an effect modifier with a 0.23% estimated increase in mortality for such an increase in BS in cold regions and a 0.70% estimated increase for warm regions.
The coefficients for the association between 24 hour SO2 and mortality were inconsistent among the cities of the EMECAM project and some of the coefficients obtained showed a great lack of precision. For example, the estimates of the RR of dying from respiratory disease for an increase of 10 μg/m3 in the concentrations of 24 hour SO2 in Sevilla were 0. 992 (95% CI % 0.833 to 1.182), and 1.049 (95% CI 0.882 to 1.247) in Huelva. This could be due, among other reasons, to the low concentrations registered in some cities where, sometimes, the concentrations of pollutant were below the detection limit. Another alternative explanation could be that data for SO2 concentrations come from the two existing networks, manual and automatic, which have different methods of measurement and averaging time. In this situation the measurements used in the automatic network indicator coincide with the day studied, from 0 to 24 hours, but in the manual network the changes are made in the morning, therefore the sample collected during the early morning hours are assigned to the previous day. For this reason a separate analysis was carried out, depending on the source of the data (manual or automatic network). This stratified analysis did not provide different results from the ones obtained through the combined analysis.
On the other hand, the combined estimates for SO2 daily concentrations were affected by the inclusion of the particle variables in their model. Thus, when two pollutant models were performed the magnitude of the association for 24 hour SO2 and mortality decreased substantially and the estimates lost significance, if there was one.
On the contrary, estimates of association between the 1 hour SO2 maximum and mortality were more consistent and precise. Combined results showed a significant association with the three groups of mortality causes studied that were not affected when controlling for particles. The association was higher for respiratory causes. These results could indicate an independent impact of peak values of SO2 more than an effect due to longer exposure (days).
As already mentioned, when the dose-response shape of the relation between air pollution and deaths in eight Spanish cities was examined,19 a linear association was found for BS. By contrast, SO2 showed a different pattern. The risk increases up to SO2 concentrations of about 30 μg/m3 and then levels out and begins to slightly decline with increases in concentration. In the analysis presented here air pollutants were treated as linear terms. That approach is not completely suitable for examining the relation between SO2 and mortality, so it must be considered as a point for further evaluation.
Evidence from the scientific literature of the association between SO2 and mortality is less conclusive than in the case of particles. Most of the information found about the short term effects of SO2 on mortality come from European studies. In the APHEA project meta-analysis8 an RR of death of 1.004 (95% CI 1.003 to 1.005) was obtained for increases of 10 μg/m3 in the daily concentrations of SO2. As in the case of particulates, the RRs were also higher when restricting the analysis to cities in western Europe. In the French study12 the 24 hour SO2 was significantly associated with all the causes studied, with increases ranging from 0.7% for all causes to 1.1% for respiratory and cardiovascular causes. Apart from these studies in Europe, some results are available from America. In a study in Philadelphia,28 an RR of 1.003 (95% CI 1.001 to 1.005) for the estimates for the daily values of SO2 was obtained, In other work in three United States counties, Moolgavkar found a robust association between the concentrations of SO2 and mortality.29 Lastly, a study carried out in Mexico30 had no significant results for SO2.
The effect of SO2 toxicity on the respiratory tract has been known from experimental studies for some time.4 However, the physiopathological mechanism of the harmful part played by particles on cardiovascular health has been less understood up to recent times when a great advance was made in this. Results from studies which have explored the possible physiopathological mechanisms have provided evidence that fine suspended particulates can cause systemic effects—such as an increase of plasma viscosity31 or cardiac arrhythmia.32 Toxicological studies have shown biological alterations in rats after exposure to filtered air or concentrated ambient particulate matter.33 Abnormalities in the electrocardiogram of dogs were found after exposure to fine particles.34
The results presented here for local estimates in figures 2, 3 and 4 correspond to one pollutant models. This means that we cannot rule out the possible confounding part played by other pollutants, as is illustrated for the 24 hour SO2 coefficients in the two pollutant models. Although it represents an important limitation when assigning the effects found to an isolated pollutant, this approach is preferred to avoid problems of collinearity between pollutants,35 provided that pollution is a complex mixture, and that pollutants share the same sources and show a strong correlation with meteorological phenomena. It may be considered, therefore, that each air pollution indicator includes its own effects together with those of the pollutants emitted or caused by it.36
Another point to consider is the exposure measurement. With this kind of design, it is assumed that the monitored concentration is related to mean exposure. Through studies which measure individual and environmental exposure simultaneously it has been proved that, although the concordance between the concentrations detected was relatively low, a good correlation did exist between the time variables of both measures.37 Recently Zeger et al38 have shown that the likely consequence of using ambient concentrations instead of individual ones is that of underestimating the effects of pollution on the hazard of dying for an individual person on a given day. Lastly, for the different indicators of airborne particulate matter, the results of a recent study in Amsterdam39 suggest that BS could provide a more adequate measure of particles generated by traffic, an important predictor of toxicity from ambient particles.40
Some of the estimates presented are potentially heterogeneous (p<0.20). We have investigated the role of some variables as effect modifiers, in which exploratory analyses showed that concentrations of SO2 and mean temperature could be potential sources of heterogeneity. The APHEA project estimates on the effects of particulate matter and SO2 presented differences among regions, with stronger effects in western Europe than in central and eastern Europe.8 Some variables explaining heterogeneity have been examined including concentrations of other pollutants, mortality ratio, climate, geographical area, and statistical approach used41 without a definitive conclusion up to now. In the meta-analysis by Levy et al25 the ratio of PM2.5/PM10 seems to be a relevant effect modifier for the effect of PM10. We agree that the analysis of the variability between studies is a very important issue in giving combined results. However, the low number of cities analysed here for some pollutants precludes deeper investigation in this issue. In that sense, the few cities providing data for some pollutants would suggest caution in interpreting results. In particular, as we have data for PM10 only from three cities, combined estimates are very much influenced by the coefficients from Madrid, the biggest city in Spain.
Main messages
-
The short term impact of air pollution on mortality has been evaluated in 13 Spanish cities.
-
A 10 μg/m3 increase in the concentrations of BS was significantly associated with a 0.8% increase in total mortality.
-
Total suspended particulates and PM10 also showed an association with daily mortality.
-
Results for specific causes were, in general, higher than for all causes.
-
Peak concentrations of SO2 showed different relations with mortality than did daily concentrations.
Policy implications
-
Air pollution is still a health risk for the urban population in Spain.
-
Public actions reducing the ambient concentrations of air pollutants would have beneficial results on the health of the Spanish population.
To conclude, the results presented here show an association between mortality and pollution through particulates among city populations in Spain, although a confounding effect from other pollutants cannot be excluded. This association is greater for groups of specific causes. The 1 hour SO2 maximum presents a clearer impact on mortality than the 24 hour SO2, particularly for respiratory causes. However, results are not homogeneous among the cities. In some of them, there is a lack of results showing evidence of associations, or else these results are of little consistency. Although the estimates provided in this study cannot be considered to be definitive, results suggest that at the present concentrations of pollutants, populations from the Spanish cities are exposed to health risks derived from environmental pollution.
APPENDIX: THE EMECAM GROUP
The EMECAM group consists of F Ballester, S Pérez-Hoyos, C Iñíguez, JM Tenías, F Gómez, R Molina, J González-Aracil (Valencia, co-ordinating centre); M Saez, MA Barceló, A Lerchundi, C Saurina, A Tobías (Barcelona); E Alonso, K Cambra (Bilbao); M Taracido, A Figueiras, JM Barros, I Castro, A Montes, E Smyth (Vigo); JM Ordóñez, E Aránguez, I Galán, AM Gandarillas, N Aragonés (Madrid); I Aguinaga, MY Floristan, F Guillén, MS Laborda, MA Martínez, MT Martínez, PJ Oviedo (Pamplona); A Daponte, R Garrido de la Sierra, JL Gurucelain, P Gutiérrez, JA Maldonado, JL Martín, JM Mayoral, R Ocaña, J Serrano (Granada); JB Bellido, A Arnedo, F González, C Felis (Castellón); JJ Guillén, Ll Cirera, L García, E Jiménez, MJ Martínez, S Moreno, C Navarro (Cartagena); MJ Pérez, A Alonso, JJ Estíbalez, MA García-Calabuig, (Vitoria); A Cañada, C Fernández, F Fernández, V García, I Huerta, V Rogríguez (Asturias); F Arribas, M Navarro, C Martos, MJ Rabanaque, E Muniesa, JM Abad, S Zapatero, T Alcalá (Zaragoza); and J Sunyer (adviser).
Acknowledgments
The EMECAM project was supported by the Spanish Ministry of Health, Fondo de Investigaciones Sanitarias (FIS 97/0051 and FIS 00/0010).
REFERENCES
Footnotes
-
Members are listed in appendix.