Article Text

Abstract
Background The impact of body mass index (BMI; kg/m2) and waist circumference (WC) on mortality in elderly individuals is controversial and previous research has largely focused on obesity.
Methods With special attention to the lower BMI categories, associations between BMI and both total and cause-specific mortality were explored in 7604 men and 9107 women aged ≥65 years who participated in the Tromsø Study (1994–1995) or the North-Trøndelag Health Study (1995–1997). A Cox proportional hazards model adjusted for age, marital status, education and smoking was used to estimate HRs for mortality in different BMI categories using the BMI range of 25–27.5 as a reference. The impact of each 2.5 kg/m2 difference in BMI on mortality in individuals with BMI<25.0 and BMI≥25.0 was also explored. Furthermore, the relations between WC and mortality were assessed.
Results We identified 7474 deaths during a mean follow-up of 9.3 years. The lowest mortality was found in the BMI range 25–29.9 and 25–32.4 in men and women, respectively. Mortality was increased in all BMI categories below 25 and was moderately increased in obese individuals. U-shaped relationships were also found between WC and total mortality. About 40% of the excess mortality in the lower BMI range in men was explained by mortality from respiratory diseases.
Conclusions BMI below 25 in elderly men and women was associated with increased mortality. A modest increase in mortality was found with increasing BMI among obese men and women. Overweight individuals (BMI 25–29.9) had the lowest mortality.
- Body mass index
- waist circumference
- aged
- chronic disease
- mortality, elderly
- mortality si
- nutrition
- smoking rb
This is an open-access article distributed under the terms of the Creative Commons Attribution Non-commercial License, which permits use, distribution, and reproduction in any medium, provided the original work is properly cited, the use is non commercial and is otherwise in compliance with the license. See: http://creativecommons.org/licenses/by-nc/2.0/ and http://creativecommons.org/licenses/by-nc/2.0/legalcode.
Statistics from Altmetric.com
- Body mass index
- waist circumference
- aged
- chronic disease
- mortality, elderly
- mortality si
- nutrition
- smoking rb
Introduction
The impact of body mass index (BMI; weight (kg)/height (m2)) and waist circumference (WC) on mortality in the growing elderly population is still controversial. There is concern about the potential increase in mortality related to excess weight,1 whereas mortality in underweight individuals has received less attention.
As reviewed by Heiat et al,2 Zamboni et al,3 and Janssen and Mark,4 the recommendations of ideal weight for adults5 seem to be too restrictive for elderly individuals and being moderately overweight appears to entail limited risk. Previous studies on body weight and mortality in elderly individuals have often focused on obesity and mainly assessed total mortality. Cause-specific mortality beyond cardiovascular diseases (CVDs) has rarely been addressed. Several reports have found increased mortality in underweight individuals, but this association in elderly people has not been fully explained. Thus, there is a need for additional studies with special attention to the lower weight categories.
We explored the associations between BMI, WC and mortality in elderly men and women based on two large population-based Norwegian studies.
Methods
Study population
The fourth Tromsø Study was carried out in 1994–1995 and the second North-Trøndelag Health Study (HUNT) in 1995–1997. Tromsø is a medium-sized town in northern Norway and North-Trøndelag is a mostly rural county located in central Norway. All inhabitants in the eligible age group were invited to the studies. A total of 19 515 men and women (15 250 from North-Trøndelag and 4265 from Tromsø) aged 65 years and older participated and the overall participation rate was 70.0%. We excluded participants with a follow-up time under 1 year (425 participants) and those missing information about cause-specific mortality (5 participants) or questionnaire data concerning smoking, marital status or level of education (2374 participants). Thus, the final follow-up cohort included 16711 participants. Both surveys have been previously described in detail6 7 and they used the same core variables and questions.
The regional boards of research ethics approved the surveys and each participating subject provided written informed consent.
BMI, WC and other characteristics
Height and weight were measured with participants wearing light clothes and no shoes. BMI was calculated as weight (kg) divided by height (m) squared. WC was measured horizontally to the nearest centimetre at the height of the umbilicus using a steel tape. Information about educational level, smoking habits, alcohol intake, physical activity and chronic diseases was obtained from self-reported questionnaires. Lower education was defined as primary school only. Alcohol intake was categorised into three levels (<once a month, 1–3 times/month and ≥4 times/month) and physical activity into three levels (low, medium and high). Heart disease and lung disease were defined as myocardial infarction or angina pectoris and asthma or chronic bronchitis, respectively. Data on cancer were obtained from the Norwegian Cancer Registry and data on marital status were obtained from the Population Register of Norway.
In the mortality analysis, we first divided the participants into nine categories based on BMI values (<18.5, 18.5–19.9, 20.0–22.4, 22.5–24.9, 25.0–27.4, 27.5–29.9, 30.0–32.4, 32.5–34.9 and ≥35); thereby including the standard definitions of overweight (BMI 25.0–29.9) and obesity (BMI≥30) (WHO, 2000).5 In the analyses of cause-specific mortality, we merged all BMI categories below 20 and above 30 due to the limited number of deaths for some of the disease categories. The BMI category with the most participants and the most deaths (25.0–27.4) was chosen as the reference. WC was available for all the HUNT participants and for all Tromsø participants aged 65–74 years as well as for a random sample of participants aged 75–84 years. To compare the impacts of WC and BMI on mortality, we followed a procedure similar to that described by Flegal et al8 and created WC categories that identified similar proportions of participants as each of the nine BMI categories. The cut-off for each WC category was set to the closest shift in WC value; consequently, the numbers of participants in the WC categories were not exactly identical to the numbers of participants in the corresponding BMI categories. The WC category equivalent to the 25.0–27.4 BMI category was used as the reference.
In a separate set of analyses, we modelled BMI as a continuous variable within the <25.0 (lower BMI) and ≥25.0 (higher BMI) ranges yielding HRs for each 2.5 kg/m2 difference in BMI. For ease of understanding, the HRs for the lower BMI range indicate increased risk with decreasing BMI, whereas the HRs in the higher BMI range indicate increased risk with increasing BMI. Both total and cause-specific mortality were analysed using this model. A similar method of modelling BMI was applied in a recent large study of BMI and mortality.9
Follow-up and endpoints
We linked each participant to data from the Norwegian Causes of Death Registry using a personal identification number to identify vital status. Cause of death is in Norway based on the International Classification of Diseases (ICD) system. We used the underlying cause of death. ICD-9 was used for deaths occurring up to 1996 and ICD-10 was used for deaths occurring in 1996 and thereafter. We identified10 three main categories of causes of death: CVD (ICD-9: 390–459; ICD-10: I00–I99), respiratory disease (ICD-9: 460–519; ICD-10: J00–J98) and cancer (ICD-9: 140–208; ICD-10: C00–C97). All subjects were followed for emigration or mortality from date of study enrolment until 31 December 2007. To reduce the impact of weight loss due to pre-existing serious diseases, we excluded deaths occurring during the first year of follow-up.
Statistical analyses
The differences in baseline characteristics between surviving and non-surviving participants were assessed by the χ2 test or t-test. HRs for both BMI categories and BMI modelled as a continuous variable were determined using a Cox proportional hazards regression model controlling for potential confounders. We assessed the proportional hazards assumptions by inspecting the log(−log) survival curves for the various BMI categories. Risk relationships in men and women were analysed separately. Adjustments were performed for initial age, smoking, marital status, study site and educational level. In table 1, smoking is categorised into six levels. However, because there was no difference between adjusted models with a six-level and a three-level (never, previous or current) smoking variable, the three-level variable was used for adjustment in the mortality analyses. Analyses were performed using SPSS version 17.0. A two-sided p value <0.05 was considered statistically significant.
Baseline characteristics of participating elderly men and women according to mortality status during follow-up. Participants from the Tromsø (1994–1995) and HUNT (1995–1997) studies
Results
During a mean 9.3 years of follow-up, 51.5% of the 7604 men and 39.1% of the 9107 women aged ≥65 years died. There were 7474 deaths in total (643 deaths from respiratory diseases, 3419 deaths from CVD, 1794 deaths from cancer and 1618 deaths from other diseases/conditions). The crude total mortality rates per 1000 person-years were 57.1 and 39.4 in men and women, respectively.
Baseline characteristics by mortality status during follow-up
We compared baseline characteristics of the participants according to whether they died during follow-up (table 1). Men and women who died tended to be older, not to be married and have low education. The mean BMI was also slightly lower in individuals who died and the proportion of subjects with BMI below 25.0 was substantially higher among these individuals than among the surviving group.
Total mortality and BMI
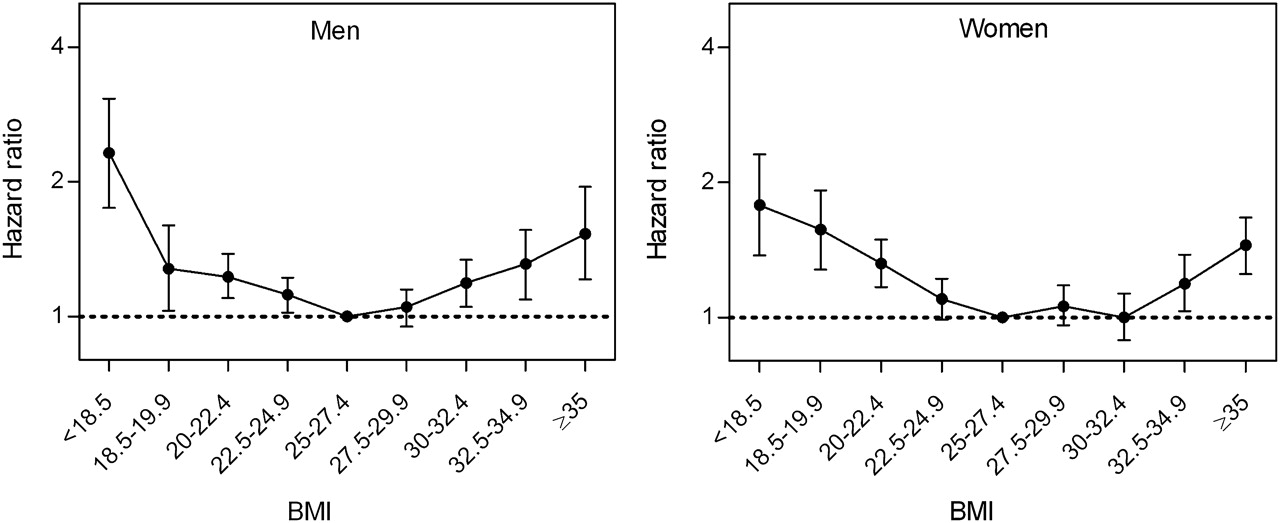
In both men and women, individuals in the 25–29.9 BMI category had the lowest mortality (table 2 and figure 1). The same relatively low mortality was observed in moderately obese women. In all BMI categories below 25.0, mortality was increased compared to the reference category. Adjustment for smoking status, educational level and marital status had only a minor impact on the risk estimates.
Adjusted HRs for total mortality by category of body mass index (BMI) and waist circumference (WC) in elderly men and women. Participants from the Tromsø (1994–1995) and HUNT (1995–1997) studies

Adjusted HRs (95% CI)* for total mortality rate by body mass index (BMI; kg/m2) category in elderly men and women. BMI 25–27.4 constitutes the reference category. *Adjusted for smoking status, age, marital status, educational level and study site.
Table 2 also shows total mortality in the various WC categories. In the lower WC categories, mortality was increased only in the lowest category. In the upper categories, the HRs were statistically significantly increased in the three highest categories in men and the highest category in women.
When modelling BMI as a continuous variable (figure 2), we found a 20% increase in mortality per 2.5 kg/m2 decrease in BMI in the lower BMI range (<25). In the upper BMI range (≥25), we found a 7–9% increase in mortality per 2.5 kg/m2 increase in BMI. There were no significant interactions between sex and BMI.
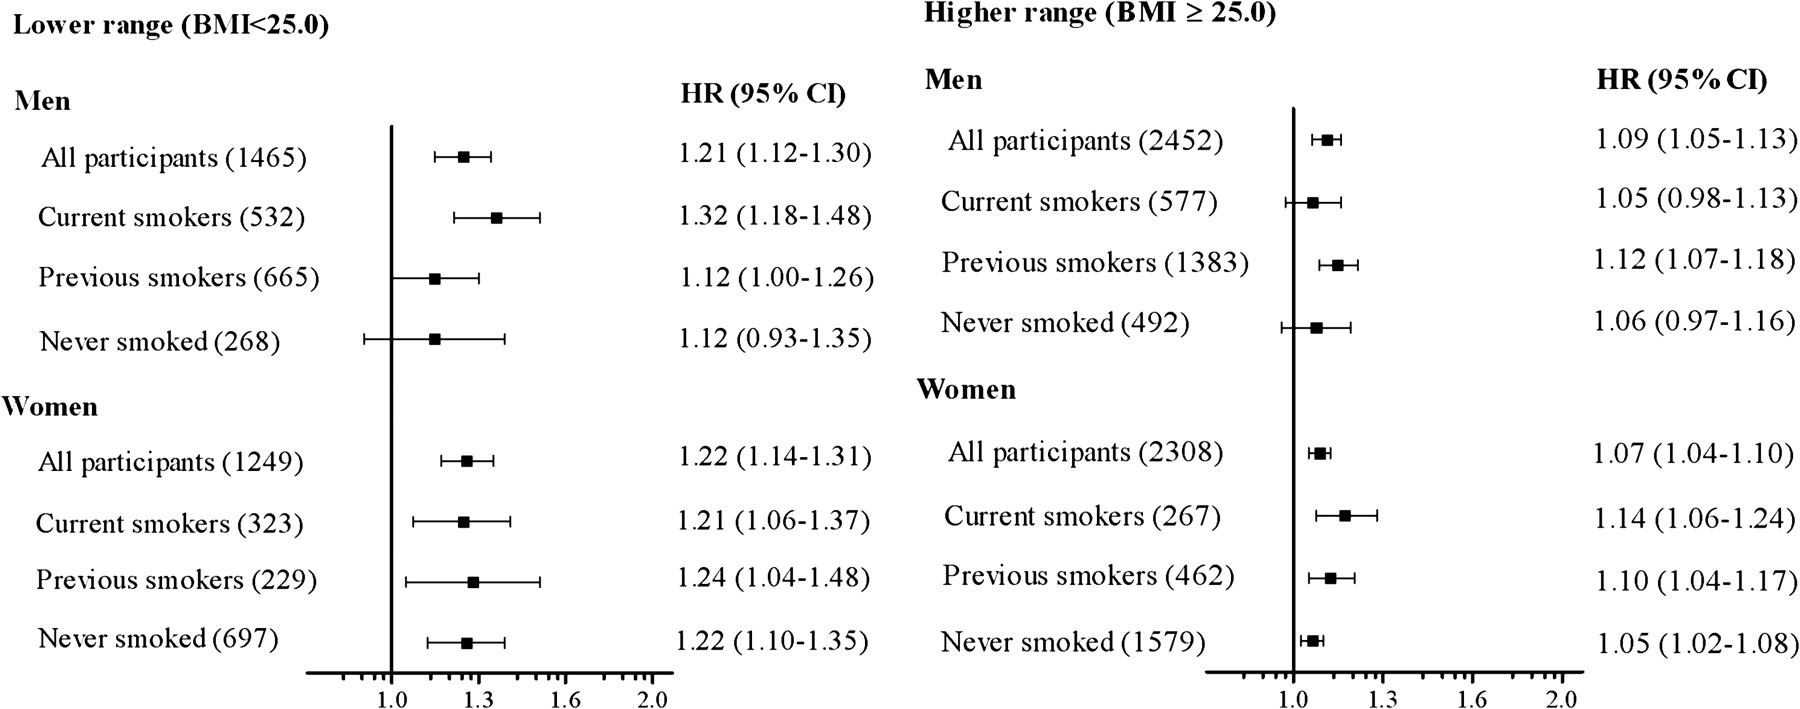
Adjusted HRs* for total mortality for every 2.5 kg/m2 difference in body mass index (BMI) in elderly men and women. In the lower range, HR indicates risk of mortality with decreasing BMI, whereas in the higher range, HR indicates risk of mortality with increasing BMI. The numbers in parentheses indicate the number of deaths in each category. Bars represent 95% CIs. *Adjusted for smoking status (all participants only), age, marital status, educational level and study site.
Information about physical activity and alcohol intake was missing for 6353 participants and 1464 participants, respectively. We repeated the analyses of total mortality and cause-specific mortality with adjustment for frequency of alcohol intake and physical activity, respectively, in the subpopulations with information concerning these two variables. However, these additional adjustments had only a minimal impact on the HRs for the relation between BMI and mortality (results not shown).
Approximately 20% of the participants were current smokers, 36% were previous smokers and 43% had never smoked. The interaction between BMI and smoking status in the analysis of total mortality was significant only for women in the higher BMI range (p=0.047); it was non-significant for men in the higher BMI range and for both men and women in the lower BMI range (figure 2).
Cause-specific mortality and BMI
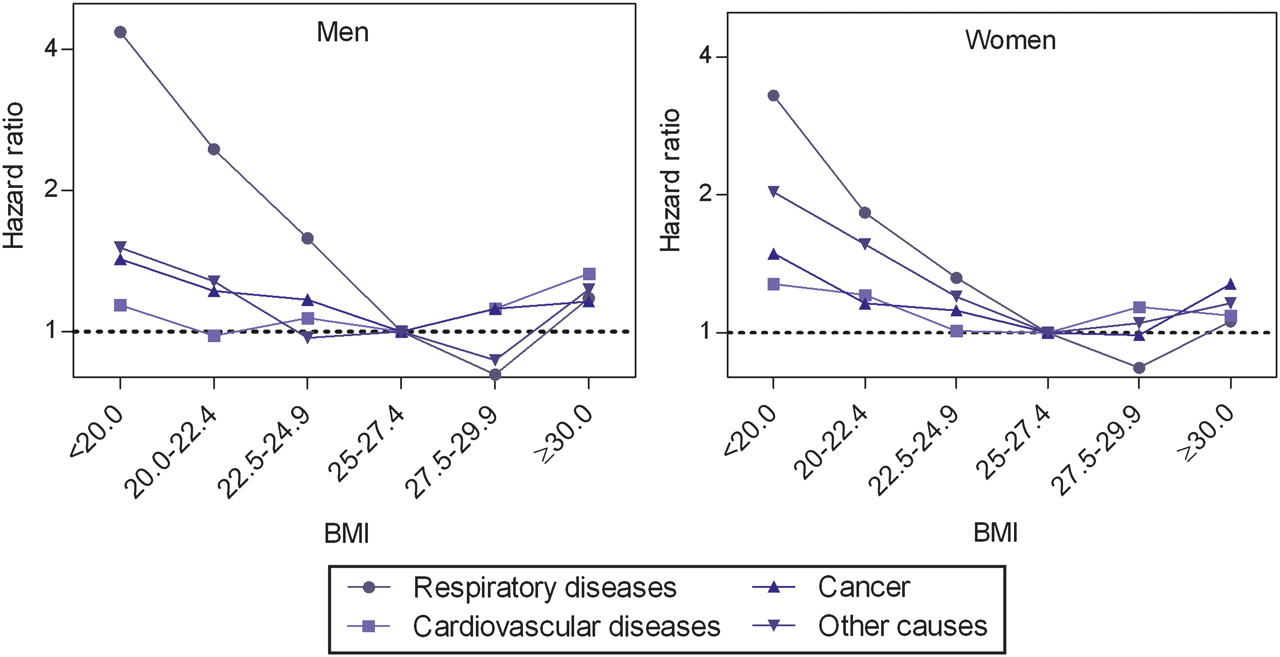
About 1 in 10 deaths was from respiratory diseases and the corresponding mortality was three to four times higher in individuals with a BMI below 20 compared to the reference category (table 3 and figure 3). Mortality was also increased in the 20–24.9 BMI range. When BMI was modelled as a continuous variable (figure 4), a 54–74% increase in mortality from respiratory diseases was observed per 2.5 kg/m2 lower BMI below 25. In women, no interaction between smoking and BMI was observed. For men in the lower BMI range who had never smoked, there was no relation between BMI and respiratory diseases mortality. However, the corresponding CI was wide due to the small number of deaths.
Adjusted HRs* for cause-specific mortality by body mass index (BMI) category in elderly men and women. Participants from the Tromsø (1994–1995) and HUNT (1995–1997) studies
Adjusted HRs* for cause-specific mortality by body mass index (BMI; kg/m2) category in elderly men and women. BMI 25–27.4 constitutes the reference category. *Adjusted for smoking status, age, marital status, educational level and study site.

Adjusted HRs* for cause-specific mortality for every 2.5 kg/m2 difference in body mass index (BMI) in elderly men and women. In the lower range, HR indicates risk of mortality with decreasing BMI, whereas in the higher range, HR indicates risk of mortality with increasing BMI. Bars represent 95% CIs. The numbers in parentheses indicate the number of deaths in each disease category. *Adjusted for smoking status, age, marital status, educational level and study site.
To further explore mortality from respiratory diseases, we analysed the associations between BMI and respiratory disease mortality in participants without lung disease at baseline. We found similar relationships as displayed in table 3 and figure 4.
The contribution of deaths from respiratory diseases was also explored by analysing total mortality excluding deaths from respiratory diseases. In the lower BMI range, we found that the HR for a 2.5 kg/m2 decline in BMI below 25 decreased from 1.21 to 1.13 in men. In women, the corresponding reduction in HR was from 1.23 to 1.19. For the categorical analyses (table 2), the overall pattern of the BMI–mortality relationship was retained when deaths from respiratory diseases were excluded. However, the HRs for mortality in the lower BMI categories were somewhat reduced, especially in men.
CVD accounted for almost half of all deaths. Increased CVD mortality was found in the higher BMI range; the effect was most pronounced in men with a BMI ≥30 (table 3; figure 3). CVD mortality was also increased in women with a BMI <22.5 kg/m2.
Cancer accounted for one-quarter of all deaths and the relationships between BMI and cancer mortality followed the ‘U-shaped’ pattern found for total mortality (table 3).
Prior to inclusion in the study, a history of heart disease was reported by 21%, lung disease by 13% and 9% of the participants had a history of cancer. Exclusion of these subjects from the analyses revealed similar relations as described for the main cohort both for total and cause-specific mortality (results not shown).
Discussion
In this population-based study of elderly men and women, we found increased total mortality in elderly individuals with a BMI below 25. No excess mortality was found in overweight individuals (BMI 25–29.9) and only a moderate increase in mortality was observed with increasing BMI in obese individuals (BMI≥30). In the lower BMI range, the strongest impact of BMI on mortality was found for deaths from respiratory diseases. These results were not explained by the presence of cancer or lung disease at baseline.
The crude mortality rates per 1000 person-years (57 in men and 39 in women) observed in the study population were lower than the expected mortality rates (73 in men and 55 in women) if the mortality rates of the entire elderly population of Norway11 were applied to the study population. This is probably explained by a better general health in the participants than in non-participating elderly individuals.
Lower BMI range
The impact of a decrease in BMI in the lower BMI range was twice the impact of the corresponding increase in BMI in the higher BMI range (figure 2). However, the most striking finding was the relative increase in mortality found in all ‘normal weight’ individuals in the BMI categories below 25.
Mortality from respiratory diseases explained about 40% of the increased total mortality found in men in the lower BMI range. For women, the corresponding figure was 17%. Previous studies of elderly individuals have demonstrated increased mortality from respiratory diseases in selected groups with a BMI below 20–22.7.12 13 We also found substantially increased mortality from respiratory diseases in the 20–22.4 and 22.5–24.9 BMI categories, which are generally regarded as healthy weight.
Asthma and chronic bronchitis are prevalent conditions associated with the lower BMI categories in elderly men and women.14 When we analysed subjects without these conditions, the impact of BMI on mortality in the lower range persisted.
Smoking is a major risk factor for both premature death15 and malnutrition16 in elderly individuals, and we adjusted all analyses for smoking status. Our results suggest that the impact of BMI ≥25 on mortality was greater in current smoking women than in women who had never smoked.
A number of studies have reported increased mortality among individuals in the lowest BMI categories.2–4 9 17 Mortality tends to increase when BMI falls below the range of 19–23. Very few studies of elderly men and women, with information about smoking habits included, have been able to demonstrate a significant increase in mortality in the normal BMI range of 22.5–24.9 compared to moderately overweight subjects. For some of the studies, this may be explained by a focus on obesity, the use of wide reference categories (BMI 18.5–25) or a limited number of participants.
Why is mortality higher in the lower BMI range?
Being underweight is associated with loss of both peripheral and respiratory muscles,18 and this association may partly explain the increases in both total mortality and mortality from respiratory diseases observed in this study among underweight participants. Furthermore, a low BMI may increase vulnerability to acute diseases. An elevated in-hospital case-fatality rate among underweight patients has been found for several conditions.19 It has been shown that the immune response is decreased in elderly malnourished individuals,20 which may increase the relative mortality rate among underweight elderly subjects during intercurrent diseases.
Reverse causation—that is, the possibility that pre-existing illnesses or conditions associated with increased mortality lead to loss of body weight—is a concern in studies of lower BMI and mortality.21 22 To overcome this problem in our analyses, we used several methods. First, we excluded deaths occurring during the first year of follow-up. Second, we repeated the analyses of mortality excluding participants with a history of cancer at baseline as these patients might have reduced weight because of the disease. However, the relation between low BMI and mortality was not influenced by this exclusion. Finally, to explore the effect of underweight-associated pulmonary disease, we analysed both total mortality and mortality from respiratory diseases in individuals not reporting asthma/chronic bronchitis at baseline. Neither of these two BMI-mortality relations were significantly influenced by this exclusion.
In addition, we stratified the analyses for smoking habits (figure 2) and found that the increased total mortality in subjects with low BMI was not due to smoking. Nevertheless, some unknown bias from pre-existing diseases or conditions might have influenced the BMI–mortality relations.
Higher BMI range
The prevalence of obesity is rising in elderly individuals and the proportion of obese individuals in the present study (20.7%) was almost at the level found in US populations in the same period.23 We found moderately increased mortality in obese individuals—more so in men than in women. Most previous studies have found increased mortality in obese elderly individuals, but the increase was somewhat less pronounced than in middle-aged adults.4
Using BMI alone for assessment of obesity may be a limitation because it provides only an indirect estimate of abdominal adiposity. In the present study, WC as a measure of abdominal obesity was also recorded in a subset of the participants. However, overall, WC was not a stronger risk factor for total mortality than BMI in the higher weight categories. This finding is in line with the results of a recent study by Flegal et al.8 In the lower weight categories, BMI was a stronger risk factor than WC.
Several explanations have been proposed for the limited impact of overweight or obesity on mortality in this age group.3 Possible explanations include a healthy survival effect in obese individuals meaning that those most vulnerable to the effects of obesity have already died before reaching older age. Furthermore, elderly people have a shorter life expectancy. Obesity-related consequences develop slowly and before these consequences appear, individuals who become obese later in life may die from other diseases.24
Optimal body weight
We found the optimal weight with the lowest mortality to be in the overweight categories (BMI 25–29.9), whereas moderately obese individuals had only a modest increase in mortality. This finding is in line with several previous studies of elderly individuals25 and has been described as the ‘obesity paradox’.24 It has also been observed that moderate overweight hospitalised elderly patients have reduced mortality.26 These findings are important because almost half of the elderly population are overweight (BMI 25–29.9) and it is frequently assumed that these individuals have increased mortality.24
One strength of the present study is the strictly population-based design with inclusion of individuals from both urban and rural areas. Some previous studies in this field have used cohorts based on particular professional affiliations or health insurance membership, introducing the possibility of bias.13 Furthermore, in the present study, height, weight and WC were measured rather than self-reported. The participation rate was relatively high (70%), but participation required the ability to independently visit a research centre. It is probable that the non-participating individuals were frailer and had more co-morbidities; any potential bias would probably be in the direction of more conservative estimates.
Conclusion
Our results show that in elderly men and women, a BMI below 25 was associated with increased total mortality. In men, this finding could be explained to some extent by an increased risk of death from respiratory diseases. A modest increase in mortality was found with increasing BMI for obese elderly men and women. Overweight individuals, including moderately obese women, had the lowest mortality.
What is already known on this subject
The body mass index (BMI)–mortality relationship is U-shaped in both adult and elderly individuals and shifted to the right in the older age categories. Results from previous studies in elderly individuals are conflicting about the upper and especially the lower BMI cut-off points for optimal weight with regard to mortality.
There is a lack of data concerning the relationship between BMI and mortality, particularly cause-specific mortality, in the elderly and the impact of mortality from respiratory diseases on the BMI–mortality relationship.
What this study adds
In the present large study of elderly individuals from Norway, mortality was significantly increased in all body mass index (BMI) categories below 25, including the ‘normal weight’ BMI categories. The impact of decreases in BMI in the lower BMI range was twice the impact of the corresponding increases in BMI in the higher BMI range. In men, this finding could be explained to some extent by increased mortality from respiratory disease.
Waist circumference and BMI performed approximately equally in identifying individuals in the higher weight categories with increased mortality.
More attention should be given to elderly individuals in the lower BMI categories and moderately increased BMI (25–29.9) should not be a concern with regard to mortality in this age group.
Acknowledgments
The Tromsø 4 Study was carried out as a collaboration between the National Health Screening Service and the Department of Community Medicine, University of Tromsø. The Second Nord-Trøndelag Health Survey was a collaboration between the HUNT Research Centre, Faculty of Medicine, Norwegian University of Science and Technology (NTNU), Levanger, the Norwegian Institute of Public Health and North-Trøndelag County.
References
Footnotes
Funding Centre for Research in the Elderly, The Northern Regional Health Authority, Helse Nord RHF, 8038 Bodø, Norway.
Competing interests None.
Ethics approval This study was conducted with the approval of the Regional Committees for Ethics in Medical Research, Tromsø and Trondheim, Norway, and by the Norwegian Data Inspectorate.
Provenance and peer review Not commissioned; externally peer reviewed.