Article Text

Abstract
Objectives: To see if obesity, deaths from diabetes, and daily calorie intake are associated with income inequality among developed countries.
Design: Ecological study of 21 developed countries.
Countries: Countries were eligible for inclusion if they were among the top 50 countries with the highest gross national income per capita by purchasing power parity in 2002, had a population over 3 million, and had available data on income inequality and outcome measures.
Main outcome measures: Percentage of obese (body mass index >30) adult men and women, diabetes mortality rates, and calorie consumption per capita per day.
Results: Adjusting for gross national per capita income, income inequality was positively correlated with the percentage of obese men (r = 0.48, p = 0.03), the percentage of obese women (r = 0.62, p = 0.003), diabetes mortality rates per 1 million people (r = 0.46, p = 0.04), and average calories per capita per day (r = 0.50, p = 0.02). Correlations were stronger if analyses were weighted for population size. The effect of income inequality on female obesity was independent of average calorie intake.
Conclusions: Obesity, diabetes mortality, and calorie consumption were associated with income inequality in developed countries. Increased nutritional problems may be a consequence of the psychosocial impact of living in a more hierarchical society.
- BMI, body mass index
- GNI, gross national income
- income inequality
- obesity
- socioeconomic factors
Statistics from Altmetric.com
Obesity is increasing rapidly throughout the developed world. In some countries rates have doubled in just a few years1,2 and over a quarter of the adult population are estimated to have a body mass index (BMI) of greater than 30. Obesity has serious consequences for morbidity and mortality, conveying an increased risk of diseases, including hypertension, type II diabetes, cardiovascular disease, gallbladder disease, and some cancers.3
The rapid changes in the prevalence of obesity point to environmental causes, although genetic factors may still affect individual susceptibility. Important causes of obesity include over-consumption of low cost energy dense foods and lack of physical activity, behaviours that are influenced by a range of economic and social factors.4 Public health policy makers have focused on the role of food labelling and marketing, and access to opportunities for physical exercise. Less attention has been paid to the psychosocial factors that may influence health related behaviour.2,5,6 At the individual level much research has focused on the role of stress in the aetiology of obesity.7–9 If stress plays a key part, then the enormous variation in the prevalence of obesity between countries suggests that in some societies people are more stressed than in others.
During the epidemiological transition, in which chronic diseases replaced infectious diseases as the leading causes of mortality, obesity changed its social distribution—where once the rich were fat and the poor were thin, in developed countries these patterns are now reversed.10 Studies in Latin America and the Caribbean show that among the poor in countries going through this transition both malnutrition and obesity may occur in the same family.11 The MONICA study, covering 39 centres in 26 countries, shows that as rates of obesity have increased, their social gradient has steepened.12 By the early 1990s obesity was more common among poorer women in all these centres, and among poorer men in all except five. As Polly Toynbee wrote in a recent Guardian article: “Fat is a class issue”.13 Pointing to the high rates of obesity in the United States of America and the low rates among the Scandinavian countries, she suggested that income inequality plays a causal part, a statement that has attracted considerable controversy.
Income inequality has been associated with numerous negative health and psychosocial outcomes, such as lower life expectancy, higher homicide rates, and lower self rated health.14 The psychosocial stress of life near the bottom of a steeply hierarchical society is a suggested explanation for these associations. We decided to test whether income inequality is associated with increased rates of obesity and to look at associations with one of its causes—higher calorie consumption—and one of its consequences—diabetes mortality—in developed countries.
METHODS
Eligibility criteria for inclusion in this study were: being among the top 50 countries with the highest gross national income (GNI) per capita by purchasing power parity in 2002 (range: $10 820–$36 690); having population over 3 million (to exclude tax havens such as the Cayman Islands); having available data on income inequality, and population based estimates of obesity prevalence for 1990 or later. There were 21 eligible countries: Australia, Austria, Belgium, Canada, Denmark, Finland, France, Germany, Greece, Ireland, Italy, Japan, Netherlands, New Zealand, Norway, Portugal, Spain, Sweden, Switzerland, the UK, and the USA.
Income inequality
Data on income inequality came from the United Nations Development Program Human Development Indicators.15 Income inequality was measured as the ratio of the income share of the richest 20% of the population to the income share of the poorest 20% in the 1990s. The ratio ranged from 3.4 in Japan, the most equal country, to 9.0 in the USA, the most unequal. Gini coefficients of inequality from the same source were also investigated. The Gini coefficient is a measure of income inequality that varies between 0 (equality) and 1 (maximum inequality).16
Outcomes
Data on the proportion of the male and female population who are obese (BMI >30) came from the International Obesity TaskForce, an organisation of the International Association for the Study of Obesity.17 Diabetes mellitus mortality rates per 1 million population came from the World Health Organisation Mortality Database.18 The extent to which diabetes is identified as a cause of death depends on medical orthodoxy, however the WHO makes adjustments to mortality data to account for incompleteness and miscoding. Calorie intake per capita per day came from the Organisation for Economic Co-operation and Development (OECD) Health Database.19 The calorie intake data are population averages, for most countries the time series begins in the early 1980s and runs through the late 1990s. We chose to examine diabetes mortality, in addition to obesity, to establish the coherence of any association with income inequality, and caloric intake as an indicator of a possible mechanism. Although diabetes mortality includes deaths from type I diabetes, which is less associated with obesity than type II diabetes, diabetes mortality rates are more directly related to obesity than deaths from other causes consequential to obesity, such as cardiovascular disease, which has a more complex aetiology.
Per capita income
GNI per capita (converted to US dollars using “purchasing power parities” to reflect price differences) was drawn from the World Bank World Development Indicators.20
Statistical methods
We computed Pearson correlation coefficients to measure the associations between income inequality and obesity, diabetes mortality, and calorie intake, adjusting for GNI per capita. Primary results are presented unweighted for population size. We also present population weighted analyses. Multiple linear regression models were used to estimate the magnitude of associations between income inequality and obesity and diabetes mortality, as well as to examine whether or not calorie intake mediated any relation between income inequality and obesity. All models adjusted for absolute income per capita (GNI per capita) and those that included obesity were sex specific.
RESULTS
The percentage of obese men in the population ranged from 1.9% in Japan to 29% in Greece, with a mean of 14.9% (SD = 6.4). For women, Japan had the lowest percentage of obese women, 2.9%, and the USA had the highest, 34%, with a mean of 16.0% (SD = 6.9). Diabetes mortality rates per million persons ranged from 55 in Greece, to 316 in Italy; the mean was 182 (SD = 70). Calories per capita per day were lowest in Japan (2767) and highest in Austria (3753), with a mean of 3395 (SD = 254).
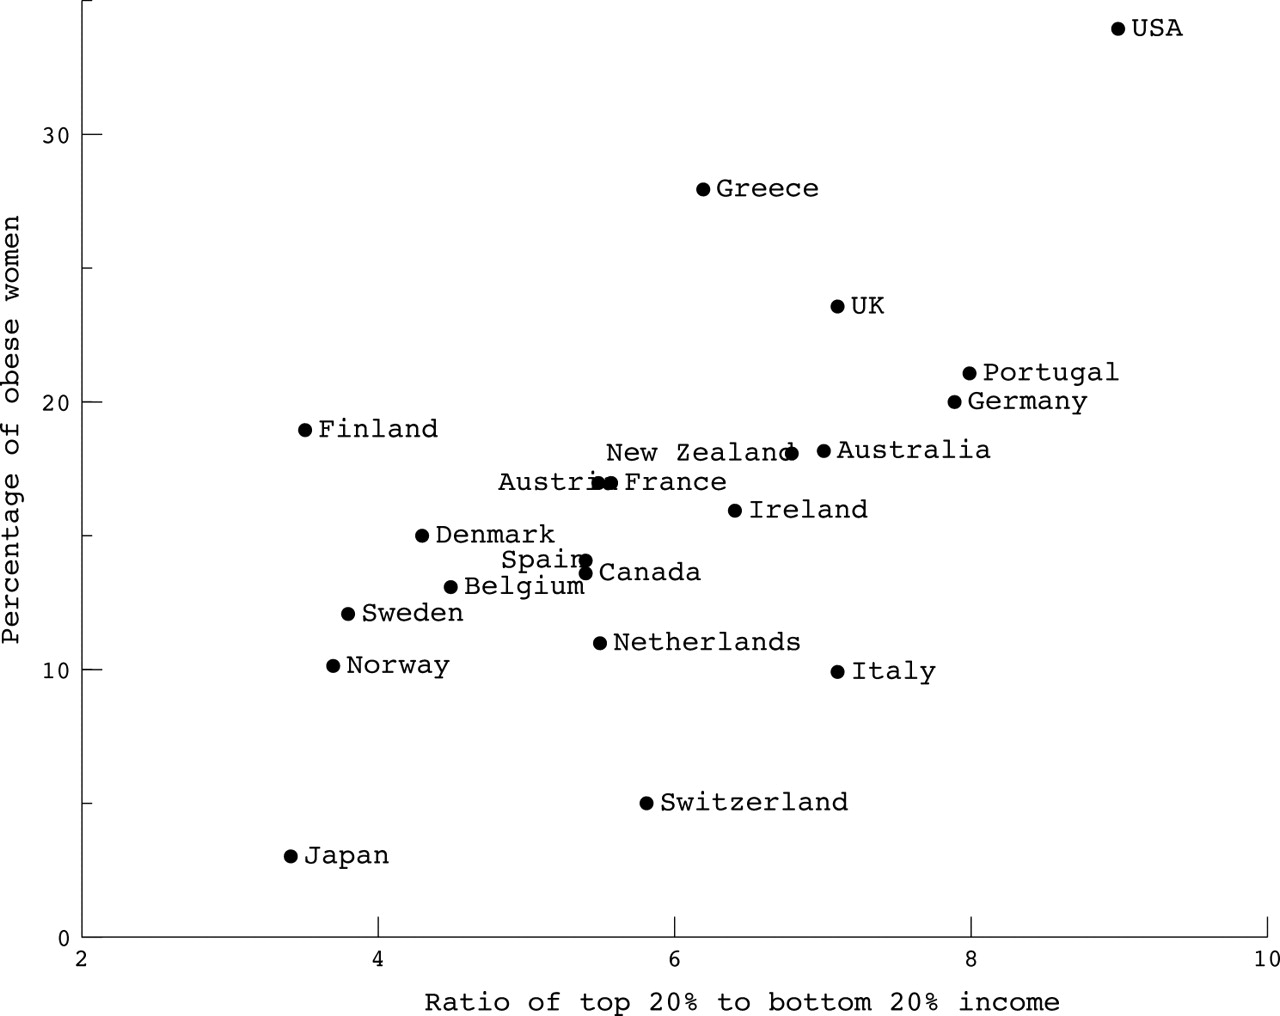
The Pearson correlation coefficients we present first are for the unweighted analyses, with the results for the weighted analyses presented in parentheses. The correlation between income inequality and male obesity was 0.48, p = 0.03 (weighted r = 0.84, p<0.001), see figure 1. For female obesity the correlation was 0.62, p = 0.003 (weighted r = 0.85, p<0.001), see figure 2. The correlation for income inequality and diabetes mortality rate was 0.46, p = 0.04 (weighted r = 0.79, p<0.001) and for income inequality and calorie intake per capita per day it was 0.50, p = 0.02 (weighted r = 0.69, p = 0.001). Results were similar if the Gini coefficient was used instead of the ratio of the top 20% to the bottom 20% of income.

The relation between male obesity and income inequality in 21 rich countries.
The relation between female obesity and income inequality in 21 rich countries.
In the multiple linear regression analyses the effects of income inequality on obesity were attenuated by calories per capita per day but unaffected by GNI per capita. However, among women, but not among men, and in all weighted analyses, income inequality remained statistically significantly associated with obesity. In these models, GNI per capita was not significantly associated with either male or female obesity. In unweighted analyses, for every unit increase in the ratio of the top 20% to the bottom 20% of income the percentage of obese men in the population increased by 1.34% (2.97% in weighted model) and the percentage of obese women rose by 2.10% (3.25% in weighted model).
What is already known on this topic
-
Although many studies have shown that more unequal societies tend to have worse health this remains a controversial issue.
-
In developed countries rates of obesity are highest among the poor and social gradients are becoming steeper.
-
Relations have been reported between income inequality and abdominal weight gain in men and higher BMI in women in the 50 USA states
What this study adds
-
The proportion of the population with BMI >30 is related to income inequality across 21 developed countries among both men and women.
-
The prevalence of obesity within developed countries is unrelated to average income.
-
The association between income inequality and obesity is independent of calorie intake per capita in women.
-
The psychosocial effects of social position or relative income may contribute to behavioural and/or physiological processes leading to obesity.
DISCUSSION
Among developed countries for which data are available, income inequality was significantly related to obesity among men and women, diabetes mortality and average calorie intake, both before and after controlling for GNI per capita, whether or not countries were weighted for population size. Controlling for calorie intake attenuated the association between income inequality and obesity, particularly among men.
Although we are unaware of other international studies of income inequality and obesity, our findings are consistent with studies within the USA, which have shown associations between state level income inequality and abdominal weight gain in men,21 odds of sedentary lifestyles among both men and women and higher BMI among women.22 In the latter study, BMI among the poor was particularly associated with income inequality.
Strengths and weaknesses of the study
Strengths of this study include the large number of developed countries and the systematic application of inclusion criteria. The potential confounding effect of absolute income levels is an unlikely explanation of our findings, as we adjusted analyses for GNI per capita. The parallel relations between income inequality and both average calorie intake (a contributor to obesity) and diabetes mortality (a consequence of obesity) increases confidence that the association between income inequality and obesity is real.
Nevertheless, our study has some limitations. Societal variables, such as income inequality, require analysis at an ecological level. In our study we are addressing the question of whether or not societies with wider income differences have higher population rates of obesity. Given adequate data, a multilevel longitudinal analysis would allow for the separation of societal and individual influences on obesity and provide more insight into possible causal processes.
Policy implications
Public policies promoting greater equality and reducing the burden of low social status may make an important contribution to reducing and preventing obesity. Relative deprivation may influence the effectiveness of policies designed to promote good nutrition and physical activity.
Although we have used the most comprehensive source of international data on obesity, based on nationally representative samples, data collected in different countries may vary in quality and limit the generalisability of our study. The same is true for data on per capita daily calorie consumption. However, we have no reason to suspect that measurement error in these variables would vary systematically with income inequality, (although they might well vary systematically with levels of GNI per capita), and therefore our findings are likely to be conservative, rather than inflated.
Central obesity (high waist:hip ratio) particularly has been linked to poor health outcomes and chronic stress is a risk factor for this pattern of fat distribution. Without data on waist:hip ratio we were unable to examine this aspect of obesity in our study and it remains an interesting area for future research.
Interpretation
Our results and previous research22 suggest that the pathways relating obesity to inequality are likely to include total calorie intake and physical activity. In addition there may be direct psychosocial effects on central obesity and it is possible that the nutritional composition of the foodstuffs providing the calories may play a part. However, the psychosocial effects of inequality may be particularly important because they can influence all other pathways: sedentarism, calorie intake, food choice, and the physiological effects of stress.
In the MONICA study the social gradient in obesity has increased in almost all countries between 1979 and 1996.12 Interestingly, of the 11 countries included in both our study and the MONICA study; the USA had the steepest social gradient in obesity and greatest income inequality, and Sweden the smallest of each. The relation between obesity and income inequality, coupled with the evidence of an increasing tendency for obesity rates to be highest among the poor, suggests that psychosocial factors related to social position or relative income may be more important than absolute living standards. The fact that the relation between income inequality and obesity is stronger among women than among men in our study is paralleled by findings among the 50 states of the USA22 and the more consistent social gradient in obesity among women than men found in the MONICA data.12
This raises the familiar issue of the merits of individual compared with societal approaches to health. Underlying any interpretation of the influence of inequality must be the “obesogenic” environment of lower levels of physical activity and the wider availability of cheap, energy dense foods6,23 that seem to overwhelm normal appetite controls.24 Although structural factors involving the promotion and pricing of such foods are likely to partially explain the social distribution of obesity, it is not clear that these will vary with income inequality. Given that there are social gradients not only in diet and exercise,10 but also in other health related behaviours as well as in a range of social problems associated with relative deprivation—such as violence, teenage pregnancy, and poor educational performance—there is an explanatory choice to be made. Should we look for quite separate explanations for the social gradient in each, or does low social status have psychosocial effects that contribute to the gradient in many different outcomes? Low social status is for instance likely to increase anxiety and stress levels and to reduce people’s ability to exercise control over their lives.25 If greater inequality deepened or broadened such effects—as some of the evidence suggests26—many of the associated problems would also be exacerbated.14
The US surgeon general has called for a multifaceted public health approach to obesity prevention that focuses “on health rather than appearance” and empowers individuals and communities to “address barriers, reduce stigmatization”.27 What he means is that there is a societal responsibility to provide safe, accessible opportunities for physical activity, healthy food choices and PE in schools, to promote breast feeding and nutrition education. The International Obesity TaskForce has called for a similar approach to be adopted in Europe.2 What these approaches overlook are the reasons why people continue to live a sedentary lifestyle and to eat an unhealthy diet, and how these behaviours provide comfort.
Because the behaviour changes needed to improve health or reduce obesity are easier for people who feel in control and in good psychosocial condition28 lessening the burdens of low social status and relative poverty may make an important contribution both to better health and to a reduction of obesity.
Governments cannot avoid influencing income distribution, for better or worse, through a wide range of policies, including taxes and benefits, management of the national economy, unemployment levels, education policies, minimum wages, and so on. Policies that promote equality may be just as vital for public health as those that promote economic growth. Public policies designed to improve nutrition education and healthy food choice, tackle food labelling and marketing, school meals, transport policies, and opportunities for exercise may work best when supported by policies to promote greater equality.
REFERENCES
Footnotes
-
Funding: none.
-
Competing interests: none.
-
Ethics approval: no ethical approval was needed for this ecological study.
Linked Articles
- In this issue