Article Text

Abstract
Background: In Australia, studies finding an association between area-level socioeconomic disadvantage and mortality are often based on aggregate-ecological designs which confound area-level and individual-level sources of socioeconomic variation. Area-level socioeconomic differences in mortality therefore may be an artefact of varying population compositions and not the characteristics of areas as such.
Objective: To examine the associations between area-level disadvantage and all-cause mortality before and after adjustment for within-area variation in individual-level socioeconomic position (SEP) using unlinked census and mortality-register data in a multilevel context.
Setting, participants and design: The study covers the total Australian continent for the period 1998–2000 and is based on decedents aged 25–64 years (n = 43 257). The socioeconomic characteristics of statistical local areas (SLA, n = 1317) were measured using an index of relative socioeconomic disadvantage, and individual-level SEP was measured by occupation.
Results: Living in a disadvantaged SLA was associated with higher all-cause mortality after adjustment for within-SLA variation in occupation. Death rates were highest for blue-collar workers and lowest among white-collar employees. Cross-level interactions showed no convincing evidence that SLA disadvantage modified the extent of inequality in mortality between the occupation groups.
Conclusions: Multilevel analysis can be used to examine area variation in mortality using unlinked census and mortality data, therefore making it less necessary to use aggregate-ecological designs. In Australia, area-level and individual-level socioeconomic factors make an independent contribution to the probability of premature mortality. Policies and interventions to improve population health and reduce mortality inequalities should focus on places as well as people.
- ABS, Australian Bureau of Statistics
- ASCO, Australian Standard Classification for Occupations
- ASGC, Australian Standard Geographical Classification
- IRSD, index of relative socioeconomic disadvantage
- SEP, socioeconomic position
- SLA, statistical local area
- SSD, statistical subdivision
Statistics from Altmetric.com
- ABS, Australian Bureau of Statistics
- ASCO, Australian Standard Classification for Occupations
- ASGC, Australian Standard Geographical Classification
- IRSD, index of relative socioeconomic disadvantage
- SEP, socioeconomic position
- SLA, statistical local area
- SSD, statistical subdivision
Although it has long been known that individual-level socioeconomic position (SEP) is associated with mortality, in the past decade or so, researchers have turned their attention to the question of whether the socioeconomic characteristics of places are also important.1–3 Multilevel analysis is increasingly being used to investigate this issue,4–6 and the findings of most studies suggest that area-level socioeconomic disadvantage increases mortality risk over and above an individual’s own SEP.7,8,9,10
We identified 16 Australian studies that had investigated the association between an area’s socioeconomic characteristics and its mortality and/or morbidity profile, and all found mortality and poorer health in disadvantaged areas.11–26 Each of these studies used an aggregate ecological design, the conceptual and statistical problems of which are well documented.27,28 Ecological studies that use data aggregated to a single geographical scale cannot provide a quantification of the variation between areas in terms of their mortality profiles, and then, more importantly, indicate whether the variation is probably due to the clustering of individuals (ie, a composition effect) or the environmental characteristics of the areas as such (ie, a context effect). Thus, even though previous Australian studies found higher mortality in disadvantaged areas, this does not mean that areas as such are important in terms of influencing the probability of death of the area’s residents. Ecological studies leave open the possibility that geographical variations in mortality are an artefact of varying population compositions, and unless these are taken into account (which aggregate studies cannot do), individual-level and area-level sources of variation remain confounded.29 It is therefore an open question as to whether places are important (independent) determinants of mortality in Australia.
International studies investigating the multilevel relationship between area disadvantage and mortality are usually based on designs that involve linking census data9,30–34 or survey data 7,10,35,36 to death records contained in mortality registers. In Australia, legislation related to privacy and confidentiality effectively prohibits the first type of study, and there are no known area-based population surveys that would facilitate the second approach. These two factors may explain why area-based studies of inequality in mortality in Australia have been restricted to ecological designs.
Of the 12 multilevel studies of mortality reviewed for this paper, 10 were based on designs that took account of variation in mortality at only two levels (ie, individuals and one spatial unit), and their geographical coverage was often limited to one region or city in a country. Given our limited understanding of how and at what geographical scale area-level factors influence mortality, many of these studies possibly overestimated the mortality variation at level 2 because variation between spatial units at higher or lower levels of aggregation were unaccounted for. Multilevel studies that are more inclusive of multiple geographical scales are clearly needed to investigate this issue.29
We describe the first known multilevel investigation of the relative contribution of area-level and individual-level socioeconomic factors to all-cause mortality in Australia using a method that does not require record linkage, or use an ecological approach. Moreover, our study is based on a five-level design, thus allowing us to capture mortality variation at many different geographical scales, and it covers the whole of the Australian continent. The dataset pertains to men and women aged 25–64 years for the period 1998–2000, and uses the four primary spatial units comprising the Australian Standard Geographical Classification (ASGC)—states/territories, statistical divisions, statistical subdivisions (SSD) and statistical local areas (SLA).37 Using SLA as the primary focus (but taking into account mortality variation at each of the other levels) we deal with three questions using a sex-stratified analysis:
-
What is the relationship between area-level socioeconomic disadvantage and mortality before and after adjustment for within-SLA variation in individual-level SEP (ie, occupation)?
-
Does the relationship between occupation and mortality differ by area-level socioeconomic disadvantage?
-
What is the variation in all-cause mortality at each of the four geographical levels comprising the ASGC before and after adjustment for within-SLA variation in occupation and between-SLA variation in area disadvantage?
SLA are often based on the incorporated bodies of local governments and councils, and these are responsible for service and infrastructure provision at the local and regional level; hence, SLA are spatial entities that are likely to be socially and economically relevant to their residents. On the basis of the findings of international studies,7,8,9,10 we hypothesise that living in socioeconomically disadvantaged SLA will be associated with a higher probability of mortality independent of its occupational composition. If confirmed, this relationship will suggest that SLA in Australia are differentiated on the basis of area-level factors important for health, and that disadvantaged SLA are less conducive to the attainment and maintenance of good health. By extension, confirmation of the hypothesis will also suggest that policies and programmes to improve population health and reduce mortality inequalities should focus on places as well as people.
METHODS
Analytical approach and units of analysis
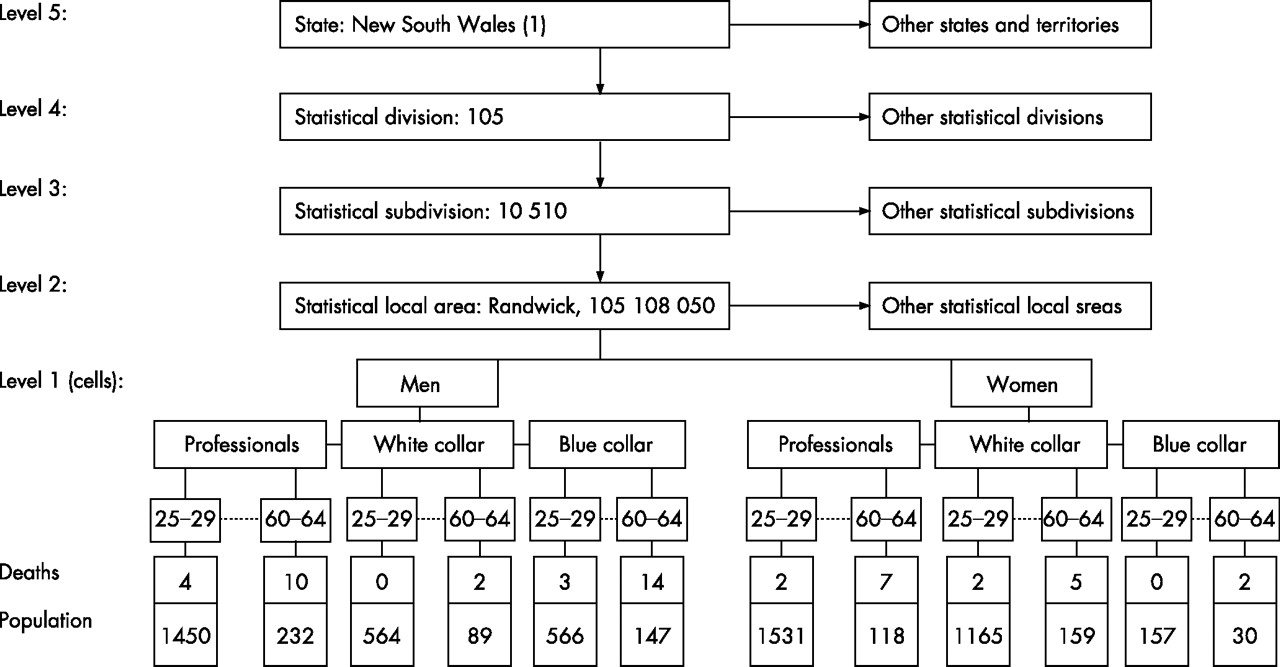
We compiled a 5-level structure comprising cells at level 1 which were nested in SLA at level 2, nested in SSD at level 3, nested in statistical divisions at level 4 and nested in states/territories at level 5. Figure 1 presents a diagrammatic representation of the data structure.

Diagrammatic representation of the multilevel data structure.
Cells consist of individuals grouped as types (eg, male professionals aged 60–64 years) and each cell contains the number of deaths for all causes that occurred during 1998–2000 (numerator) and the estimated population counts in 1996 corresponding to the sex/occupation/age profile of each particular cell (denominator). Mortality in each cell is expressed as a proportion—that is, the number of deaths in each sex/occupation/age group relative to the population in each subgroup: this proportion forms the outcome variable. The other four levels comprise spatial units from the ASGC to which mortality data are coded. SLA aggregate to form SSD, which in turn aggregate to statistical divisions and these form states and territories. Each of these spatial units covers the whole of Australia without gaps or overlaps.
In 1996, the ASGC comprised 1336 SLA, 194 SSD, 66 subdivisions and 9 states and territories. Of the 1336 SLA, we excluded 7 special areas defined as “Offshore, Shipping and Migratory” (eg, people who were living on offshore oil rigs, drilling platforms, on ships between Australian ports, or in transit on trains, buses or aircraft) and 12 SLA with small populations and thus not assigned an area-level socioeconomic score by the Australian Bureau of Statistics (ABS). The final data structure used in this analysis consisted of 9 states and territories (100%), 59 statistical divisions (89.4%), 187 SSD (96.4%) and 1317 SLA (98.6%).
Data
Unit record mortality data were obtained from the ABS, the national statutory authority that compiles death statistics from information made available by the registrars of births, deaths and marriages in each state and territory. Population data pertaining to age, sex and occupation were also obtained from the ABS, and comprised the 1996 census for men and women aged 25–64 years in 5-year age groups.
During the period 1998–2000, there were 47 067 deaths from all causes among men and 26 053 deaths among women. Decedents who did not have an occupation at the time of death, or whose occupation was unknown or could not be ascertained due to insufficient information, and those who could not be assigned a place of usual residence before death, were excluded from the analysis. The final dataset consisted of 43 257 death records and 5 995 661 population counts (table 1).
Description of the data used for the multilevel analysis
Measurement of area-level disadvantage
Area-level disadvantage for each SLA was measured using its index of relative socioeconomic disadvantage (IRSD) score. IRSD scores are derived by the ABS and they reflect the overall level of disadvantage of an area measured on attributes such as low income, low educational attainment, high levels of public-sector housing and high unemployment.38 The IRSD scores were calculated using data from the 1996 Australian Census. For analysis, we ranked the 1317 SLA on the basis of their IRSD scores and categorised them into quintiles such that Q1 contained the 20% least-disadvantaged areas and Q5 the 20% most disadvantaged.
Measurement of occupation
Occupation data forming the numerator pertain to the decedent’s job at the time of death, whereas occupation information forming the denominator pertains to the main job held in the previous week. Both sources of occupation information were coded by the ABS to the first edition of the Australian Standard Classification of Occupations (ASCO).39 ASCO is a skill-based measure that groups together occupations requiring similar levels of education, knowledge, responsibility, on-the-job training and experience, and comprises eight occupation categories:
-
managers and administrators,
-
professionals,
-
para-professionals,
-
tradespersons,
-
clerks,
-
salespersons and personal service workers,
-
plant and machine operators and drivers and
-
labourers and related workers.
We recoded the ASCO measure into three categories for analysis: managers and professionals (1–3), white-collar employees (5 and 6) and blue-collar workers (4, 7 and 8). Similar three-level classifications have been used in previously published Australian articles40,41 and reports on population-health monitoring,42 and the classification is sufficiently sensitive to discriminate between occupation groups in terms of a range of health and social outcomes.
Analysis
The data were analysed using MLwiN V.2.1c.43 Specifically, we fitted a multilevel binomial logit-link model with the predictive-penalised quasi-likelihood procedure and second-order linearisation, using the iterative generalised least squares algorithm.44 As proportions are not always best represented as a binomial distribution owing to overdispersion or underdispersion,45 allowance for this was made by using the extra binomial distribution assumption in MLwiN.
A five-level random coefficient model was used to examine the association between area-disadvantage and mortality (model 1), occupation and mortality (model 2) and simultaneous adjustment for both disadvantage and occupation (model 3). The regression output for each of these models is expressed as mortality per 100 000 population (relative to a reference age group of 50–54 years), and mortality risk ratios (RRs) and their 95% confidence intervals (CIs). This analysis was extended to test for cross-level interactions between area-level disadvantage and occupation (model 4); these examine whether relative differences between occupation groups in their probability of mortality vary across the IRSD quintiles. The extent of area variation in all-cause mortality was assessed initially by allowing the probability of death to vary across SLA conditional only on age-variation within SLA (model 5). This model was expanded by allowing for variation at the SSD, statistical division and state/territory levels (model 6); and further extended by adjustment for within-SLA variation in occupation and between-SLA variation in area-disadvantage (model 7) and then for a cross-level interaction between occupation and area-disadvantage (model 8). The significance of the random variation at each level was tested with “Wald-like” tests43,44 and p values were based on a χ2 distribution.
RESULTS
For both men and women, rates of all-cause mortality were highest among those who lived in the most socioeconomically disadvantaged SLA, and among blue-collar workers (table 2, models 1 and 2). For men, simultaneous adjustment for area disadvantage and occupation (model 3) resulted in a moderate attenuation of the relative mortality inequalities among the IRSD quintiles but negligible reductions among the occupation groups. For women, simultaneous adjustment for area disadvantage and occupation resulted in little change in the magnitude of the mortality inequalities for either socioeconomic indicator (model 3).
Modelling the association between area-level socioeconomic disadvantage, occupation and all cause mortality
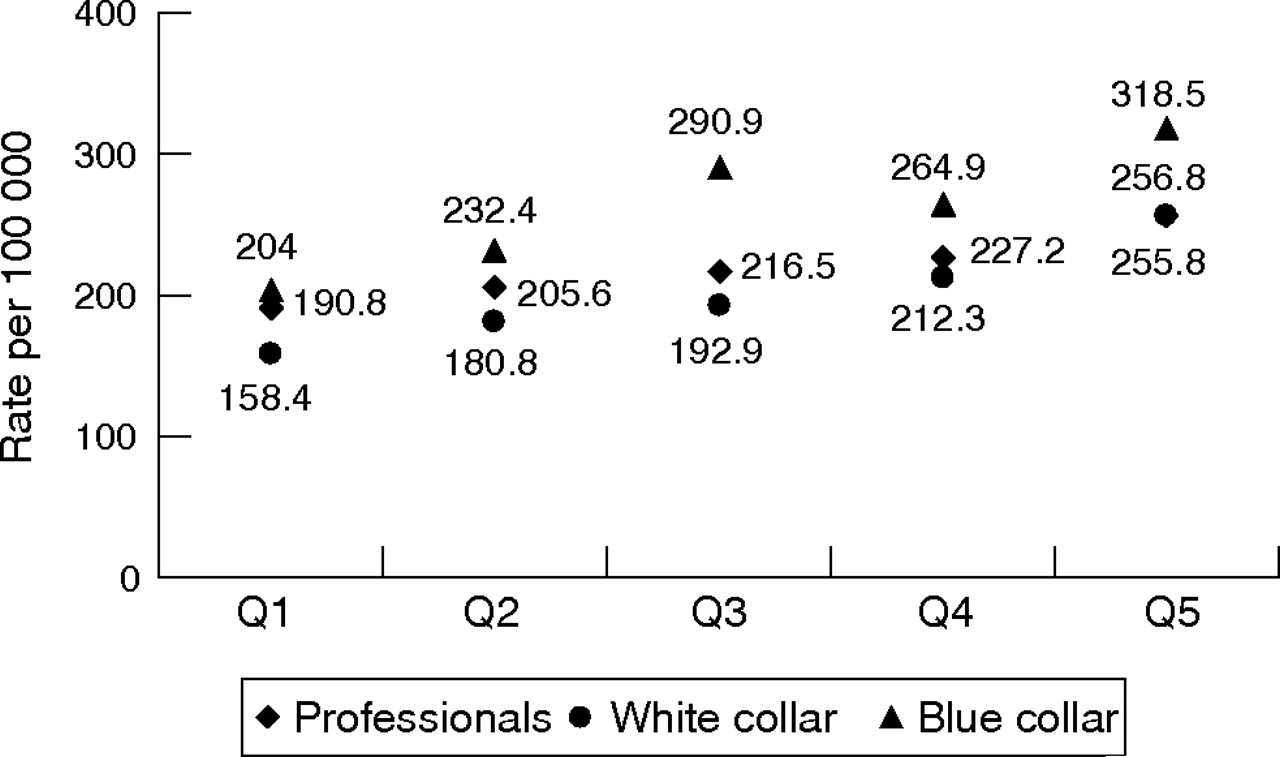
Figures 2 and 3 examine whether mortality inequality by occupation varied by area-level socioeconomic disadvantage for men and women, respectively. A joint χ2 test of the interaction terms indicated that the inclusion of cross-level interactions significantly improved model fit for both sexes (men, p = 0.017; women, p = 0.035). For men, no significant cross-level interactions were found among blue-collar workers; however, a significant interaction was found for white-collar employees living in the most disadvantaged quintile (RR 0.78, 95% CI 0.66 to 0.91). This indicates that the relative mortality inequality between professionals and white collar employees was larger in the most disadvantaged quintile (Q5) compared with the least disadvantaged (Q1), and that the mortality for white-collar employees was significantly lower than professionals in Q5, whereas there was no significant difference between these occupation groups in Q1. For women, significant cross-level interactions were found for white-collar employees living in quintile 5 (RR 1.20, 95% CI 1.03 to 1.40) and for blue-collar workers in quintile 3 (RR 1.26, 95% CI 1.04 to 1.52).

Plot of a cross-level interaction between occupation, area-level socioeconomic disadvantage and all-cause mortality per 100 000 population (model 4): men 25–64 years, 1998–2000. Q1 and Q5 = 20% most socioeconomically advantaged and disadvantaged statistical local areas in Australia, respectively.
Plot of a cross-level interaction between occupation, area-level socioeconomic disadvantage and all-cause mortality per 100 000 population (model 4): women 25–64 years, 1998–2000. Q1 and Q5 = 20% most socioeconomically advantaged and disadvantaged statistical local areas in Australia, respectively.
Table 3 shows the area variation in the probability of all-cause mortality for each of the geographical levels comprising the ASGC. In model 5, the mortality variation was constrained to the SLA level: for both men and women the SLA random term was significant (p⩽0.01) indicating that the average probability of death was not constant across the 1317 SLA. The SLA variation was larger for men. After allowing for mortality variation at the SSD, statistical divisions and state and territory levels (model 6), the variance of the SLA random term was markedly reduced: by 65.3% for men and by 85.2% for women. Moreover, Wald-like tests performed on the random terms for SSD, statistical division and states and territories indicated that the probability of death varied systematically at each of these levels (more notably so for women than for men). Model 7 extends model 6 and examines the extent of mortality variation at the SLA level after adjustment for within-SLA variation in occupation, and between-SLA differences in area socioeconomic disadvantage. For men, the SLA random term was attenuated after adjustment; however, it remained significant at p⩽0.01. Mortality variation at each of the other levels was also attenuated. For women, no significant variation was found at the SLA level (p⩽0.05) after adjustment for occupation and area disadvantage, although significant variation in the probability of mortality was evident among SSD and statistical divisions. Further adjustment for a cross-level interaction between occupation and area disadvantage (model 8) had no effect on the extent of mortality variation at any of the geographical levels for either men or women.
Area-level variation in all-cause mortality for each spatial unit comprising the Australian Standard Geographical Classification: men and women aged 25–64 years, 1998–2000
DISCUSSION
The results of this study add to a growing body of international evidence which show that living in a socioeconomically disadvantaged area significantly increases the probability of premature death over and above the socioeconomic characteristics of the residents of the areas.7,8,9,10 Specifically, we found that socioeconomically disadvantaged SLA had higher all-cause mortality even after adjustment for within-SLA variation in occupation. Importantly, our approach to structuring and analysing unlinked census and mortality data showed how this relationship could be examined in a multilevel context in countries where record linkage is not routinely conducted, using a method that makes it less necessary to rely on aggregate-ecological designs.
A further contribution of this study is that although it focused on between-area and within-area variation in mortality at the SLA level, variation at three higher geographical levels was also allowed for. In analyses that modelled only variation at the SLA level, we found that the random term was highly significant; however, its magnitude was reduced markedly when geographical variation at higher levels was accounted for. Had we therefore based our analysis on a two-level model, we would have greatly overestimated the variance at the SLA level, and by extension, overemphasised the potential contribution of SLA-level socioeconomic disadvantage (and other ecological factors) to variations in all-cause mortality. These results suggest that previous multilevel studies based on only two spatial scales 7,9,10,30–36 may have mis-estimated the magnitude of area variation in mortality.
Consistent with international46–48 and Australian studies,40,49,50 we found a strong association between occupation and mortality: compared with professionals, blue-collar workers had significantly higher mortality and white-collar employees significantly lower rates. This is the first Australian study to report on occupational mortality inequalities for women. Occupational data on female decedents were not collected on death certificates before the mid-1980s,42 and data collected in the decade immediately after were incomplete and considered too unreliable for meaningful analysis.
The cross-level interactions did not provide convincing evidence that the nature and extent of association between occupation and mortality was differentially affected by varying degrees of area-level socioeconomic disadvantage. Only 3 of 20 cross-level interactions were significant; thus, in most cases, mortality inequality between professionals, white-collar employees and blue-collar workers was similar irrespective of the socioeconomic environment. The cross-level analysis did indicate, however, that death rates for all three occupation groups increased monotonically across the socioeconomic quintiles such that they were lowest in the least disadvantaged SLA and highest in the most disadvantaged.
Our examination of mortality variation between states and territories, statistical division, SSD and SLA showed that the average probability of premature death varied systematically at each geographical scale, suggesting that contextual factors at each level made a measurable contribution to mortality. At the state and territory level, mortality variation possibly reflects historical differences in macrolevel political governance, which manifests in different policies (eg, social, economic, environmental, taxation and welfare) that either protect and promote population health or make its attainment more difficult. Understanding mortality variation at the statistical division and SSD levels is problematic, as these are primarily statistical units with no obvious social or cultural significance. SLA, by contrast, are often based on incorporated bodies of local governments and councils, hence mortality variation at this level might reflect differences in availability and access to health-related infrastructure and services (eg, recreational opportunities, public transport, housing and healthcare) or differences in local regulations and ordinances influencing such things as the number and location of take-away stores or shops selling healthy food.
Study limitations
Several data limitations and potential sources of bias need to be considered when interpreting this study’s findings. Firstly, bias is inherent in the estimates of mortality inequality owing to the numerator and denominator data arising from different sources.40,51 Numerator data pertain to the decedent’s last occupation which may not reflect their primary lifetime occupation. This information is usually provided by a relative or acquaintance and the tendency is to report jobs that are more socially desirable, or to raise (promote) the occupational position or status of the deceased. The denominator data pertain to a person’s current job, or a job held in the previous week, and these data are self-reported using a standardised collection procedure. Numerator–denominator bias tends to attenuate rather than widen occupational mortality inequalities, thus estimates reported here are likely to be smaller than the true magnitude of occupational differences in mortality in the Australian population.40
What this paper adds
-
Multilevel studies have found that area-level disadvantage increases mortality risk independent of individual-level socioeconomic position.
-
Most of these studies have been based on designs that link census or survey data to death records in mortality registers.
-
In Australia, studies on record-linkage mortality are not routinely conducted; instead, studies are usually based on aggregate-ecological designs which confound area-level and individual-level sources of variation.
-
This makes it difficult to know whether mortality differences between advantaged and disadvantaged areas are due to contextual (place) effects, or are artefacts of varying population compositions (eg, poor people living in poor places).
-
This study shows how routinely available unlinked census and mortality data can be examined in a multilevel context, thereby making ecological studies of mortality less necessary.
-
We found that the place of residence influences the probability of premature death over and above individual-level characteristics.
-
More specifically, living in a socioeconomically disadvantaged area increases the risk of early death irrespective of one’s own socioeconomic position.
Secondly, the use of the IRSD to measure area-level disadvantage was adequate in terms of quantifying the nature and extent of mortality inequality between SLA; however, composite socioeconomic indexes tell us little about the specific area-level factors that produce the inequalities. Measures such as the IRSD, therefore, are somewhat limited in terms of their capacity to inform policies and interventions to reduce health inequalities,52 although they do serve to indicate that places are important (or not) for health.
Thirdly, our finding of an association between area-level disadvantage and mortality might be confounded by individual-level socioeconomic factors not included in the models. However, we included one of the most widely used indicators of a person’s SEP (ie, occupation), and given the correlation among socioeconomic measures53 this indicator was probably capturing the unmeasured influences of other socioeconomic factors excluded from the models. Alternatively, the inclusion of occupation may have resulted in overadjustment, which argues for the possibility of an even stronger contextual effect on mortality than was observed in this study. If occupation represents part of the pathway via which area-level disadvantage influences the probability of mortality of the residents of the areas, then simultaneously modelling occupation (or other markers of SEP) may inappropriately attenuate the variation that is more correctly attributable to area-level disadvantage.6
Policy implications
-
Policies and programmes to improve population health and reduce mortality inequalities need to focus on the social and economic characteristics of places as well as people.
Fourthly, this study estimated the extent of mortality inequality among people who were economically active at the time of death (ie, full and part-time employed). Analyses based exclusively on this group, and hence exclusive of the economically inactive (eg, unemployed, working-aged on pensions and homeless), underestimate the actual extent of socioeconomic mortality in the wider population.54 Our results, therefore, represent a partial but nevertheless important picture of how all-cause mortality in Australia is patterned by individual-level SEP.
Conclusions
In Australia, the average probability of premature death varies non-randomly across each of the ASGC spatial units to which mortality data are coded; hence each level in the hierarchy seems to make an important contribution to mortality. Both SLA disadvantage and occupation independently influenced the probability of death; however, there was limited support for different socioeconomic environments having a differential effect on the extent of mortality inequality between occupation groups. Future research needs to investigate the reasons for socioeconomic differences in mortality at the area level. This is a necessary step if place-based policies and interventions to reduce mortality inequality at the individual level are to be developed and effectively implemented. Finally, we showed how unlinked census and mortality data can be used in a multilevel context to examine area-based mortality inequalities. We recommend that this method be used (where possible) instead of aggregate-ecological designs, thus avoiding the methodological and interpretative problems associated with this approach.
REFERENCES
Footnotes
-
Funding: GT is supported by a National Health and Medical Research Council/National Heart Foundation Career Development Award (CR 01B 0502) and AK is supported by a Victorian Health Promotion (VicHealth) Senior Research Fellowship. SVS is supported by a National Institutes of Health and National Heart, Lung, and Blood Institute Career Development Award (1 K25 HL081275-01).
-
Competing interests: None.
-
Ethical approval: Institutional ethical approval was not required for this manuscript or the data on which it is based. The study comprises an analysis of publicly available data that are released in a de-identified, anonymous form.
Linked Articles
- In this issue