Article Text

Abstract
OBJECTIVES Prediction of patient outcome can be useful as an aid to clinical decision making, to explore possible biological mechanisms, and as part of the clinical audit process. Many studies have constructed predictive models for survival after traumatic brain injury, but these have often used expensive, time consuming, or highly specialised measurements. The aim of this study was to develop a simple easy to use model involving only variables which are rapidly and easily clinically achievable in routine practice.
METHODS All consecutive patients admitted to a regional trauma centre with moderate or severe head injury were enrolled in the study. Basic demographic, injury, and CT characteristics were recorded. Patient survival at 1 year was used to construct a simple predictive model which was then validated on a very similar patient group.
RESULTS 372 patients were included in the study, of whom 365 (98%) were followed up for survival at 1 year. Multiple logistic regression resulted in a model containing age (p<0.001), Glasgow coma scale score (p<0.001), injury severity score (p<0.001), pupil reactivity (p=0.004), and presence of haematoma on CT (p=0.004) as independently significant predictors of survival. The model was validated on an independent set of 520 patients, showing good discrimination and adequate calibration, but with a tendency to be pessimistic about very severely injured patients. It is presented as an easy to use nomogram.
CONCLUSIONS All five variables have previously been shown to be related to survival. All variables in the model are clinically simple and easy to measure rapidly in a centre with access to 24 hour CT, resulting in a model that is both well validated and clinically useful.
- traumatic brain injury
- prognosis
- trauma
- clinical audit
- survival
Statistics from Altmetric.com
Traumatic brain injury, with an estimated 10 million cases a year worldwide,1 is a major cause of death and disability among a predominantly young population. Accurate prediction of long term outcome soon after emergency admission to hospital and neurological assessment (with or without brain imaging) can be useful in several ways; clinically, for communication with relatives and other healthcare professionals, and as an aid to decision making about whether to pursue active management2; in research, to generate hypotheses about the biological mechanisms leading to poor outcome; and retrospectively, as part of a clinical audit process.3Furthermore, the development of methods for case mix adjustment is essential for non-randomised treatment comparisons and clinical epidemiology. For example, the patients in this study were part of a project to measure and assess the importance to long term functional outcome of episodes of physiological derangement, or “secondary insults”,4 recorded in the intensive care unit. To assess the predictive power of such measurements taken during the first few days of care, it was important to have a well validated and reproducible model of prognosis using only baseline admission data, thus allowing assessment of the independent significance of the “secondary insults”, or the “added value” of the complicated task of recording and validating such measurements.5
Many studies have used both prospective and retrospective clinical information to derive baseline predictive models, either specific to traumatic brain injury,6-15 or for patients in the intensive care unit in general.16-18 With a few notable exceptions,10 19-21 these studies have used relatively small patient samples, little or no internal model checking procedures, no external validation of the final predictive model, and no comparisons with existing models. Many of the modelling strategies have begun with a large set of potential predictors from which were selected some “best” candidates determined on purely numerical or statistical criteria. This black box approach to the problem ignores the very real differences in simplicity, cost, and immediacy between the candidate predictors. The sex and approximate age of the patient will almost always be known, whereas an immunoassay result, even if it is a strong predictor of the future, requires specialist input, time to get the result, and funding. In this paper we have developed a simple model for the prediction of survival after moderate or severe traumatic brain injury using clinical accessibility as the main consideration for selecting variables.
Methods
From 1 January 1989 to 16 July 1991, all consecutive patients with traumatic brain injury admitted to the regional trauma centre at the Royal Infirmary, Edinburgh, were enrolled in the study if they were aged 14 or more and had an admission or last known Glasgow coma scale score (GCS) ⩽12, or of 13–15 with concomitant systemic injuries giving an injury severity score (ISS)22 of 16 or more.
Data collected on all patients on admission included age, sex, GCS, cause of injury, ISS, pupil response, brain CT result, and prior consumption of alcohol, each of which have previously been suggested as important prognostic factors. Most patients had brain CT on admission to the Royal Infirmary, but some arrived having had CT at a referring hospital. The CT findings were coded using data taken from the patients’ case notes and x ray report according to the Marshall scheme,23 which divides diffuse injury into four categories and haematomas into evacuated and non-evacuated groups. To avoid the problems of differing scanners, interpretation of which haematomas might or might not be evacuated, and questions of reliability for the diffuse injury classification, the CT results were simplified to the presence or absence of haematoma, whether extradural, subdural, or intracerebral. This is obviously very crude, but likely to be more robust and consistent from centre to centre.
Those patients alive at discharge were followed up at 6, 12, and 24 months from injury, by a combination of interview and a test battery from a neuropsychologist, a postal questionnaire,24 and contact with the general practitioner. For this study survival at 1 year was used as the outcome.
Logistic regression modelling was used to assess the prognostic significance of the candidate predictors. Each variable was initially fitted in a univariate model to assess the functional relation with survival. For categorical variables (for example, pupil reactivity), all categories were fitted initially, an assessment was made of their distinguisability and, if appropriate, categories were merged to give a new, simpler variable. For continuous variables (for example, age) a generalised additive model (GAM)25 was used, which allows a more flexible and less arbitrary way of exploring a non-linear relation with a continuous explanatory variable than by using traditional polynomial functions or categorisation of the variable.
Multivariate modelling of the variables proceeded using the functional relations developed in the univariate models in a multivariate setting. A forward selection algorithm was used, with variables entered in order of ease of clinical measurement and availability. Cases with missing values for any of the variables in the model under study were omitted. Standard procedures were used to assess global goodness of fit, and checks were made for highly influential or unusual findings using influence diagnostics and Pearson residuals.26 Model adequacy was assessed using two measures of calibration (how well the model prediction estimated the true mortality probabilities), and two measures of discrimination (how well the model prediction classified survivors and non-survivors). The Hosmer and Lemeshow (HL) goodness of fit test statistic,27 and the average quadratic or Brier score were used to assess calibration. The second is the sum of the squared differences between the observed outcome (0 or 1) and the predicted probability, and in both cases smaller values indicate improved calibration. To assess discrimination both the misclassification rate and the area under the receiver operating characteristic (ROC) curve were calculated for each model. The first is based on classifying all those with a predicted probability of more than 0.5 as a survivor, and all those with a predicted probability of less than 0.5 as a non-survivor, and the second is exactly equal to the concordance statistic c, a generally applicable measure of predictive discrimination.28 It varies between 0 and 1, with 0.5 being equivalent to random guessing and 1 being perfect prediction.
External validation of the model was carried out on a test set of 520 patients accrued as part of an almost identical study from 17 July 1991 to 30 April 1996. Although the admission policy of the neurosurgical emergency service changed in this period, it was still reasonable to assess the model in this very similar group of patients subject to exactly the same inclusion criteria and similar treatment regimen.
All analyses were carried out using Splus for Windows (Statsci Europe, Oxford, UK) with additional libraries for construction of nomograms provided by Harrell29
Results
A total of 372 consecutive patients fulfilling the inclusion criteria were enrolled in the study. The major demographic and injury characteristics are shown in table 1. During the early part of the study, neither the pupil score nor the CT results were recorded resulting in a higher proportion of missing values for these variables. Of 28 patients lost to follow up at 1 year, 21 were contacted and were alive at 2 years, allowing us to infer the survival status at 1 year, which reduced the number of patients lost to follow up to only 2%.
Demographic, injury characteristics, and outcome at 1 year of the study patients. Percentages quoted are relative frequencies, not survival proportions
UNIVARIATE MODELS
The results of univariate logistic modelling are shown in table 2. Missing values for each variable were omitted from that particular analysis.
Univariate logistic models for survival at 1 year. Odds ratios <1 are associated with a decreasing probability of survival. Odds ratios for continuous variables are for a difference of 5 units* or 1 unit† as indicated. Age is fitted as a function with two linear parts; there is no effect on the odds of survival until the age of 50, but after this point the odds of survival decrease by a factor of 0.712 for each 5 year increase in age
For pupil score the “unequal and reacting” category was combined with the “equal and reacting” category because of the few patients in the first group; the other two pupil score categories were clearly associated with increasingly poor prognosis (p<0.0001). There was no apparent relation between the cause of the injury and survival (p=0.106). Interestingly, both males (p=0.063), and those patients who had consumed alcohol were more likely (p=0.001) to be alive at 1 year. In the absence of plausible pathophysiological explanations for these findings, this was almost certainly due to confounding and demonstrated the potential for misleading results if only univariate analyses are considered for observational data of this type. The absence of a visible haematoma on the initial CT was also marginally significant (p=0.084) as a predictor of survival.
For continuous variables, the generalised additive model for ISS did not suggest any departure from the assumption of linearity (p=0.493), and it was fitted as such in a conventional logistic model, proving to be highly significant (p<0.001). There was some marginal evidence of non-linearity for GCS (p=0.041), but this seemed almost entirely because of the scores in the group of patients with GCS scores of 10, who had an unusually low mortality rate of only one of 33 (3%) compared with four of 26 (15%) for GCS 9 and four of 24 (17%) for GCS 11. As the other GCS scores seemed to show a clear trend towards increasing survival with increasing score, it was thought unlikely that this could be a true effect, and this variable was also fitted as linear, proving to be highly significant (p<0.001).
Of more interest, however, was the relation between age and survival. Figure 1 shows the generalised additive model, plotting the log odds of survival probability against age, with 95% confidence intervals shown as a shaded area. The relation was clearly non-linear (p=0.029), with almost no apparent effect of age until the age of about 50, when there was a linear decline in the probability of survival. As a simplification, this was modelled using a covariate which was zero up to age 50, and then equal to (age−50) after this point. This means that the odds ratio quoted in table 2 is for a difference of 5 years in age for patients over the age of 50; under the age of 50 there was no risk difference.
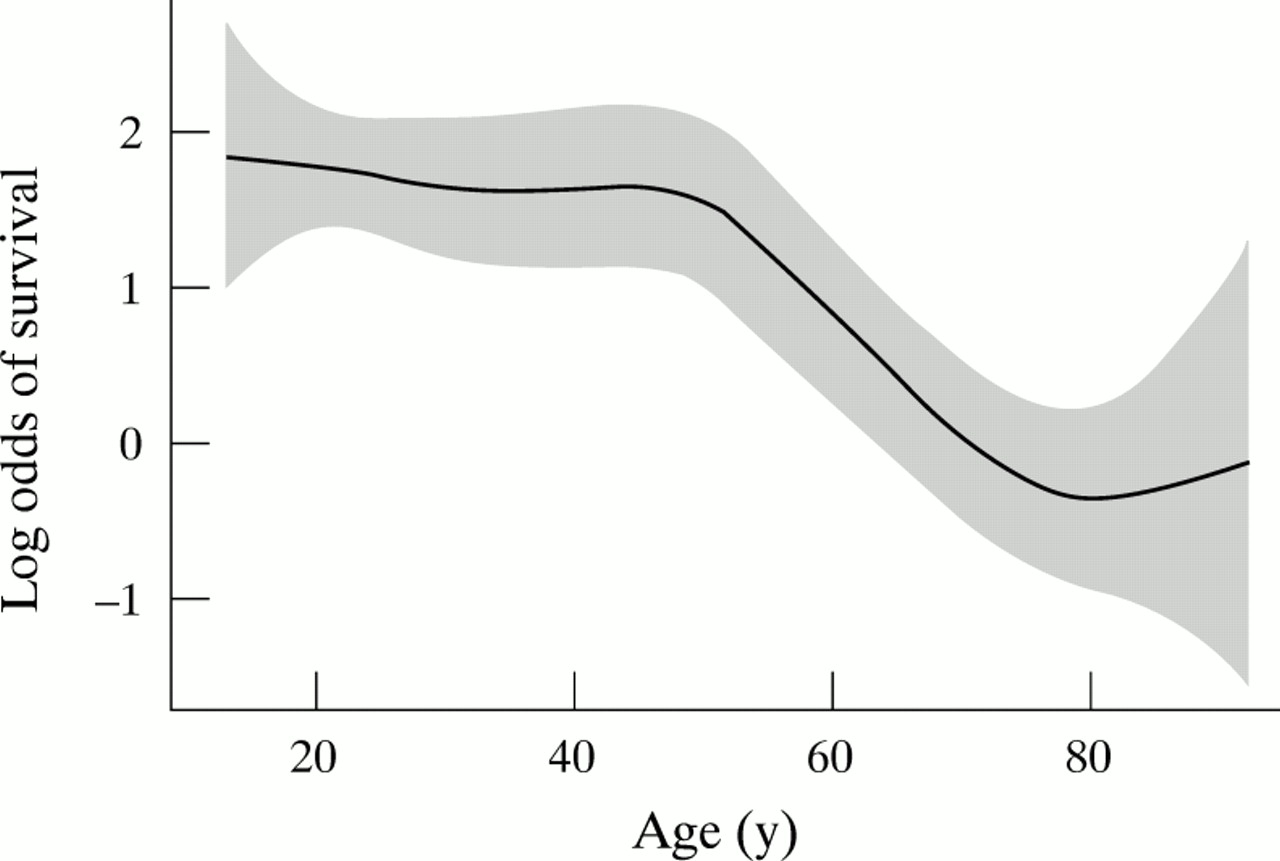
Generalised additive model of log odds of survival at 1 year against age in years, with 95% confidence intervals shown by the shaded region.
MULTIVARIATE MODELS
The construction of a multivariate prediction model was not based solely on considerations of numerical significance. Standard stepwise selection algorithms were not considered appropriate as there were relatively few variables, the proportion of missing values varied substantially from variable to variable, and the ultimate goal of the modelling procedure was to provide a practical “preintensive care unit estimate of the survival probability.
Age, which was never missing, was fitted as a baseline model, with the same piecewise linear functional form as before. Neither sex (p=0.410) nor cause of injury (p=0.064), both of which had always been recorded, added significantly to this model. On the other hand, both the GCS score and the ISS were very highly significant when added individually to the model (p<0.0001 in both cases). Indeed, the ISS was still an independently significant factor when added to the model containing both age and GCS (p=0.003).
The three potential predictors with more than 15% missing values (pupil reactivity, presence of haematoma on CT, and alcohol consumption) were then considered in terms of what they could add to this model containing three easily measured and nearly always recorded items. Thus for each of these variables, only 85% or less of the 372 patients were used to fit the models. Alcohol status (p=0.650) did not add significantly to the model, but both pupil score (p=0.004) and presence of haematoma on CT (p=0.004) were independent predictors of survival when added sequentially.
Thus the final model contained five variables: age, GCS score, ISS, pupil score, and presence of haematoma on CT and is summarised in table3.
Final multivariate logistic model. Deviance values and p values are for sequential tests, adding each variable to a model containing all those above it. Odds ratios <1 are associated with a decreasing probability of survival. Odds ratios for continuous variables are for a difference of 5 units* or 1 unit† as indicated. Age is fitted as a function with two linear parts; there is no effect on the odds of survival until the age of 50, but after this point the odds of survival decrease by a factor of 0.545 for each 5 year increase in age
MODEL CHECKING
Standard residuals and measures of influence for logistic regression were calculated,26 quantifying the individual effect of each patient on the model. Two patients had influence values which were about 50% higher than the main body of data. On closer examination these patients were both found to be young, with no visible haematoma on CT, a GCS score of 3, and with maximal ISS of 75. Thus they were unusual because the poor GCS and ISS indicated a poor prognosis for survival, whereas their age and CT suggested the opposite. Their influence on the model was not thought to be extreme, however, and they were retained. This may also be a feature of the CT classification used in that it ignores the generally poor prognosis of patients with severe diffuse injuries but no visible haematoma.
Three findings had very large residuals (Z>5). All were predicted by the model to be alive at 1 year, with probabilities >0.96, but all died. One death occurred in hospital due to pulmonary embolism, and another at 5 months caused by oesophageal cancer. The third unexpected death was of a 23 year old man injured in a fall, who was GCS 12 on admission, with an ISS of 16, and a 0.5 cm deep subdural haematoma on CT. Yet within 4 hours of an operation to evacuate the haematoma, the patient had an intracranial pressure of 73 mm Hg, one fixed and dilated pupil, and brain death was confirmed within 24 hours. Therefore one of these three deaths was probably unrelated to the initial head injury (the oesophageal cancer), and it is encouraging that the model was not overfitting to such an extent that these deaths were predicted. The third case illustrates how a prognostic model such as this could be used as a routine part of clinical audit and quality control.
Using the original data, which are well known to overestimate model performance,28 the global goodness of fit Hosmer-Lemeshow (HL) statistic, which compares the observed and expected survival rates, was 12.5 on 8 degrees of freedom, with a p value of 0.129 for the rejection of the hypothesis that the model is inadequate, indicating a reasonable, if not perfect, fit. The Brier score was 0.0797, the error rate 10.1%, and the area under the ROC curve 0.901.
EXTERNAL VALIDATION
To evaluate a prognostic model properly requires application in a new group of patients. A second set of 520 patients accrued with identical inclusion criteria, but under a modified trauma service, provided a similar but more recent data set for external validation of our model. The estimated error rate was increased to 15.2%, and the area under the ROC curve decreased to 0.835. Although these values were worse than before, there was little evidence of overfitting in the training set, and the model discriminated well in the new set of patients. The Brier score was poorer at 0.1160, and the Hosmer-Lemeshow statistic for the model showed a significant lack of calibration, with a χ2 value of 49.8 (p<0.0001). A smoothed plot of fitted against predicted values, as shown in figure 2, disclosed that this was due to both an overly pessimistic prediction in the patients with the poorest prognosis, and a slightly optimistic prediction for patients with a better prognosis.

Smoothed plot of observed survival probability against predicted survival probability from the model. The line of equality is shown as the bold line, and 95% confidence intervals are shown by the shaded region.
A SIMPLE NOMOGRAM
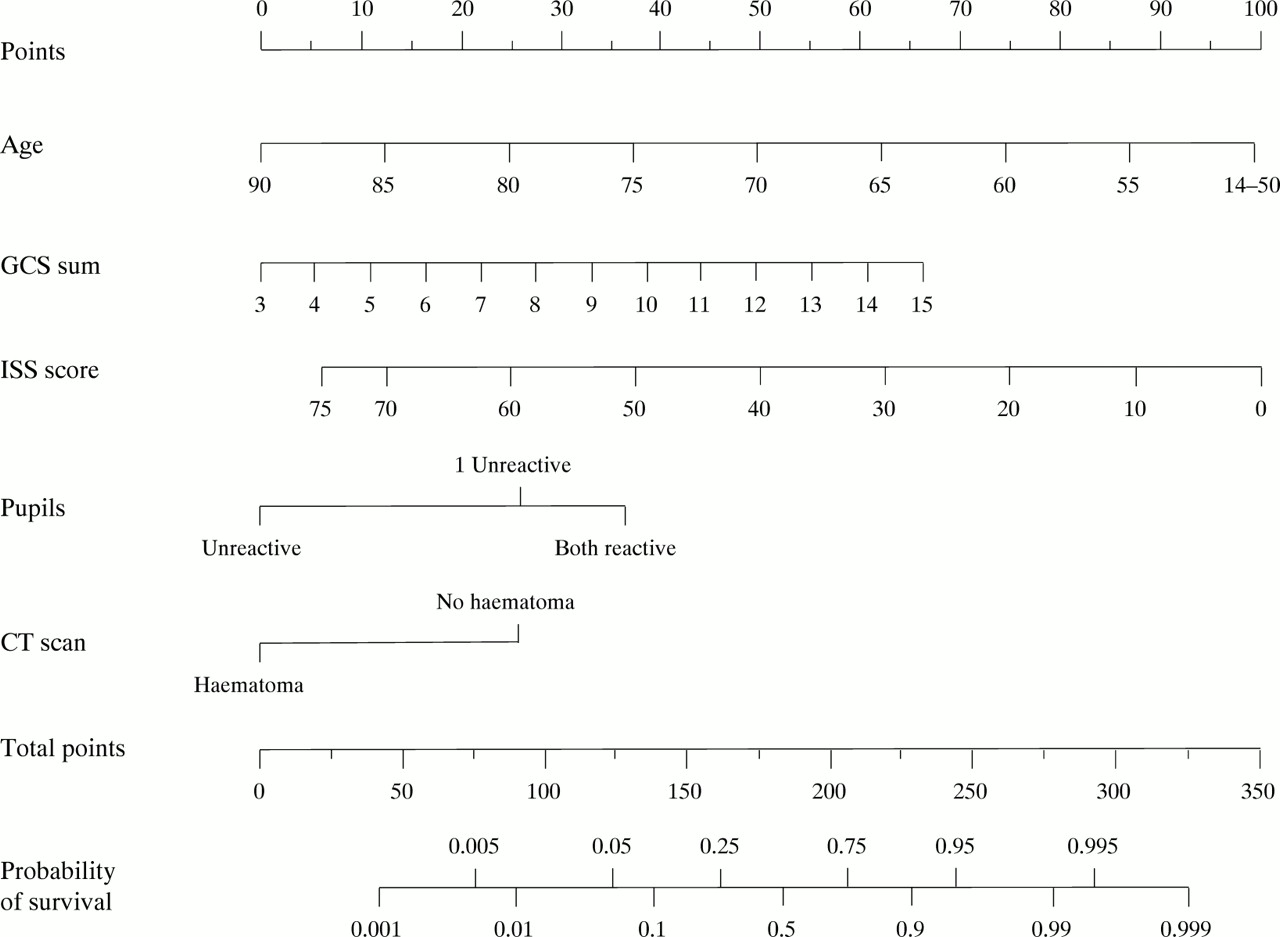
Finally, a prognostic model will never be of any value unless it is used.30 One advantage of concentrating on simple models and using logistic regression is that it is relatively easy to construct a nomogram with which to calculate outcome predictions for individual patients simply and easily. Figure 3 shows just such a tool. For each of the five variables, the corresponding number of points is read from the top scale. These are then summed to give a total points score, which is then readily translated into a probability of survival on the bottom scale. Note that this final scale is non-linear.
—Nomogram for predicted probability of survival at 1 year. For each of the five variables, points are calculated by reading from the top scale. The total point score is then translated into a probability of survival by using the bottom two scales. For example, a patient of age 70 (50 points), with a GCS of 12 (50 points), an ISS of 20 (75 points), reactive pupils (37 points), and no haematoma on CT (25 points) has a total score of 237 points, and a corresponding probability of survival at 1 year of about 0.93.
Discussion
Many other authors have shown age, GCS score, and pupil score to be significant predictors of long term outcome after traumatic brain injury.8-10 The inclusion of ISS, with the implication that extracranial injuries are an independent risk factor contrasts with other studies which suggest otherwise31 32 and may be related to the inclusion of patients with a GCS of ⩾13 only if they also had an ISS of 16 or more, suggesting severe extracranial injuries. Indeed, the observed mortality for this group of patients was nine of 90 (10%), substantially higher than would be expected from a representative sample of all patients with a GCS of 13 or higher. This finding is supported by a study of nearly 50 000 traumatised patients in the United States,33 where mortality from head injury was significantly increased only by extracranial injury scores of 16 or more.
Alternatively, the importance of ISS could result from our rather crude classification of intracranial injury induced by the use of the “visible haematoma” variable, leaving more detailed information about the intracranial injuries to be “explained” by the ISS score. Several authors have proposed classifications for CT of varying complexity and focus,23 34 concentrating either on categories of diffuse brain injury, or the specific size and locations of haematomas, or whether or not the haematomas were evacuated. Our CT variable was deliberately designed to be a simple easily identifiable feature on CT; trivial haematomas are unlikely to be classified in the case notes in the same way as more clinically relevant lesions. Moreover, it is likely to be achievable and practical for predictive models used in the hurly burly of a general emergency admissions department, where the policy on evacuation, type of scanner, and observer may vary from centre to centre. It was not intended to replace more clinically detailed imaging interpretation, and we are currently undertaking a retrospective review of all available original CT from these patients to extract more reliable and clinically meaningful measurements which can improve the model (at the expense, however, of requiring a trained observer.)
The fact that poorer survival was only associated with increasing age beyond a certain threshold has been previously noted in the traumatic coma data bank35 36 for age cut off points of either 40 or 55 years, and is worthy of further examination. It should be noted again, however, that 14 was the lower age limit for this study, and hence conclusions can only be drawn for patients of this age and above. The relation between age and outcome suggests that there is something fundamentally different between those patients between the ages of 14 to about 50 years and those above the age of 50. Recently, much interest has been focused on the aging brain, with suggestions of links between traumatic brain injury and early onset Alzheimer’s disease and the finding that genetic factors implicated in the second may also be important prognostic factors for survival after traumatic brain injury.37-39 There is speculation that the mechanisms of brain repair are in some way degraded or changed in older patients, leading to the poorer survival. Future work is required to explore this relation between age and outcome in more detail, and in other data sets, to follow up this interesting hypothesis generating finding.
Other work in this area has sometimes attempted to predict “good outcome” (usually defined as moderate disability or better) rather than survival. However, given that most deaths occur soon after the initial injury, it may be more useful to predict functional recovery given survival beyond say, the first 7 days (by which time additional relevant information about the patient will have come to light), rather than attempting a more comprehensive prediction on admission. The argument that survival in a persistent vegetative or severely disabled state is worse than death is an ethical dilemma, depending on a subjective judgement. The distinction between dead and alive is less subjective than that between independent and dependent survival and an early prediction of survival would be a clinically robust and useful tool. It should be noted, furthermore, that the use of less objective and more complex outcome measures in survivors will increase the amount of missing data and add noise to the modelling process. Indeed, for this dataset the use of measures of functional outcome in survivors would have increased the lost to follow up rate from less than 2% to more than 7%.
We opted to fit a logistic regression model largely because of its simplicity and ease of interpretation. Much effort and expense has been expended in developing competing methodologies for deriving predictive models such as neural network or tree based models, but Titteringtonet al 10 suggest that for the problem of predicting outcome after traumatic brain injury, the selection of appropriate candidate variables is of more importance than the particular methodology applied. Furthermore, our external validation error rate of 15.2% was comparable with those in the literature; Stablein et al 9achieved an internal error rate of 9% on the basis of a model developed on 115 patients with traumatic brain injury; and Choiet al 13 one of 21% based on 555 patients with traumatic brain injury. The more realistic externally estimated error rates for these models would almost certainly have been higher.
In summary, we have derived, checked, and externally validated a predictive model of 12 month survival after traumatic brain injury. The final model gives reasonably accurate predictions of long term survival from a small, easily measurable set of clinical and CT findings, and can be applied using a simple nomogram in the accident and emergency department of any hospital with a CT scanner.
Acknowledgments
This work is a small part of a large ongoing project to study the mechanisms and pathology of traumatic brain injury begun by the late Professor JD Miller. We are very grateful to all the staff who carefully collected and verified the demographic, injury and outcome data—namely, S Anderson, J Corrie, M Dearden, J Findlay, DJ Hellawell, AM Housley, J Kerr, EG McKeating, S Midgeley MJ Souter, and J Tocher. Funding was provided by the MRC under grants SPG8809198, SPG9125498, G9301975, G9301951, and G9508752.