Article Text

Abstract
Objectives: To estimate the incidence of adverse events in medical and surgical activity in public and private hospitals, and to assess the clinical situation of patients and the active errors.
Design: Prospective assessment of adverse events by external senior nursing and doctor investigators with ward staff.
Setting: Random three-stage stratified cluster sampling of stays or fractions of stay in a 7-day observation period for each ward.
Participants: 8754 patients observed in 292 wards in 71 hospitals, over 35 234 hospitalisation days.
Main outcome measures: Number of adverse events in relation to number of days of hospitalisation.
Results: The incidence density of adverse events was 6.6 per 1000 days of hospitalisation (95% CI 5.7 to 7.5), of which 35% were preventable. Invasive procedures were the source of half the adverse events, of which 20% were preventable. Adverse events related to the psychological sphere and pain were mostly considered as preventable. Ward staff found it difficult to assess the role of care management in the occurrence of adverse events: 41% of adverse events were expected because of the disease itself, and could have occurred in the absence of the related medical management.
Conclusion: At the national level in France, every year 120 000–190 000 adverse events during hospitalisation can be considered as preventable. Areas such as perioperative period and geriatric units should receive closer attention. As adverse events occurred more commonly in vulnerable patients, who are not specifically targeted by clinical guidance, practising evidence-based medicine is not likely to prevent all cases. Therefore clinical risk management should prioritise empowerment of local staff, provision of favourable conditions within the organisation, and staff training based on simple tools appropriate for ward-level identification and analysis of adverse events.
Statistics from Altmetric.com
Previous estimates of the frequency of adverse events have all been based on reviews of medical records.1–5 Recently, another method based on prospective assessment of adverse events with clinical staff has been validated.6 As in the method of medical record review, the adverse events and their causes are assessed by external nursing and doctor investigators. The investigators interview the ward staff in charge of hospitalised patients and review the records with them to identify adverse events and their causes. This method was developed to compensate for the lack of information in patient records.
Although it is more expensive, the prospective method was preferred by the French health ministry, which intended to use the results of the study as a baseline for subsequent review. This was because of the method’s effectiveness in identifying all types of preventable event, its reliability of judgment of the iatrogenic nature of events and its good appreciation of the clinical context and chain of errors leading to an adverse event.6 In addition, it may act as a “red flag” for care providers during data collection, and it has educational value since the staff do not always clearly understand the notions of adverse events and their causes. Involving clinical staff aids in educating and convincing them that errors on their part can generate adverse events.7
This first national survey, based on the above method, aimed to:
-
estimate the incidence of adverse events occurring in hospital settings;
-
assess the clinical situation of the patients as perceived by the staff;
-
identify the main active errors.
METHODS
Definitions
Our definitions were based on those used in previous studies.1–5 We defined an adverse event as an event that was unfavourable for the patient, and was consequent to medical management (treatment planning and treatment, diagnosis, prevention or rehabilitation) rather than being an inherent part of the pathological process. Unfavourable events occurring during the observation period were included if they were:
-
associated with death or life-threatening conditions;
-
liable to lead to an extension by at least 1 day of the hospitalisation period;
-
liable to lead disability or handicap at the end of hospitalisation in the unit involved in the study.
Events were considered preventable if they would not have occurred had the care provided complied with recommended or, in the absence of guidelines, commonly accepted practice at the time of occurrence of the event.
Population and sample
We explored the incidence of adverse events in a population of inpatients in short-stay, standard and weekday hospital facilities. Obstetrical wards were excluded. Between April and July 2004, the data were collected during a 7-day observation period in each ward. We used three-stage cluster sampling by randomly selecting départements (French administrative districts); in the départements, hospital facilities; and in the facilities, wards. Six strata were studied, made up of the three types of hospital facility (university hospitals, other public hospitals and private hospitals) and the type of activity (medicine and surgery). In the wards, all inpatients present during the observation period were included.
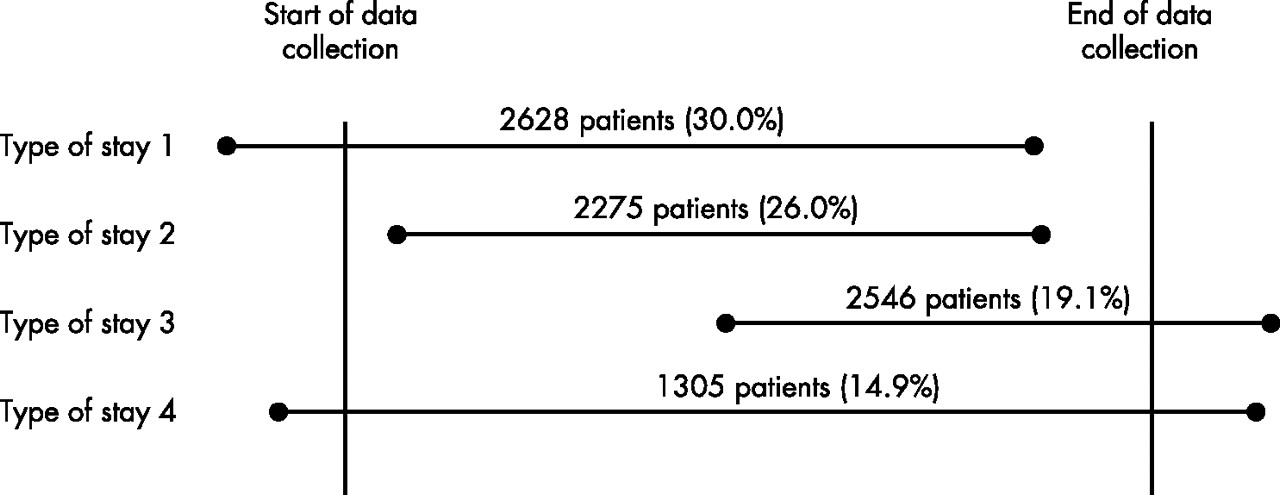
The sample was made up of all stays or fractions of stay of patients in the observation period of 7 days for each ward. Four types of stay were therefore considered (fig 1). We included only those adverse events that occurred or were identified between the start and the end of observation period. Only type 2 stays were observed completely; for the other three types of stay, the events occurring before the start of data collection or after the end of data collection were not taken into account.

Types of stay included the sample (observation period between the two vertical lines) and number of included patients in each type of stay.
Data collection
The 26 nursing investigators were state-qualified nurses. The 23 investigating doctors were qualified senior hospital practitioners. They received instruction over a period of 3 days in the definitions and in the survey methods. A detailed survey manual was issued to them.
For screening for adverse events a nurse investigator conducted interviews with the senior ward nurse and reviewed the records. Once the candidate adverse events had been identified, a doctor investigator interviewed the doctor responsible for the patient’s care and scrutinised the medical record. In line with similar studies, detection was based on 16 criteria for detection, such as hospital-incurred patient accident or injury or unplanned return, visit to the operating theatre or patient/family dissatisfaction with care received documented in the medical record and/or documentation of claim or litigation.1,6 The nursing investigator visited each ward three times—on the first, third and seventh days of the observation period. The investigating doctor completed the medical questionnaire in the ward after the third visit by the nursing investigator. The medical questionnaire was based on the review form used by Vincent et al in their 2001 English survey.3 It included:
-
a clinical summary;
-
determination of the adverse event (consequences, confidence score of causation);
-
classification of the adverse event (anatomical location, type of active error if any, clinical context);
-
preventability.
Together with a ward doctor, the investigating doctor assessed the pathology at the time of occurrence of the adverse event. The complexity of the clinical situation (comorbidity, risk factors, compliance of the patient) was rated on a four-item Likert scale (not complex, not rather complex, rather complex, very complex). The investigating doctor also assessed if the adverse event had been recognised by the ward doctors and if subsequent action had been taken. They finally assessed the degree of causation of adverse events by medical management and of preventability on a six-point scale (from “virtually no evidence” to “virtually certain evidence”).1,3 Results were reported for a score of 4 or more, requiring evidence that causation and preventability is more likely than not. The reproducibility of the identification of adverse events in connection with care has been shown to be good, and that of the assessment of preventability of the events to be moderate.6 To optimise the reliability, all the questionnaires of all adverse events were reviewed by the two first authors. In addition, all cases related to a healthcare product and all infections were reviewed by at least three experts under the coordination of two national bodies—Afssaps (Agence française de sécurité sanitaire des produits de santé), in charge of the safety of the healthcare products, and the CTIN-ILS (Comité technique des infections nosocomiales et des infections liées aux soins), in charge of the prevention of nosocomial infections. The aim of this external review of the data was to confirm the validity of the investigation. The experts independently reviewed the review forms and assessed the coherence of the clinical summary with the investigator’s assessment of causality and preventability. If the majority of the external reviewers disagreed, the case was discussed with the investigator.
Data analysis
The incidence density of adverse events identified during hospitalisation was calculated in the form of the number of adverse events identified in the ward within the observation period in relation to the number of days of hospitalisation observed. We estimated this for the different strata, and then an overall estimate was computed taking into account the cluster and strata effects, using the STATA software. The STATA commands svymean, svytotal, svyratio and svyprop produce estimates of finite population means, totals, ratios and proportions, respectively. Associated variance estimates are also computed.
Let h = 1, …, L enumerate the strata in the survey
Let i = 1, …, Nh, where Nh is the total number of elements in stratum h in the population
Let Yhi be a survey item for element i in stratum h
The associated population total was:

Let yhi be the items for those elements selected in our sample; here h = 1, …, L, i = 1, …, nh
Our estimator Ŷ for the population total Y was:

where whi are the sampling weights. These weights are the probability for each item to be selected in our sample (calculated weights considered the three-stage cluster—départements, hospitals, wards).
Our estimate fort the variance of µ was:

An approximate 100(1−α)% CI for Ŷ was:

with:

The integration of these effects means that the percentages presented could not be directly re-calculated from the raw numbers. Specific incidence rates were similarly calculated for preventable adverse events: for the most serious events (death and life-threatening conditions), for events linked to healthcare products (medication, medical devices and blood products), for care-related infections and for events associated with invasive procedures (surgical operation, interventional radiology, endoscopic procedure, needle biopsy, puncture, vascular catheterisation, intubation, assisted ventilation).
RESULTS
Sample
From 117 hospital facilities randomly selected in 19 départements, 57 (49%) agreed to take part in the study: 44 of 60 public hospitals (73%) and 13 of 57 private hospitals (23%). Another 60 facilities were randomly chosen as replacements—16 public hospitals and 44 private hospitals—and 56% and 11% of these, respectively, accepted without a second invitation. In all, 71 hospital facilities took part from 177 facilities that were contacted, giving a participation rate of 40% (70% in public hospitals and 18% in private hospitals).
Of 294 wards or units randomly selected from these hospital facilities, nine refused to participate; they were replaced by others in the same strata. Analyses were conducted on 292 units (table 1). In two units, data collection was not finalised because the investigating doctor could not retrieve the detection questionnaires on arrival at the unit.
Number of units and of patients per specialty
The 8754 patients included were followed up on average over 4 days, giving a total of 35 234 days of observation (17 105 in medicine and 18 129 in surgery).
Frequency and impact of adverse events
In all, 255 adverse events occurred during the 35 234 days of hospitalisation (149 in surgical wards and 106 in medicine wards). In the course of the 7 days’ observation per unit, at least one adverse event was observed in 55% of surgical units and in 40% of medical units.
On average, 6.6 adverse events were observed per 1000 hospitalisation days (95% CI 5.7 to 7.5) (table 2). The incidence density was 6.2% (95% CI 4.9% to 7.5%) in medicine and 7.0% (95% CI 5.8% to 8.3%) in surgery. It was 8.5% (7.7% in medicine and 9.4% in surgery) in the subsample of patients hospitalised before the beginning of observation period (type 1 and 4 stays) and 4.5% (4.1% in medicine and 4.9% in surgery) in the subsample of patients hospitalised during the observation period (type 2 and 3 stays).
Incidence density (number of adverse events per 1000 days of hospitalisation) of adverse events identified during hospitalisation, according to preventability and for each stratum in medicine and surgery
The highest incidence density in medicine was observed in geriatric units (10.8%, 95% CI 4.4% to 17.3%), and the lowest in internal medicine (0.5%, 95% CI 0% to 1.5%). In surgery, the highest density was observed in cardiothoracic surgery (4.3%, 95% CI 0.7% to 8.0%), gynaecology (3.4%, 95% CI 0% to 8.5%) and urology (3.1%, 95% CI 0% to 6.4%). However, the rates were lower in ophthalmology (1.2%, 95% CI 0% to 3.0%), and ENT and maxillofacial surgery (1.0%, 95% CI 0% to 4.1%). The incidence density was 10.1% (95% CI 1.1% to 19.1%) in surgical intensive care and 8.9% (95% CI 0% to 17.8%) in neonatal care, and 7.4% (95% CI 0% to 15.0%) in medical intensive care, and 6.3% (95% CI 0% to 13.8%) in polyvalent intensive care.
A longer period of hospitalisation was associated with 110 (40.5%) adverse events. However, 21 adverse events were associated with the occurrence of death, 92 involved life-threatening situations, and 55 some form of disability (table 3).
Incidence density (number of adverse events per 1000 days of hospitalisation) of adverse events identified during hospitalisation, according to preventability and to consequences
Patient characteristics
The demographic characteristics of the patients with adverse events were not different from those of the other patients. The mean age was 63.0 and 61.7 years, respectively (p = 0.5) (62.2 and 62.0, respectively, in surgery; and 63.9 and 61.2, respectively, in medicine). The gender ratio of patients experiencing at least one adverse event (male to female ratio 1.05 vs 1.10) also was not different from that of the other patients.
The severity of clinical condition of patients experiencing an adverse event also seemed marked, but comparative analysis was not possible because the health status of patients who did not experience an adverse event was not assessed. The pathology was considered rather serious or very serious in 78.4% of patients with adverse events (85.2% in medicine and 72.8% in surgery). Likewise, general health and comorbidity status were considered rather or very complex in 64.8% of patients who experienced an adverse event (75.1% in medicine and 56.3% in surgery). In 53.4% of the adverse events, the pathology was considered serious, the patient’s clinical status was rated as complex, and care provision considered urgent at the time of the care provision generating the adverse event. Poor general health status was considered to be a factor favouring the occurrence of adverse events in 79.2% of patients, and here again more frequently in medicine than in surgery (89.1% and 71.1%, respectively, p = 0.002).
The severity of the clinical condition increased with the severity of the adverse event. The pathology was rather serious or very serious in 66.0% of adverse events leading only to prolongation of hospital stay, 90.9% of adverse events with disability, and 83.4% of adverse events associated with death or a life-threatening adverse event (p<0.002). Likewise, clinical status was considered rather or very complex in 42.3%, 82.3% and 61.5%, respectively (p<0.001).
According to the ward staff, 40.9% of adverse events were expected because of the disease or the health status of the patient, and 41.2% could have occurred in the absence of the medical management that was related to the occurrence of adverse event. Of the adverse events, 91.6% had been detected by the ward staff before the review, and they had acted on 78.9% of them.
Preventability and active errors
The investigators and the ward staff considered 35.4% of the adverse events preventable (39.6% in medicine and 32.1% in surgery). In 14.5% of the 255 adverse events, inadequate care was found to be the main human error related to occurrence of adverse events: failure to choose the appropriate care in 5.9% and failure to administer care at the right moment in 8.8%. No error was identified in 52.7% of adverse events. Lastly, the investigators and ward staff were unable to determine whether there had been any active error in the remaining 18.2%. Among the 64 preventable adverse events, inadequate care was again the most frequent type of error (46.3% of the adverse events).
Types of adverse event
Invasive procedures formed the main exposure situation for adverse events occurring during hospitalisation (table 4): in particular, perioperative care was related to 42% of adverse events whereas adverse drug events represented 20%—nearly as high as care-related infections. The preventability of adverse drug events was 42% whereas that of perioperative adverse events was 31%.
Incidence density (number of adverse events per 1000 days of hospitalisation) of adverse events identified during hospitalisation according to preventability and to main exposure or mechanism
The organs that were the most often affected were the cardiopulmonary system (n = 45) and the digestive tract (n = 24). The preventable adverse events affecting the cardiopulmonary system were most frequently bronchopulmonary infections, half of which were consequent to choking (case 1) and pneumothorax related to insertion of a catheter (case 2) (table 5). For the digestive tract, the complications were mainly subsequent to surgery or endoscopy (cases 3 and 4).
Examples of preventable adverse events identified during hospitalisation
Inter-rater reliability of assessment of patients with adverse events
Pain and psychological disorders were considered as preventable in nearly 80% of adverse events (fig 2). The adverse events related to the psychological sphere corresponded to psychological distress expressed by patients (or their families for newborns) during hospitalisation, as a result of unexpected delays in treatment or lack of information (cases 5 and 6). Preventable pain corresponded to delays in diagnosis (case 7) or poor organisation of pain-monitoring procedures (case 8). Events related to skin (in particular pressure ulcers), haematological, nephro-urological and locomotor systems were considered as preventable in nearly 50% of adverse events. The small number of adverse events by anatomical site did not allow us to reach definite conclusions.

Number of adverse events identified during hospitalisation according to preventability and anatomic location.
DISCUSSION
By extrapolation, our results suggests than, in the fiscal year 2004 (55 000 000 hospitalisation days), 350 000–460 000 adverse events occurred in the course of hospitalisation, of which 120 000–190 000 were preventable. We collected data between April and June 2004, and this extrapolation is based on the hypothesis of absence of a seasonal effect in the phenomenon. It was not possible to verify this effect from our data, but to our knowledge it has not reported in the literature. Without a risk-adjustment model, it was not possible to draw any conclusions about differences between the different types of hospital facility. For the same reason, and also because the study sampling procedure was not designed for the purpose, the differences observed between specialties did not allow us to draw definitive conclusions. However, there was a trend toward high rates—for example, in geriatrics. The high rate of adverse events in geriatrics has been rarely outlined in the literature, and may be considered even more surprising here as we found that the age of patients with and without adverse events did not differ significantly. These two findings are, however, not necessarily contradictory, but we do not have a simple explanation for the high rate in geriatrics. It may be a French peculiarity, since most of these adverse events were related to drugs, and the consumption of drugs by elderly people in France is believed to be amongst the highest in the world.
The distribution of the different types of adverse event shows that current priorities for risk prevention programmes in France (medication-related risk, infection, pain, patient information) are relevant. Whereas some have already been shown to be successful (safety of blood products, anaesthesia), others, such as the perioperative period or geriatric units, should receive closer attention.8,9
The lesser participation by private hospital facilities had two consequences. First, it resulted in a lower degree of precision in the estimation of the frequency of adverse events in the two relevant strata and, second, a bias in national estimates. As the reasons why the hospitals participated were not elucidated (facilities without clinical risk management programmes may have decided to use this opportunity for entering the process, facilities with a programme may have wished to show their good results, etc.), the bias can be in favour of an overestimation or an underestimation. We could not check the representativeness of the study sample with regard to overall hospitalisations in France, as there are no data on the days of hospitalisation according to strata, or on patient characteristics (mean age, gender). Indeed the French diagnostic-related groups data are based on surgical procedures and distinguish between activity in surgery, but do not allow accurate classification of hospital stays into medical and surgical groups. During data collection, the investigators had some difficulty in dating the occurrence of certain types of adverse event, for instance deep vein thrombosis and bedsores. Hence, some of the adverse events identified in the course of hospitalisation may have arisen before admission. For reasons of feasibility and cost of the survey, it was not possible to follow up the complete patient stay. The assessment of consequences of adverse events identified during hospitalisation, in terms of disability, and to a lesser extent in terms of prolongation of the hospital stay, was probabilistic for patients who had not been discharged at the time of the investigator’s visit, and so it may not be entirely valid.
The present study is the first descriptive survey to be conducted based on this method, and it allows some conclusions to be made about its advantages. The French health ministry launched this survey with the aim to repeat it in several years time. This was a strong argument for choosing the method of prospective data collection with clinicians, since it has six advantages over the retrospective record review:
-
higher effectiveness in detecting preventable adverse events;
-
better reliability of the assessment of adverse events (see appendix A);
-
more appropriate estimates of incidence
-
better appreciation of clinical context and chain of errors leading to an adverse event
-
smaller sample size needed to show variations;
-
better value for education and communication.
The effectiveness of the prospective method was indeed found to be similar to the retrospective record review for estimating the incidence of adverse events, but it was higher for assessment of preventable adverse events.6 The inter-rater reliability of the data collection with clinicians seems to be much higher than that of the record review for the assessment of causality of adverse events, but unfortunately, it was similar for the assessment of preventability.6 If these results are confirmed by other studies, the next step will be to improve the reliability of the judgment of preventability. In our opinion, this improvement is achievable by including a few questions on latent failures in the review form to help clinicians refine their appreciation of preventability. We are currently working on improving the review form in this regard.
According to the literature, our estimate of the risk, the density incidence, is appropriate “to measure the number of new cases emerging in an ever-changing population, where people are under study and susceptible for varying lengths of time … in an effort to keep the contribution of individual subjects commensurate with their follow-up interval, the denominator of an incidence density measure is not persons at risk for a specific time but person-time at risk of the event … it is also useful for estimating the incidence of disease [here adverse events] in large populations of known size when an accurate count of new cases and an estimate of the population at risk is available, e.g. a population-based cancer registry”.10 The incidence density is indeed considered a better indicator than the proportion of patients with adverse events because it takes into account the length of exposure. The drawback in the present study was that the exposure to risk was not uniform: it varied with hospitalisation time according to a probability function, which is still unknown. More research is needed on this issue. The fourth advantage is the smaller size of the denominator (number of hospitalisation days, compared with number of patients for the record review method) required to statistically compare incidence over time.
Involving ward staff allows better assessment of the clinical context and chain of errors (the latent failures were assessed using root cause analyses in a small subset of these adverse events, not presented in this paper), and identification of adverse events that are poorly recorded—for example, severe pain or psychological disorders. For epidemiological purposes, and in line with previous similar studies in other countries, the “ultimate” or clinically most important event was retained if several events were interconnected. For instance, one patient underwent removal of a uterine fibroma. This intervention caused a perforation of the lower uterus and the sigmoid colon, leading to pelvic peritonitis. The two events were noted, but only the peritonitis was the subject of analysis of the active error and its preventability. In terms of prevention, however, the perforation is a more useful object of study and this was discussed with the ward staff during data collection. A complementary approach in patients presenting with several adverse events can be identification of the event where prevention issues seem the most relevant. Last but not least, we believe that the involvement of clinicians is an important issue for the national ownership of the results, and therefore for the professional acceptability of subsequent national patient safety initiatives.
The issues related to the cost and cost effectiveness of our new method are important considerations if the method is to be considered for implementation in other countries by others researchers or patient safety institutions. For that reason, we carefully collected the costs during our pilot study, which aimed to compare the prospective data collection with clinicians with the retrospective review of records by external reviewers.11 The variable costs (investigator salaries for data collection and travel expenses) were 1.6 times greater in the prospective method than in the retrospective method. After accounting for the fixed costs (organisation and management, administration), the total cost of the prospective method (ie, the burden for the Ministry of Health that funded the study) was €45 000, 20% greater than that for the retrospective method. The workload for the units (ie, the burden for the hospitals, not covered by the survey funds) could not be precisely assessed. It was obviously lower for doctors and nurses in the retrospective method, although not negligible, especially when the records were retrieved by the clinical administrative staff, a workload that was absent in the prospective data collection method. These costs have to be balanced against the relative advantages of the methods that were described above.
Besides our study’s goals, our prospective data collection with clinicians can be valuable for the evaluation of the impact of changes (new safety technologies or procedures). We think that our method may be more valid as long as the impact is measured in terms of improved process of care, because of the lack of information in the records. However, the use of outcome measures such as incidence of adverse events, is likely to be biased with prospective data collection because the clinicians are both the subject and the observers of the effect of that change. Moreover, in comparative studies, better clinicians may be more sensitive in spotting errors/adverse events and hence may make themselves look worse.12
The scope for comparison of results with previous similar studies is relatively narrow, and this may be considered as another limitation, even though previous experience has shown how difficult the comparison between national surveys can be.13,14 The distribution of events and the rates of preventability observed in the most recent studies are, however, comparable since the definitions and the questionnaires used are similar.1–3,5,15 In these studies, the percentage of preventable adverse events was between 37% and 51%. It is not surprising than the percentage in the present study is in the upper part of this range since prospective assessment of adverse events identifies a larger proportion of preventable cases than record review.6 In terms of clinical risk management, our results are striking: in a simple 7-day observation period per unit, at least one adverse event was identified in 55% of surgical units and in 40% of medical units. It clearly indicates that every type of hospital and unit is affected by adverse events. These results also illustrate the difficulty of assessing the adverse event and its causes: although the clinical team was assisted by a trained investigator and was guided by a structured questionnaire, they were not able to conclude whether there had been any error in 18% of adverse events. These difficulties, in our opinion, are due to the poor understanding of the clinical staff of the notions of adverse events and their causes and to the links between disease, health status and medical management, all of which contribute to the occurrence of the adverse event.
Key messages
-
On the basis of surveys based on retrospective review of medical records, the frequency of occurrence of adverse events in hospitals has been identified as a public health problem. New methods are available to overcome some of the limitations of these surveys that arise due to the lack of information in the records. The method in the present study, based on data collected with ward staff, makes it possible to assess the incidence density of adverse events along with patient characteristics and active errors related to their occurrence.
-
This method has six advantages over retrospective record review: higher effectiveness in detecting preventable adverse events, better reliability of assessment of adverse events, a more appropriate estimate of incidence, better appreciation of clinical context and the chain of errors leading to an adverse event, smaller sample size needed to show variations, and better value for education and communication.
-
Ward staff, who were found to have difficulty assessing the role of care management in the occurrence of adverse events, need training in tools appropriate for local identification and analysis of adverse events.
The prevention of adverse events is influenced by compliance of practice with recommendations; however, evidence-based medicine cannot provide all the answers. Indeed the present study, which seems to favour the greater frailty or vulnerability of patients experiencing adverse events, suggests that improvement of compliance with care protocols will not be sufficient. These patients have complex profiles, where the pathology is often very serious. In conjunction with requiring emergency care provision, their condition is not adequately covered by clinical guidance, so that they constitute “extreme” cases. At the ward and individual level, prevention depends on staff’s ability to identify and analyse the errors and adverse events, and to learn from it. Prevention also depends on the ability of the hospital environment to adapt to the variety of situations in which adverse events occur. For each individual practitioner this means, for instance, increased capabilities in unexpected situations, and strict distinction of the competence of each professional in the execution of care procedures; at the organisational level, efficient personnel management and functional structures are required to cope with unexpected situations at all times. The health sector needs to use the risk management tools already available in industry, and it also needs to design its own patterns of clinical risk management.16
CONCLUSION
The main conclusions of this study, with regard to prevention of clinical risks in hospitals, are that all types of hospital facility are affected, and that areas such as perioperative period and geriatric units should receive closer attention. Besides raising awareness in risk management, clinical risk management should prioritise empowerment of local staff by providing favourable conditions within the institution and staff training based on simple tools appropriate for ward-level identification and analysis of errors and adverse events.
APPENDIX A
Inter-rater reliability of assessment of causation by medical management and of preventability of adverse events was studied in a representative sample of French hospitals. A two-stage cluster stratified random sample was derived from Aquitaine, southwestern France. The two clusters, hospitals and clinical wards, were stratified as follows: the hospitals in five strata (teaching hospital, large and small public hospitals, large and small private hospitals) and the wards in two strata (medicine and surgery). One hospital was selected in each stratum, whereas wards were selected within each stratum using proportional allocation (proportional to number of hospital beds). In these wards, all inpatients were included.
Two trained nurses and six senior clinicians in medicine or in surgery, who had been qualified for at least 7 years, participated. The wards were attributed at random to the clinicians, each of them participating equally at both times of data collection, in order to avoid the clinician effect. In medicine and in surgery, each positively screened patient was referred to two of the three clinicians who independently, at a 6-day interval, assessed causation and preventability using the same forms as in the national survey.
After data collection, the clinicians discussed the discordant cases to assess whether it was a problem of reliability or whether the discordance was due to any clinical evolution during the 6-day interval. All adverse events were then verified by the authors with the ward doctors to limit any variability due to a lack of validity. Cases that were discordant because of clinical evolution were excluded from the analysis. Agreement between the clinicians was calculated as the κ statistic.
Of the 29 units in the three public and four private hospitals, 15 were medical and 14 were surgical. A total of 542 patients were included, 279 in medicine and 263 in surgery. All the 203 patients screened positive were analysed by two clinicians. They discordantly classified 58 cases, 32 due to evolving symptoms and 26 to occurrence of a new adverse event after the first time of investigation. Among the remaining 145 patients, all 73 (61+5+7) cases identified by at least one investigator were confirmed by the ward doctors (table A1). Eight of the 12 discordant cases were due to the discordant assessment of the causal role of the care management, and four because the investigators analysed distinct events in clinically complex patients. The global agreement was 91.7% (61+72/145) with κ 0.83 (95% CI 0.67 to 0.99). Reliability was similar in medicine (0.84, 95% CI 0.63 to 1.0) and surgery (0.81, 95% CI 0.55 to 1.0).
Reliability of preventability was assessed in 58/61 patients consistently considered as cases. Three were excluded because one of the clinicians had been unable to judge preventability. Global agreement was 67.8% with κ 0.31 (95% CI 0.05 to 0.57), values similar to those in medicine and surgery.
Unlike the poor reliability of medical record review, as assessed by κ between 0.4 and 0.6 in the literature, the reliability of active data collection from ward staff was very good. The 6-day interval seemed sufficient to preclude the recall of the ward doctors influencing the second assessment, since the number of discordances was similar between the investigation times. Unfortunately, active data collection did not result in greater reliability in judging preventability than medical record review.
Acknowledgments
We thank for their confidence the members of the Ministry of Health: Mireille Elbaum, Chantal Cases and Brigitte Haury (DREES), Elvire Aronica et Anne Broyard-Farge (DHOS) and Elisabeth Rousseau et Anne Veber (DGS). We also thank the participating hospitals; the regional coordinators, Dr Claude Bernet, Dr Véronique Chaudier-Delage, Pr Jacques Fabry, Dr Monique Lathelize, Pr Pierre Lombrail, Dr Hélène Mendizabal, Dr Lionel Pazart, Dr Marie Laure Pibarot, Pr Roland Sambuc; the external experts for adverse drug events, Anne Castot, Caroline Kreft, Sylvie Lerebours, Christiane Angot, Jean-Michel Azanowsky, Karine Martinière (AFSSAPS), the 21 regional pharmacovigilance centres, J Ankri, N Nguyen, S Harston (clinicians), J Doucet, F Carpentier (APNET), Benoit Allenet, Edith Dufay, Etienne Schmitt, EdgarTissot (pharmacists, AAQTE-REEM); the external experts for other risks: Josseline Bertrand-Barat, JF Quaranta, Philippe Casier (medical devices vigilance), Pierre Fialon, JF Quaranta, Eric Hergon (blood products vigilance), Claude Bernet, Pierre Parneix, Jean-Christophe Lucet (care-related infections); the doctor investigators, Irchid Alnaasan, Igor Auriant, Geneviève Banssillon, Philippe Barbe, Dominique Beaudoin, Cédric Bretonnière, Corinne Bruhat, Jean François Chassignol, Bernard Demonet, Bernard Du Grès, Pierre Dupont, Claude Dupont, Alain Girod, Jean Michel Guérin, Gilles Manquat, Jean Claude Margaix, Nhan Nguyen, Jacques Ragni, Philippe Simon, Brigitte Tequi, Hugues Vencatassin, Jacques Weissenburger; the nurse investigators, Corinne Bernati, Christian et Huguette Besse, Christelle Bruneau, Dominique Chanaud, Monique Dandalet Soulié, Jacqueline Durand, Françoise Filhey, Evelyne Gastou Courthial, Sylvie Jeanne, Sylvie Lamard, Jacqueline Lamory, Josiane Larzul, Yveline Le Marrec, Virginie Leconte, Geneviève Morel, Violette Pedrono, Monique Poggio, Fabienne Ponsot, Madeleine Pultier, Françoise Roumat, Gilberte Rousselet, Josette Santoni, Mme Martine Sene-Bourgeois, Brigitte Silvestre de Ferron, Bruno Thomas.
Authors’ contributions
PM managed the project. PM and JLQ designed, wrote the original research proposal and supervised the doctor investigators. AD supervised the nurse investigators, performed data quality control and performed data analysis. STV performed data quality control and data analysis. AMS trained the nurse investigators. AD performed data quality control. All authors contributed to the final report. PM and JLQ are guarantors.
REFERENCES
Footnotes
-
Funding: Financial support was provided by the Ministry of Health (Direction de la Recherche, des Etudes, de l’Evaluation et des Statistiques). The views and opinions expressed in this article do not necessarily reflect those of the Ministry.
-
Competing interests: None.
Linked Articles
- Quality Lines