Article Text

Abstract
Background Google Trends is an innovative monitoring system with unique potential to monitor and predict important phenomena that may be occurring at a population level. We sought to validate whether Google Trends can additionally detect regional trends in youth and adult tobacco use.
Methods We compared 2011 Google Trends relative search volume data for cigars, cigarillos, little cigars and smokeless tobacco with state prevalence of youth (grades 9–12) and adult (age 18 and older) use of these products using data from the 2011 United States state-level Youth Risk Behaviors Surveillance System and the 2010–2011 United States National Survey on Drug Use and Health (NSDUH), respectively. We used the Pearson correlation coefficient to measure the associations.
Results We found significant positive correlations between state Google Trends cigar relative search volume and prevalence of cigar use among youth (r=0.39, R2 = 0.154, p=0.018) and adults (r=0.49, R2 = 0.243, p<0.001). Similarly, we found that the correlations between state Google Trends smokeless tobacco relative search volume and prevalence of smokeless tobacco use among youth and adults were both positive and significant (r=0.46, R2 = 0.209, p=0.003 and r=0.48, R2 = 0.226, p<0.001, respectively).
Conclusions The results of this study validate that Google Trends has the potential to be a valuable monitoring tool for tobacco use. The near real-time monitoring features of Google Trends may complement traditional surveillance methods and lead to faster and more convenient monitoring of emerging trends in tobacco use.
- Non-Cigarette Tobacco Products
- Surveillance and Monitoring
- Media
Statistics from Altmetric.com
Introduction
Using a web search engine is currently one of the most popular internet activities, and Google is by far the most used search engine in the world.1 Google Trends was launched by Google, Inc. in 2006 and is a keyword research tool that provides near real-time search query trend data based on Google searches (ie, publicly available data are updated daily). In recent years, health epidemiologists and econometricians have begun to recognise the value of Google Trends data in revealing important information about present behaviour and helping to predict future behaviour. For instance, studies on search query monitoring of behaviours using data from Google Trends found it to be useful for detecting regional outbreaks of influenza,2 ,3 gastrointestinal4 and Lyme5 diseases, as well as suicide.6 ,7 More recently, a study used data from Google Trends to show the rising online popularity of e-cigarettes.8 In addition, econometricians have shown that Google Trends data can forecast unemployment rates.9 Taken together, the existing studies suggest that Google Trends is an innovative monitoring system with unique potential to predict important phenomena that may be occurring at a population level.
In the present study, we examine whether Google Trends can also detect regional trends in use of non-cigarette tobacco products. Cigars, including cigarillos and little cigars, and smokeless tobacco are two non-cigarette tobacco products that are widely consumed, second to cigarettes in terms of tobacco use prevalence.10 In 2012, approximately 13.4 million people in the USA or 5.2% of persons aged ≥12 years old were current cigar smokers while 9.0 million (3.5% of persons aged ≥12 years old) were current smokeless tobacco product users.10 When examining tobacco use trends over time, there has been less progress made in reducing the use of these non-cigarette tobacco products relative to cigarette use, especially among underage youth (<18 years of age). For instance, in 2001, ∼30% of high-school youth were current cigarette smokers versus 18% in 2011.11 In contrast, the prevalence of youth using non-cigarette tobacco products has remained static for nearly a decade with ∼10–15% of high-school youth reporting current use of various cigar products or smokeless tobacco. These non-cigarette tobacco products can contribute to nicotine dependence and overall tobacco-related morbidity and mortality12 and are worthy of investigation. As a result, the primary aim of this study is to establish the validity of Google Trends as an indicator of cigar and smokeless tobacco use by evaluating whether states with higher relative volumes of Google searches for these products will have higher prevalence of tobacco use of these products.
Methods
Data source and respondents
Youth tobacco use prevalence
We used youth tobacco use prevalence estimates from the state-specific United States Youth Risk Behavior Survey (YRBS), which is a biennial school-based, state-administered survey established by the Centers for Disease Control and Prevention to measure health risk. The YRBS survey employs a two-stage, cluster sample design to produce representative samples of students in grades 9–12 in the participating state.13 To protect students’ privacy, participants volunteer to participate and completion of survey is completely anonymous. Only states with weighted data contributed to the analysis, and for states to be considered weighted, their data had to have a representative sample of students, appropriate documentation and an overall response rate of 60% or higher. In 2011, 43 states had weighted data, and in these states the student sample sizes ranged from 1147 to 13 201 (median 2170). We selected the YRBS to examine youth tobacco prevalence because, across most states, YRBS sample sizes were 2–3 times larger than National Survey on Drug Use and Health (NSDUH, described below) data for youth. Additional strengths of the YRBS are that it is the most comprehensive ongoing study of health risk behaviours among young persons in the USA and participants are queried during adolescence, which is the stage of development when exposure to the variables of interest generally occurs. Additional information about the YRBS is available at http://www.cdc.gov/healthyyouth/yrbs/.
Prevalence of youth current cigar use and current smokeless tobacco use was downloaded from the Youth Online system at http://apps.nccd.cdc.gov/youthonline/App/Default.aspx. Current use of cigar products was assessed by the YRBS question, “During the past 30 days, on how many days did you smoke cigars, cigarillos, or little cigars?” Current use of smokeless tobacco was assessed by the YRBS question, “During the past 30 days, on how many days did you use chewing tobacco, snuff, or dip, such as Redman, Levi Garrett, Beechnut, Skoal, Skoal Bandits, or Copenhagen?” When participants said they had used the product for one or more days, then we considered them to be current users. Cigar use data were available for 36 states with weighted data, and smokeless tobacco use data were available for 40 states with weighted data.
Adult tobacco use prevalence
Adult tobacco use prevalence by state was obtained from the 2010-2011 NSDUH. The NSDUH is an annual nationwide cross-sectional survey that provides population estimates of substance use and health status of the non-institutionalised US civilian population aged 12 or older. Independent, multistage area probability samples are collected for each of the 50 states and the District of Columbia. To ensure confidentiality of participants’ responses and to increase the validity of respondents’ reports of drug use behaviours, data are collected via a combination of computer-assisted personal interviewing for demographic items and audio computer-assisted self-interviewing to collect sensitive information; that is, responses to substance use modules were not disclosed to the interviewer. Informed consent was obtained from all participants. Young adults (ages 18–25) were oversampled in the NSDUH. NSDUH employed a 50-state design with an independent, multistage area probability sample for each state. In the 2010–2011 data, all 50 states and the District of Columbia contributed data with sample sizes ranging from 7684 to 1773.
A number of key strengths prompted our use of the NSDUH to measure adult tobacco use prevalence, including its query on non-cigarette tobacco products of interest and its large, representative, and randomly selected sample and high response rate.14 Prevalence of adult current cigar use and current smokeless tobacco use was downloaded from the NSDUH using the Restricted-use Data Analysis System (R-DAS). The R-DAS is an online analysis system that allows researchers to produce tables using restricted-use NSDUH data files (geographic identifiers are not included in publicly available NSDUH files); http://www.icpsr.umich.edu/icpsrweb/SAMHDA/studies/34482/datasets/1/sda/table. Current use of cigar products was assessed by the NSDUH question, “By cigars we mean any kind, including big cigars, cigarillos, and even little cigars that look like cigarettes. During the past 30 days, that is since (interviewer fills in date), on how many days did you smoke part or all of a cigar?” The responses for two items (chewing tobacco and snuff) were combined to assess current use of smokeless tobacco. First, chewing tobacco was assessed by the NSDUH question, “During the past 30 days, that is since (interviewer fills in date), on how many days did you use chewing tobacco?” Second, snuff was assessed by the NSDUH question, “During the past 30 days, that is since (interviewer fills in date), on how many days did you use snuff?” When participants said they had used the product for one or more days, then we considered them to be current users. Data were available for all states plus the District of Columbia.
Google Trends data
Relative search volume for tobacco products by state was represented by 2011 Google Trends data, which is an online log that indicates how often a particular search term is entered in the Google search engine relative to the total search volume across various regions/time. This analysis indicates the likelihood of a random user to search for a particular term from a certain location at a certain time. The data are displayed on a scale of 0 to 100. The data are first normalised in accordance with the total search volume in that region in the given time period. If the data were not normalised, regions with the most search volume would always have the highest ranking. After normalisation, each point on the graph is divided by the highest value and multiplied by 100. Search queries that have extremely low values in comparison to the normalised value of 100 are assigned a 0 volume.15
Using Google Trends data, we examined the relative search volumes for cigar and smokeless tobacco products. Google Trends compiles data for any of several search terms, up to 30 words. We compiled lists of search terms that reflected the most commonly used search terms for the product of interest. First, a list of potential search terms was composed, including general terms for the tobacco products (eg, cigars, cigarillos, little cigars), as well as popular name brands of the products (eg, Black and Mild, Swisher Sweets), including those brands with highest market shares.16 We included singular and plural forms of the items and alternate phrases. To continue building the list, we added popular ‘related terms’ as indicated by our searches in Google Trends. When the list exceeded 30 words (the Google Trends limit), we compared relative search volume for the individual terms and removed those with the lowest relative search volume. Words or phrases that might describe the tobacco products of interest but would also generate irrelevant (non-tobacco) results were excluded. For example, ‘dip’ is commonly used to describe smokeless tobacco, but it was excluded from analysis because of the high volume of unrelated tobacco searches that are also generated by this term. Results were limited to the USA and to the year 2011 because it coincided with the most recent YRBS and NSDUH available data. For cigars, relative search volume for any of the following terms was used: cigars, cigar, little cigars, cigarillo, cigarillos, flavored cigars, Black and Mild, Black and Milds, Phillies cigars, Swisher Sweet, Swisher Sweets, sweet cigars, JR cigars, Dutch Master cigars, White Owl cigars. Search terms/phrases to examine smokeless tobacco products included chewing tobacco, smokeless tobacco, chew tobacco, Skoal, Copenhagen tobacco, US tobacco, Copenhagen snuff, snuff tobacco, snus, Camel snus, Skoal tobacco, Skoal dip, dip tobacco, tobacco snuff, Grizzly tobacco, Marlboro snus.
Statistical analysis
To correlate the state Google Trends relative search volume for cigars and smokeless tobacco in 2011 with the 2011 state prevalence of youth and adult cigar and smokeless tobacco use, we used the Pearson correlation coefficient, as all variables were normally distributed (all Kolmogorov–Smirnov tests p>0.05). R2 values are also reported to provide the proportion of variance in state estimates of tobacco product use that can be explained by state Google Trends relative search volume. p<0.05 was considered statistically significant. We constructed scatter plots and choropleth maps to visualise the associations and regional trends in tobacco use and Google Trends relative search volume. SAS V.9.3 for Windows (SAS Institute, Inc., Cary, North Carolina, USA) was used for these analyses.
We additionally examined the correlations weighted by 2011 state population estimates for youth (ages 14–17 years) or adults (age ≥18 years) as appropriate (population estimates were obtained from the U.S. Census). We used Stata V.10.0 (StataCorp, College Station, Texas, USA) for weighted regression analyses and used the ‘robust’ option to estimate SEs using the Huber–White sandwich estimators. Unweighted estimates give equal importance to each state in analysis, regardless of population size, which is important for interpretation given tobacco control efforts are primarily organised at the state level. The weighted estimates provide a national perspective, as states with larger populations are given more weight and states with small populations are given less weight.
Results
Cigars, including cigarillos and little cigars
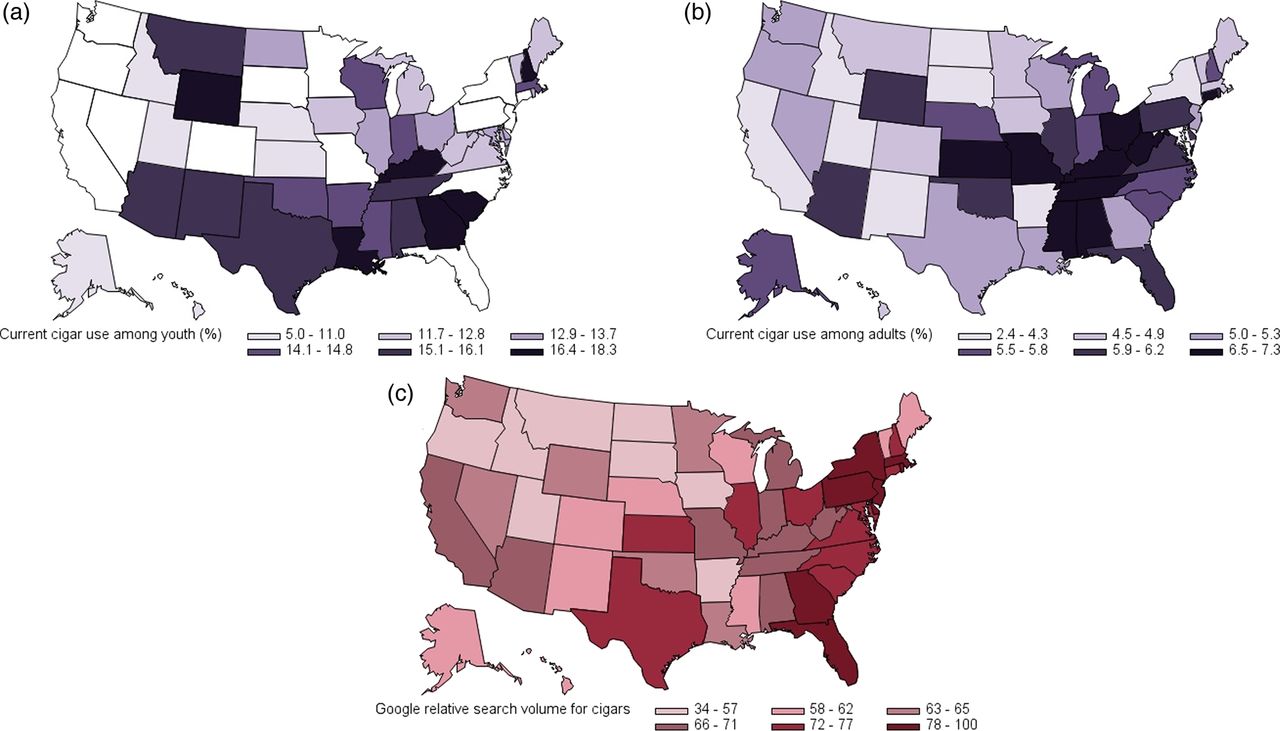
Figure 1 presents prevalence of youth (figure 1A) and adult (figure 1B) cigar use across states, as well as cigar relative search volume in Google for 2011 (figure 1C). For youth cigar use, states with the highest rates were South Carolina (18.3%), Georgia (17.8%), Kentucky (17.5%) and Louisiana (17%), and states with the lowest rates were Utah (5%), Hawaii (6.8%), Nebraska (9.6%) and Alaska (10.3%). For adult cigar use, states with the highest rates were West Virginia (7.3%), Connecticut (7.2%), District of Columbia (6.8%) and Missouri (6.7%), and states with the lowest rates were Utah (2.4%), North Dakota (3.5%), and California and South Dakota (both 3.7%). States with the highest relative volume of cigar searches (figure 1C) included Florida (100), Rhode Island (98), Pennsylvania (91), and New York and District of Columbia (both 90), and states with the lowest relative volume of cigar searches were Utah (34), Idaho (41), Iowa (49) and North Dakota (51).

Choropleth maps of youth prevalence of current cigar use in 2011 (A), adult prevalence of current cigar use in 2010–2011 (B) and Google relative search volume for cigars in 2011 (C). White states in (A) represent states where no youth prevalence data were available in 2011.
Scatter plots of state Google cigar relative search volume by youth and adult prevalence of current cigar use are presented in figure 2. For youth cigar use (figure 2A), we found a moderate positive correlation (r=0.39, R2=0.154, p=0.018). Similarly, for adult cigar use (figure 2B), we also found a moderate positive correlation (r=0.49, R2=0.243, p<0.001). When removing influential states for youth, we observed that the correlation coefficient was a bit lower and did not reach statistical significance (excluding Utah and Rhode Island; r=0.26, R2=0.070, p=0.130). For adults, no states were very influential. The states with the largest Cook's distance values were New York and Utah, but when excluded from the analysis results these were essentially unchanged (r=0.48, R2=0.230, p=0.001).
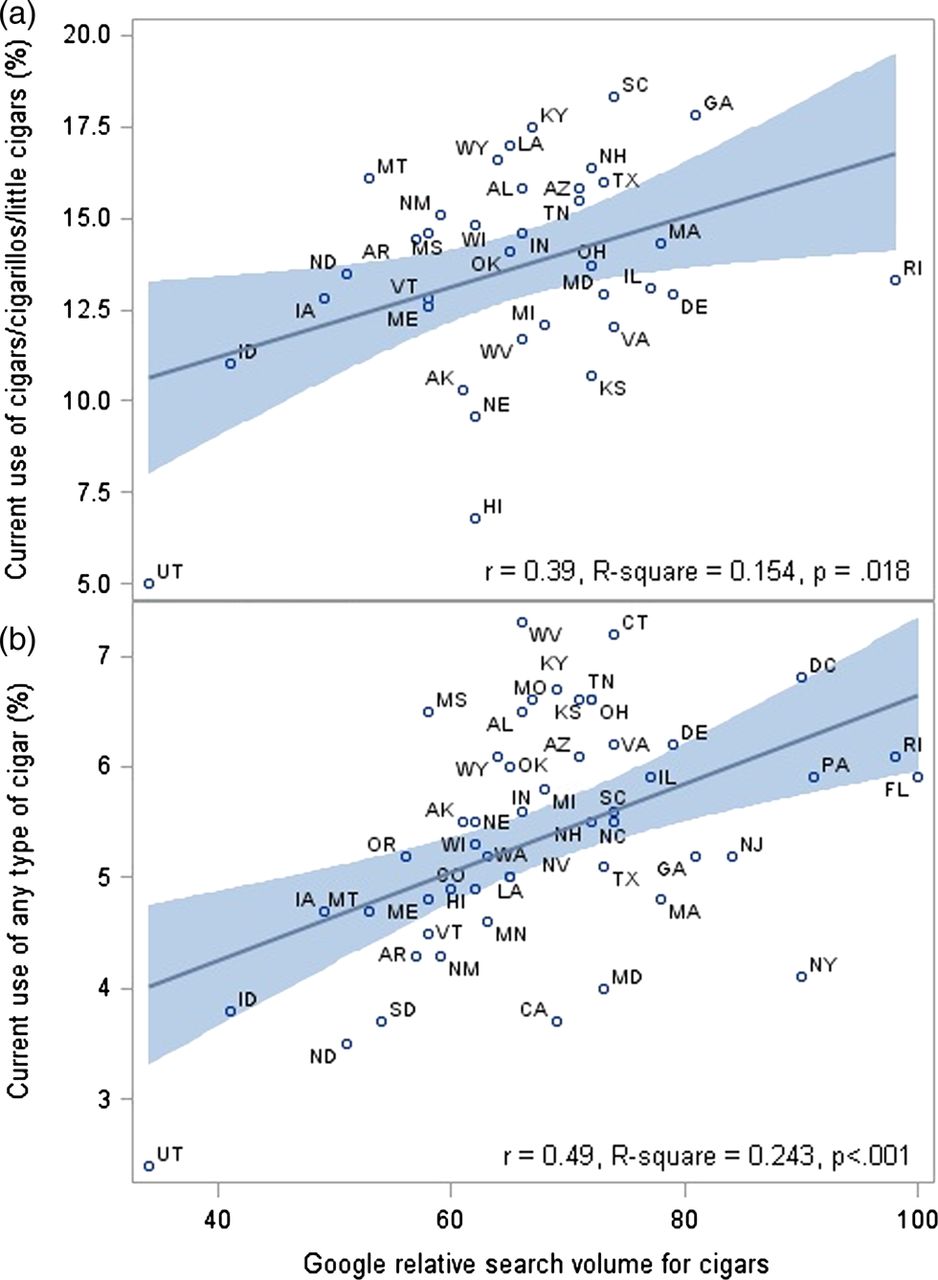
Scatter plots with regression line of Google relative search volume for cigars and current use of cigars among youth and adults by state. Both adult and youth searches are captured in the Google Trends data. Shaded area represents 95% CI for mean predicted values. (A) presents a scatter plot of 2011 Google relative search volume for cigars with 2011 prevalence of current use of cigars/cigarillos/little cigars among youth (source: 2011 Youth Risk Behavior Survey (YRBS)). Analysis was restricted to 36 states. YRBS data on prevalence of youth cigar use were not available for the remaining states. When excluding RI and UT, r=0.26, R2=0.070, p=0.130. (B) Scatter plot of 2011 Google relative search volume for cigars with 2010–2011 prevalence of current use of any type of cigar among adults (source: 2010–2011 National Survey on Drug Use and Health). Sample size includes 50 states plus the District of Columbia. When excluding NY and UT, results were similar (r=0.48, R2=0.230, p=0.001). NY, New York; RI, Rhode Island; UT, Utah; WY, Wyoming.
When examining the weighted results that account for state population size, we found a moderate positive correlation (weighted r=0.47, R2=0.221, p=0.022) for state Google cigar relative search volume by youth prevalence of current cigar use. When excluding Utah (which appeared to be influential), the correlation coefficient was a bit lower and did not reach statistical significance (excluding Utah weighted r=0.25, R2=0.062, p=0.139). The correlation for adults in weighted analysis was lower and not statistically significant (weighted r=0.20, R2=0.039, p=0.254). However, the state with the largest Cook's distance value was New York; when excluding New York, the correlation coefficient was higher and statistically significant (weighted r=0.35, R2=0.119, p=0.001).
Smokeless tobacco
Figure 3 presents prevalence of youth (figure 3A) and adult (figure 3B) smokeless tobacco use across states, as well as smokeless tobacco relative search volume in Google for 2011 (figure 3C). Youth smokeless tobacco use rates were highest in Kentucky (16.9%), Wyoming (15.1%), South Dakota (14.7%) and West Virginia (14.4%); youth smokeless tobacco use rates were lowest in Hawaii (3.5%), Utah (3.7%), Rhode Island (5.7%) and Illinois (5.8%). Adult smokeless tobacco use rates were highest in Wyoming (9.9%), Montana (9.4%), West Virginia (9.1%) and South Dakota (8.4%); adult smokeless tobacco use rates were lowest in New Jersey (0.8%), Hawaii (0.9%), Rhode Island (1.0%) and District of Columbia (1.2%). Relative search volume for smokeless tobacco (figure 3C) was highest in North Dakota (100), West Virginia (99), Iowa (81) and Montana (77).

Choropleth maps of youth prevalence of current smokeless tobacco use in 2011 (A), adult prevalence of current smokeless tobacco use in 2010–2011 (B) and Google relative search volume for smokeless tobacco in 2011 (C). White states in (A) represent states where no youth prevalence data were available in 2011.
Figure 4 is a scatter plot of state Google smokeless tobacco relative search volume by youth and adult prevalence of current smokeless tobacco use in 2011. Again, we found a moderate positive correlation for youth (r=0.46, R2=0.209, p=0.003) (figure 4A). Correspondingly, for adult smokeless tobacco use prevalence (figure 4B), we also found a moderate positive correlation (r=0.48, R2=0.226, p<0.001). When excluding Wyoming, the most influential state, the correlation coefficients were much higher (youth r=0.66, R2=0.440, p<0.001; adult r=0.70, R2=0.495, p<0.001). Notably, Wyoming had zero relative search volume for smokeless tobacco but high prevalence of use.

Scatter plots with regression line of Google relative search volume for smokeless tobacco and current use of smokeless tobacco among youth and adults by state. Both adult and youth searches are captured in the Google Trends data. Shaded area represents 95% CI for mean predicted values. (A) Scatter plot of 2011 Google relative search volume for smokeless tobacco with 2011 prevalence of current use of chewing tobacco, snuff or dip among youth (source: 2011 Youth Risk Behavior Survey (YRBS)). Analysis was restricted to 40 states. YRBS data on prevalence of youth smokeless tobacco use were not available for the remaining states. When excluding WY, r=0.66, R2=0.440, p<0.001. (B) Scatter plot of 2011 Google relative search volume for smokeless tobacco with 2010–2011 prevalence of current use of chewing tobacco or snuff among adults (source: 2010–2011 National Survey on Drug Use and Health). Sample size includes 50 states plus the District of Columbia. When excluding WY, r=0.70, R2=0.495, p<0.001.
When examining the weighted results that account for state population size, we found a strong positive correlation between state Google smokeless tobacco relative search volume and youth prevalence of current smokeless tobacco use (weighted r=0.66, R2=0.432, p<0.001) similar to unweighted analysis when excluding Wyoming. Even when excluding the most influential states (Kentucky and Texas), the correlation was still quite strong (weighted r=0.59, R2=0.354, p<0.001). Correspondingly, for adult smokeless tobacco prevalence, we also found a strong positive correlation (weighted r=0.67, R2=0.454, p<0.001). Again, when excluding the most influential states (California and New York), the correlation coefficient was still relatively strong (weighted r=0.58, R2=0.331, p<0.001).
Discussion
The relative volume of Google searches for non-cigarette tobacco products differed across states and illustrates how geographically varied the public is in their relative search volume trends of these products. For example, Texas and Georgia had high Google relative search volumes for cigar products but were relatively low in their Google searches for smokeless tobacco products. In contrast, North Dakota and West Virginia had relatively high Google relative search volumes for smokeless tobacco products but were comparatively low in their Google searches for cigars. Correspondingly, youth use of these tobacco products in these states matched with the state Google relative search volume trends. When examining these associations across states and among youth and adults, we found a moderate positive correlation between relative volume of Google searches for non-cigarette tobacco products and prevalence of youth and adult use of cigars and smokeless tobacco products. Because tobacco control efforts are often regulated at the state level, these primary results are derived from unweighted analyses where data from all states are considered equal, irrespective of the state's population size. Nevertheless, associations remained relatively consistent even when accounting for population size of the states with the exception of adult tobacco use of cigars, which reached significance after New York, the most influential state in this analysis, was excluded. Thus, while internet relative search volumes have been shown in past studies to detect regional outbreaks of influenza2 ,3 and suicide,6 ,7 our findings validate that this methodology may also be a useful indicator for tracking tobacco use among youth and adults.
The strength of the associations in our study was similar, but slightly lower for cigars, compared with the measures of association found in the past studies that examined the utility of Google Trends as a public health monitoring tool. For example, the proportion of variance in youth suicide behaviours explained by suicide-related internet searches ranged from 0.25 to 0.49.6 In addition, the R2 values for the association between kidney stone Google searches and kidney stone disease ranged from 0.25 to 0.37.17 In Canada, the R2 value for the association between internet searches of the term ‘listeriosis’ with an early detection of outbreaks was 0.38.4 In our study, associations were comparable for smokeless tobacco with R2 values of 0.21 to 0.49, and lower for cigars with R2 values of 0.07 to 0.24. The proportion of variance in use of these tobacco products explained by Google Trends searches is relatively modest. Based on these findings, we would not recommend that Google Trends data be used as a substitute for traditional surveillance methods, but rather to complement such methods in order to provide an idea of real-time patterns in tobacco product use and interest that could help state tobacco control programmes identify prevention needs. We acknowledge the novelty of using Google Trends as a monitoring tool that could undoubtedly be improved upon with further evaluation and refinement.
We found that the correlations between Google Trends relative search volume and prevalence of smokeless tobacco use were somewhat stronger than the correlations between Google Trends relative search volume and prevalence of cigar use. This possibly reflects the distinct demographic and regional variations that exist among smokeless tobacco consumers. For instance, smokeless tobacco use is more common and socially acceptable in rural areas of the USA and across Southern and Midwestern states.18–21 Thus, it may be that Google Trends data are more sensitive to tobacco use prevalence when distinct geographic patterns of use exist.
To a relatively small degree, Google Trends data better predicted cigar consumption patterns for adults versus youth in unweighted analysis. It may be that the relative volume of Google searches for cigars and smokeless tobacco products is driven in large part by searches from adults who are more likely to consume cigars versus youth.10 This could also be because of the growing popularity of cigars, in general, but especially among young adults who are 18–25 years old.22 Irrespective of the cause, our findings provide evidence that Google Trends has the potential to be a valuable surveillance tool for youth and adult tobacco use.
The near real-time monitoring features of Google Trends in conjunction with traditional survey methods could improve researchers’ and public health officials’ ability to stay abreast of emerging trends in tobacco use. Google Trends data are immediate, free and easy to access for all users of the World Wide Web. In the present study, we document the utility of these data in assisting key stakeholders with tracking tobacco use patterns with reduced cost and in near real time. Google Trends data might also be useful when developing and/or updating survey questions that query youth on their tobacco product use. For example, the YRBS smokeless tobacco question lists specific brands of this product to more thoroughly question youth about their use. However, brands listed by YRBS included ‘Redman tobacco’ and ‘Levi Garrett’, which yielded lower Google relative search volumes than other smokeless tobacco brands/search terms (eg, Skoal tobacco, Grizzly tobacco). We therefore speculate if survey developers can similarly use Google Trends data to delineate more popular and contemporary tobacco brands/products and to update questionnaires to improve the measurement of tobacco use.
A limitation of Google Trends is that adult and youth searches are captured in the data and Google search differences across age groups cannot be considered. In addition, not all online search activities are represented in this database. Other web search engines could have been used (eg, Bing) or bypassed all together by individuals going directly to certain websites. In addition, we examined only search terms in the English-language and internet search queries in the USA; thus, generalisation of the results to other countries requires caution. Moreover, Google Trends designates a certain threshold of traffic for search terms so that states with low relative search volume are assigned a zero. Also, the available data are derived from a sample of Google web searches, which could possibly cause a non-representative sampling bias.15 Only high-school youth (primarily attending public schools) were assessed in the YRBS, and more vulnerable youth who are not attending school are not assessed. Additionally, youth and adult use of cigars and smokeless tobacco products were the only non-cigarette tobacco products that were queried; therefore, use of e-cigarettes, hookah and other alternative tobacco products was not assessed and consequently unavailable for analysis. Lastly, validating the use of Google Trends to monitor temporal trends is beyond the scope of this study. Nevertheless, based on data showing increased search volume for electronic cigarettes over time, it has been suggested that surveillance of search queries could be used to monitor the diffusion of new health products.8 Google Trends data could be useful for monitoring the trends in Google searches in newest tobacco products that are not yet assessed in standard monitoring systems as potential consumers seek out more information.
Despite intensified control policies, tobacco use remains the most preventable cause of premature death and disability in the USA.23 ,24 Therefore, efforts to track tobacco use in near real time are an important endeavour that could assist key stakeholders with making informed decisions about prevention plans and policies. This is especially relevant in consideration of the new and emerging tobacco products that are increasing in promotion and consumption.25 ,26 In the present study, we leverage free data from Google Trends to study relative volume of searches for tobacco-related terms and obtain deeper insight about youth and adult tobacco use. We do not advise that Google Trends be used as a substitute for standard surveillance tools that have been extensively validated as reliable resources for measuring tobacco use at a population level; yet, Google Trends data can be used to complement these standard monitoring systems that are typically published with a 1–2-year delay. Thus, our findings validate that this accessible methodology may promptly track tobacco use at a population level.
What this paper adds
-
Efforts to promptly track tobacco use at a population level are an important endeavour that could assist key stakeholders with making informed decisions about prevention plans and policies. Our findings establish the validity of Google Trends as an indicator of cigar and smokeless tobacco use by demonstrating that states with higher relative volumes of Google searches for cigar and smokeless tobacco products have higher prevalence of tobacco use of these products. The near real-time monitoring features of Google Trends could be used to supplement traditional survey methods to obtain deeper insight about youth and adult tobacco use.
References
Footnotes
-
Contributors PAC-R originated and supervised the study and led the writing of the article. MJK and AL assisted with data abstraction and management, completed the analyses and participated in the writing. ELS participated in the writing and assisted with the study and the analyses. FJC assisted with drafting the article, interpreting results and revising it for important intellectual content. RAG assisted with interpreting results, supervised the study and reviewed and commented on the article. LJB supervised the study, assisted with interpreting results and participated in the writing. All authors were involved in approving the final submitted version of the article.
-
Funding This publication was made possible by grant numbers UL1 RR024992 and KL2 RR024994 from the National Center for Research Resources (NCRR), a component of the National Institutes of Health (NIH), and NIH Roadmap for Medical Research. Other support includes an NIH Career Development Award awarded to PAC-R (NIDA, K01DA025733) and NIDA, R01 DA032843, an NIH Midcareer Investigator Award awarded to LJB (K02 DA021237), R01 DA031288 awarded to RAG.
-
Competing interest LJB is listed as an inventor on Issued US Patent 8,080,371, ‘Markers for Addiction’, covering the use of certain SNPs in determining the diagnosis, prognosis and treatment of addiction.
-
Ethics approval This project was exempted from ethics committee approval on our campus as it involved use of data that are part of the public domain.
-
Provenance and peer review Not commissioned; externally peer reviewed.
-
Data sharing statement All data are publically available on the internet.