Article Text

Abstract
OBJECTIVE To test the hypothesis that environmental tobacco smoke (ETS) exposure is inversely associated with socioeconomic status.
DESIGN Survey.
SETTING General community, New Zealand.
PARTICIPANTS 7725 non-smoking adults (volunteer sample of a multi-industry workforce, n = 5564; and a random sample of urban electoral rolls, n = 2161), including 5408 males; mean age 45 years.
MAIN OUTCOME MEASURES ETS exposure was assessed as self-reported number of hours per week spent near someone who is smoking, and as prevalence of regular exposure to some ETS. Socioeconomic status was assessed as educational level, occupational status, and median neighbourhood household income.
RESULTS Both measures of ETS exposure were steeply and inversely associated with all three indicators of socioeconomic status (all p<0.0001). Geometric mean ETS exposure ranged from 16 minutes per week among university-educated participants to 59 minutes per week in the second lowest occupational quintile (95% confidence intervals: 14–18 minutes per week and 54–66 minutes per week). The associations with occupational status and educational level were steeper than those with neighbourhood income. The socioeconomic gradients of ETS exposure were steeper among participants aged less than 35 years than among participants aged over 50 years, among men than women, and among Maori than Europeans.
CONCLUSIONS In this study population, ETS exposure was inversely associated with socioeconomic status. Greater ETS exposure might therefore contribute to the higher risks of disease and death among low socioeconomic groups. These results provide a further rationale for targeting tobacco control measures to people in low socioeconomic groups.
- environmental tobacco smoke
- socioeconomic status
- population survey
Statistics from Altmetric.com
In many populations, mortality and morbidity from a variety of causes are inversely associated with socioeconomic status.1-3 These associations can be partly accounted for by higher levels of smoking among low socioeconomic groups,4 5 because smoking is a well-established cause of disease and death.6 These associations might also be partly accounted for by higher levels of exposure to environmental tobacco smoke (ETS) among low socioeconomic groups, because ETS exposure has been observed to increase the risks of several diseases, including lung cancer and ischaemic heart disease.7However, relatively few data are available about the associations of ETS exposure with socioeconomic status. It would seem likely that these associations are similar to the associations of smoking with socioeconomic status; however, the precise magnitude of the associations of ETS exposure with socioeconomic status in most populations is uncertain.
The aim of this study was to investigate the associations of ETS exposure with socioeconomic status in a large population of non-smokers. The study involved cross-sectional analyses of baseline data from the Fletcher Challenge-University of Auckland Heart and Health Study (a prospective cohort study designed to investigate the causes of chronic disease in a New Zealand population).8
Methods
STUDY POPULATION
The study population consisted of the 7725 non-smokers in the Fletcher Challenge-University of Auckland Heart and Health Study8 (this number excludes 225 non-smokers with missing ETS data, and 10 non-smokers who reported ETS exposure of more than 120 hours per week). Non-smokers were defined as participants who at baseline data collection (between June 1992 and March 1993) reported that they were not current smokers of cigarettes. Study participants were recruited from two sources: the workforce of a nationwide multi-industry corporation, Fletcher Challenge Limited (5564 participants), and the electoral rolls of Auckland city (2161 participants). All employees of Fletcher Challenge were invited to participate, and electoral roll participants were selected randomly. The overall response rate was 74% (workforce cohort 76%, electoral roll cohort 66%). The study population was 70% male, 7% Maori, 4% Pacific Islands people, and 88% European or other ethnicity (hereafter referred to as European). The mean age was 45 (SD 16) years.
DATA COLLECTION
At baseline, participants completed a self-administered questionnaire and underwent a simple physical examination. Full details of the study methods are described elsewhere.8 ETS exposure was assessed as self-reported usual number of hours each week spent near someone who is smoking (Question: “On average, how many hours each week (at work and at home) would you spend near someone who is smoking? ___ hours”). Socioeconomic status was assessed by three indicators: highest level of educational attendance, occupational status (Ganzeboom’s International Socioeconomic Index9), and median neighbourhood household income. Median neighbourhood household income (NZ$) was obtained by matching home addresses with 1991 New Zealand census records.
STATISTICAL METHODS
For the purposes of these analyses, each of the indicators of socioeconomic status was divided into five groups: educational level (university, polytechnic, secondary school for more than three years, secondary school for two to three years, and secondary school for less than two years), International Socioeconomic Index scores (quintiles), and neighbourhood income (quintiles).
Two measures of ETS exposure were used: self-reported ETS exposure, and prevalence of regular exposure to some ETS. Regular exposure to some ETS was defined as self-reported ETS exposure of more than 0 hours per week.
Statistical analyses were performed using SAS software.10 All statistical tests reported here are two-tailed. Prevalence of regular exposure to some ETS was adjusted for age, sex, and ethnicity by the direct method, using the study population as the standard. Differences between prevalences were tested by logistic regression. All mean ETS exposures reported here are geometric (calculated by logarithmic transformation, with zero values coded as 0.5), and these were adjusted for age, sex, and ethnicity by multiple linear regression. Differences between means were tested by analysis of covariance. Interactions of socioeconomic status with age, sex, or ethnicity were assessed by fitting interaction terms in the multiple linear regression models. Socioeconomic gradients of ETS exposure were estimated by simple linear regression of socioeconomic subgroup means on subgroup number (1–5). Standard errors (SE) for regression slopes were obtained from these regression analyses, and thus indicate variability of subgroup means rather than variability of individual participant ETS values. Attributable fraction was calculated as the difference between the mean ETS exposure for the total study population and the mean ETS exposure for the highest socioeconomic group, expressed as a percentage of the mean ETS exposure for the study population.
Results
SOCIOECONOMIC CHARACTERISTICS OF THE STUDY POPULATION
Data about education, occupation, and income were available for most participants (99%, 89%, and 90%, respectively). Disproportionately more Maori and Pacific Islands people than Europeans were in the lower educational, occupational, and neighbourhood income groups, and disproportionately more men than women were in the highest and lowest occupational quintiles (table 1). The mean age of participants in the lowest educational group was at least eight years higher than the mean age of participants in the other socioeconomic groups.
Socioeconomic characteristics of the study population
DISTRIBUTION OF ETS EXPOSURES
The mean self-reported ETS exposure in the total study population was 34 minutes per week (workforce cohort: 47 minutes per week; electoral roll cohort: 15 minutes per week). A total of 3414 participants (44% of the study population) reported regular exposure to some ETS (workforce cohort: 2919 participants, 52%; electoral roll cohort: 495 participants, 23%). The frequency distribution of ETS exposures was skewed to the right—for example, 572 participants reported an ETS exposure in excess of 20 hours per week.

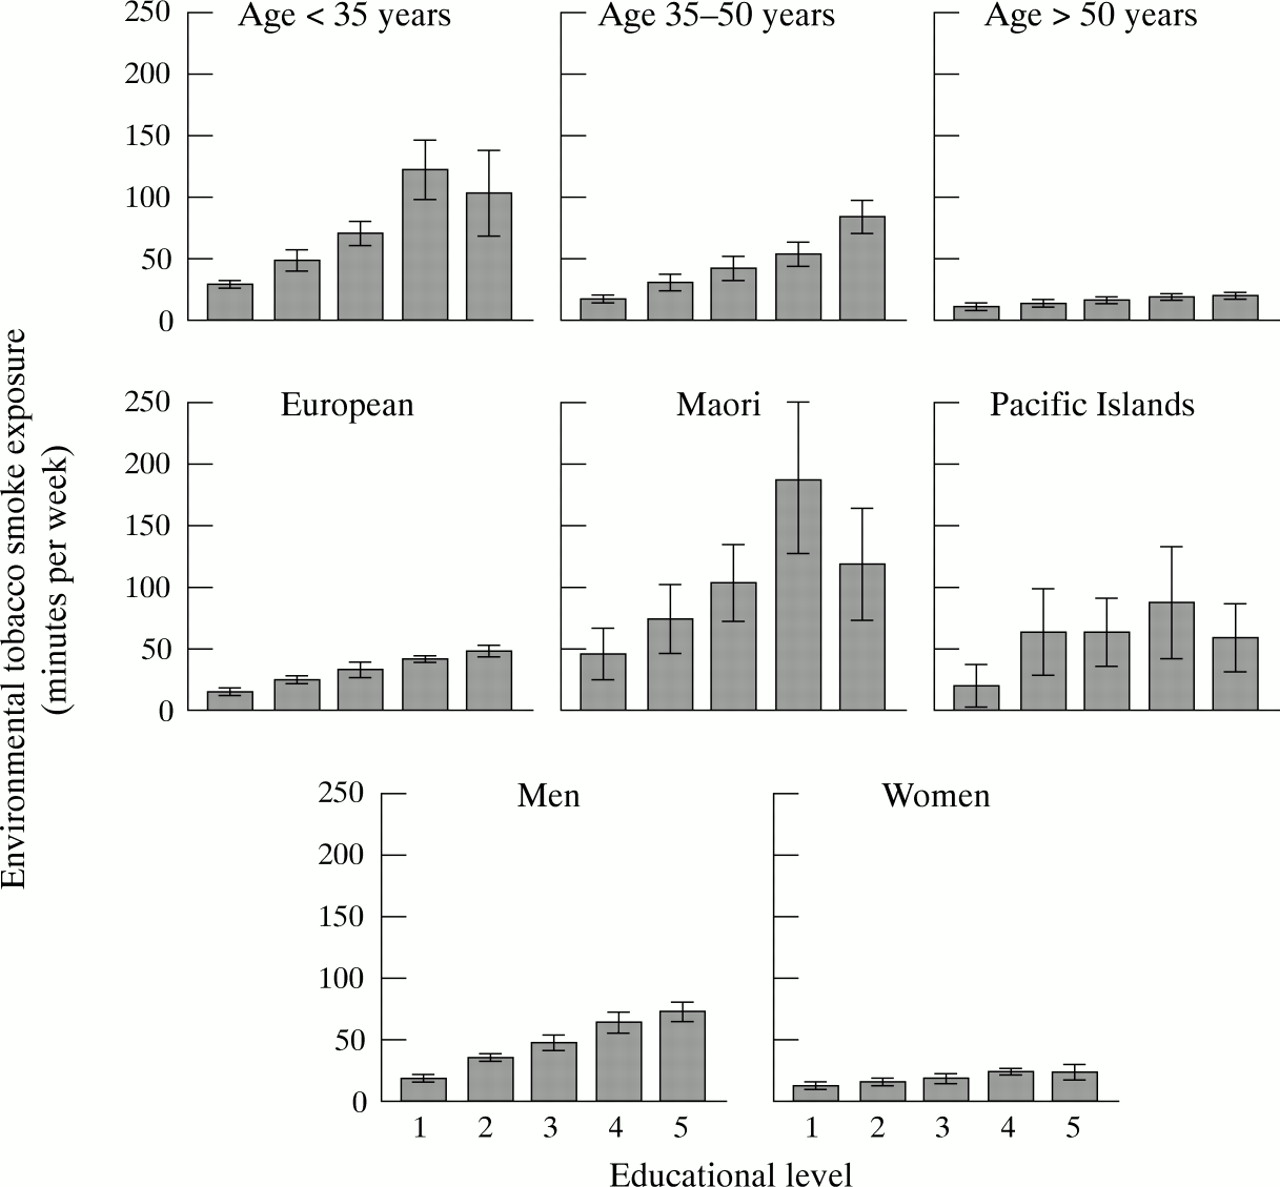
Associations of environmental tobacco smoke exposure with educational level, by age, ethnicity, and sex. Point estimates are geometric means, and error bars are 95% confidence intervals. Means have been adjusted for age and sex (or when stratified by one of these, adjusted for the other). In each graph, educational level decreases from left to right (1 = university, 2 = polytechnic, 3 = secondary school for more than three years, 4 = secondary school for two to three years, 5 = secondary school for less than three years). Interactions with education: age (p<0.0001), ethnicity (p<0.0001), and sex (p = 0.003).
ASSOCIATIONS OF ETS EXPOSURES WITH AGE, SEX, AND ETHNICITY
Mean ETS exposure and prevalence of regular exposure to some ETS were both higher among younger participants than among older participants, among men than women, and among Maori than Europeans (all p<0.0001) (table 2). Notably, participants aged less than 35 years were almost twice as likely to be regularly exposed to ETS as participants aged over 50 years.
Prevalence of regular exposure to some ETS and mean ETS exposure in each age, sex, and ethnic subgroup
ASSOCIATIONS OF ETS EXPOSURE WITH SOCIOECONOMIC STATUS
After adjustment for age and sex, both measures of ETS exposure were steeply and inversely associated with all three indicators of socioeconomic status (all p<0.0001) (table 3). Each of these associations persisted after additional adjustment for ethnicity (all p<0.0001). ETS exposure was highest among participants in the lowest two occupational quintiles (55% regularly exposed to some ETS, mean exposure 57–59 minutes per week), and lowest among university-educated participants (30% regularly exposed to some ETS, mean exposure 16 minutes per week). As assessed by attributable fraction, socioeconomic status accounted for between 38% (estimated from neighbourhood income) and 53% (estimated from education) of self-reported ETS exposure.
Associations of environmental tobacco smoke exposure with indicators of socioeconomic status
The regression slopes of the associations of self-reported ETS exposure with socioeconomic status were somewhat greater for occupation and education than for neighbourhood income (regression slopes: occupation 10.3 (SE 2.3), education 9.8 (SE 0.8), neighbourhood income 5.1 (SE 1.1); units for each slope—minutes per week per socioeconomic category).
Inverse associations of level of ETS exposure with the three indicators of socioeconomic status were present not only in the total study population, but also among both sexes, all age groups, and both Europeans and Maori (all p<0.03). No associations were observed among Pacific Islands people (all p>0.1). The associations of self-reported ETS exposure with educational level in each age, sex, and ethnic subgroup are shown in the figure. Interactions were observed between educational level and age (p<0.0001), ethnicity (p<0.0001), and sex (p = 0.003). The gradients of self-reported ETS exposure with educational level were steeper among participants aged less than 35 years than among participants aged over 50 years, among Maori than Europeans, and among men than women. Similar interactions were observed for occupation and income, except that the interactions between income and age (p = 0.06), and between income and sex (p = 0.05), were of borderline statistical significance.
Discussion
In this population of 7725 non-smoking New Zealand adults, ETS exposure was inversely associated with educational level, occupational status, and median neighbourhood income. The associations with occupational status and educational level were somewhat steeper than those with neighbourhood income; and the associations with each of these indicators were relatively steep among young adults, men, and Maori. No associations were observed among Pacific Islands people, but this may have reflected a lack of statistical power to detect moderate or weak associations in this subgroup (the study population included a total of only 272 Pacific Islands people).
Theoretically, these results could have been accounted for by differential misclassification of either ETS exposure or socioeconomic status (misclassification of ETS exposure that was not independent of socioeconomic status, or misclassification of socioeconomic status that was not independent of ETS exposure). There is evidence, however, that self-reported ETS exposure is a reasonably valid and reliable indicator of ETS exposure,11-13 and it seems unlikely that misclassification of ETS exposure could have differed sufficiently among socioeconomic groups to account for associations as strong as those observed. Similarly, it seems unlikely that differential misclassification of socioeconomic status could have accounted for associations of this magnitude. Indeed, the relatively shallow associations with neighbourhood income may have been due to substantial non-differential misclassification of this variable, because neighbourhood income is only an approximate indicator of individual income.
Some previously published data are available about the associations of ETS exposure with socioeconomic status among non-smoking adults14-21 and children.22-24 These data either showed that ETS exposure was inversely associated with socioeconomic status,14-17 22 23 or their evidence was equivocal.18-21 24 However, several of these reports did not test for statistical significance or adjust for potential confounding by age, sex, or ethnicity. The possibility that their results were due to chance or confounding is therefore difficult to assess. Three of the studies involving adult populations did test for statistical significance and adjust for confounding.14-16Each of these studies reported moderate-to-strong inverse associations of ETS exposure with socioeconomic status. These studies were limited somewhat, however, by small sample size,16 study populations restricted to women,14 16 use of binary indicators only of socioeconomic status,15 and lack of control for potential confounding by ethnicity.15 16
Our study provides clear evidence that ETS exposure was inversely associated with socioeconomic status in a large population of non-smoking adults. These associations are unlikely to have been due to chance, misclassification, or confounding (by age, sex, or ethnicity). In addition, these associations were of broadly similar magnitude to associations of prevalence of current smoking with socioeconomic status observed in the same population.25 Although this finding is not surprising, it is noteworthy because associations of ETS exposure with socioeconomic status cannot be predicted exactly from the socioeconomic distribution of smoking. For instance, the associations of ETS exposure with socioeconomic status would be particularly steep if non-smokers of low socioeconomic status spend disproportionately more time in the company of smokers than do non-smokers of high socioeconomic status.
These findings provide a further rationale for targeting tobacco control policies to low socioeconomic groups. In particular, policies that provide better protection from ETS for workers in blue-collar workplaces are required. Although this study did not have information about the proportion of ETS exposure that occurred in the workplace, workplace exposures almost certainly contributed to the observed socioeconomic gradients of ETS exposure. The workplace is a potentially important source of exposure to ETS.12 Since 1990, smoke-free legislation in New Zealand has generally banned smoking in offices but not in other workplaces (such as on factory shop floors).26 Smoke-free legislation that provides better protection from ETS for workers in blue-collar workplaces could consequently be expected to help reduce the high levels of ETS exposure among low socioeconomic groups in New Zealand.
Acknowledgments
We thank Amanda Milne (data manager), Alan McCulloch (computer programmer), the study nurses responsible for collecting data, Fletcher Challenge management at the participating worksites, and the study participants. We thank Robert Beaglehole for providing comments on an earlier draft of this paper. The study was funded by the Fletcher Challenge Welfare Fund, the National Heart Foundation of New Zealand, and the Health Research Council of New Zealand.