Article Text

Abstract
Aims: (1) To explore the relation between performance on tasks of familiar face recognition (FFR) and face expression difference discrimination (FED) with both perceived disability in face recognition and clinical measures of visual function in subjects with age related macular degeneration (AMD). (2) To quantify the gain in performance for face recognition tasks when subjects use a bioptic telescopic low vision device.
Methods: 30 subjects with AMD (age range 66–90 years; visual acuity 0.4–1.4 logMAR) were recruited for the study. Perceived (self rated) disability in face recognition was assessed by an eight item questionnaire covering a range of issues relating to face recognition. Visual functions measured were distance visual acuity (ETDRS logMAR charts), continuous text reading acuity (MNRead charts), contrast sensitivity (Pelli-Robson chart), and colour vision (large panel D-15). In the FFR task, images of famous people had to be identified. FED was assessed by a forced choice test where subjects had to decide which one of four images showed a different facial expression. These tasks were repeated with subjects using a bioptic device.
Results: Overall perceived disability in face recognition did not correlate with performance on either task, although a specific item on difficulty recognising familiar faces did correlate with FFR (r = 0.49, p<0.05). FFR performance was most closely related to distance acuity (r = −0.69, p<0.001), while FED performance was most closely related to continuous text reading acuity (r = −0.79, p<0.001). In multiple regression, neither contrast sensitivity nor colour vision significantly increased the explained variance. When using a bioptic telescope, FFR performance improved in 86% of subjects (median gain = 49%; p<0.001), while FED performance increased in 79% of subjects (median gain = 50%; p<0.01).
Conclusion: Distance and reading visual acuity are closely associated with measured task performance in FFR and FED. A bioptic low vision device can offer a significant improvement in performance for face recognition tasks, and may be useful in reducing the handicap associated with this disability. There is, however, little evidence for a correlation between self rated difficulty in face recognition and measured performance for either task. Further work is needed to explore the complex relation between the perception of disability and measured performance.
- face recognition
- disability
- age related macular degeneration
- telescope
Statistics from Altmetric.com
A ge related macular degeneration (AMD) is the leading cause of visual impairment in developed countries.1–3 The visual impairments associated with AMD cause a number of disabilities,4 including difficulty recognising faces.5 People with AMD consider their disability in face recognition to be of great significance,6 since this disability can impact on social interactions; problems may arise both from the failure to identify familiar people and in the interpretation of non-verbal clues such as facial expressions. In most previous studies of face recognition/expression identification in visual impairment, observers were required to identify standardised grey scale images.5,7–12 While this task appears to relate both to visual acuity and to contrast sensitivity (CS), it is unclear whether discrimination at high contrast or detection at low contrast is most closely related to face recognition. It is also unclear whether colour vision function correlates with face recognition performance in AMD. Arguably the presentation of images with a wider range of luminance and colour contrasts may be more relevant to “real world” performance than the use of standardised grey scale images. At the same time, while face recognition disability is encountered very frequently by low vision clinicians, enhancement of this function is rarely considered as a rehabilitation goal. Indeed, obtaining help with reading and other near vision related daily living tasks is the primary goal for low vision assessment,13 possibly because clinicians believe that there are few practicable methods for enhancement of function for face recognition, despite the availability of bioptic telescopes that appear to offer this possibility.14,15 (Bioptic devices are spectacle mounted above the optical axis. Thus, a user can look through their normal spectacle correction most of the time and obtain magnification by lowering the head to look through the telescope when they wish to spot an object in more detail.)
In a detailed survey on the pattern of low vision device use by 200 US veterans,16 only 9% of all prescribed devices were used for the task of “identifying faces,” although no specific information was provided on the number of bioptic versus full field telescopic devices. Bioptic devices make the task of face recognition more feasible, since their design allows the user to wear the device while mobile, thereby facilitating more prolonged use. Despite these potential benefits, such devices are rarely prescribed in the United Kingdom.17
Thus, the objectives of this study were twofold: Firstly, to explore relations between tasks of familiar face recognition (FFR) and discrimination of face expression difference (FED) on the one hand, and perceived disability in face recognition and standard clinical measures of visual function on the other. Secondly, to determine to what extent performance in the face recognition tasks can be improved using a bioptic device.
METHODS
Subjects who had previously participated in a randomised controlled trial of low vision services18 were invited to participate in this study. Ethical approval for the study was obtained through the Central Manchester local research ethics committee and informed consent was obtained from each subject. Patients were included if they were white UK residents with a primary diagnosis of bilateral AMD and had a visual acuity in the better eye between 0.4–1.4 logMAR (that is, 6/15 to 6/150, this being an acuity range most likely to be responsive to the telescopic magnification). Non-white people were excluded because a cross race recognition deficit (that is, people are better at recognising faces within their own race) is well documented.19 Subjects not residing in their own homes, those requiring full time professional health care, or those suffering from mental illness or dementia were also excluded. A total of 30 subjects were included in the study (10 males and 20 females, mean age 81.5, range 66–90 years). Fourteen subjects (47%) had previous experience with conventional full field telescopic devices, but none had experience with a bioptic device.
Visual function assessment
Visual function was assessed using the appropriate spectacle correction for the relevant working distance of the test, as determined following refraction. All tests were performed using recommended levels of illumination/luminance and were performed using standardised procedures under instruction by a single examiner (LT). LogMAR distance visual acuity was measured both monocularly and binocularly with an internally illuminated Lighthouse ETDRS chart using a by-letter scoring method. Binocular continuous text reading acuity was measured at 40 cm using the MNREAD charts. Subjects were asked to start reading from the top line of the chart, and were encouraged to continue reading until no more words could be correctly read. To calculate the reading acuity, the number of sentences read or attempted to be read by the subject, and the number of words read incorrectly in those sentences were counted. Reading acuity was calculated word by word (that is, to the nearest 0.01 logMAR), by applying the recommended formula:
Acuity = 1.4 − (sentences × 0.1) + (errors × 0.01)
Low contrast letter sensitivity was measured under binocular conditions using the Pelli-Robson chart at a distance of 1 metre. A recommended by-letter scoring system was used20 and any miscalling of the letter “C” as an “O” or vice versa was accepted as correct.21
Colour vision was assessed using the large panel version of the D-15 test. The 15 test caps were presented in a semirandom order, with the reference cap always being presented first. The test was performed binocularly without time constraints, and subjects were permitted to inspect the caps at the most comfortable distance. The confusion index (c-index = 1 for a correct cap arrangement, whereas arrangement errors result in a larger value) was extracted from the cap order arrangement using software developed by Vingrys et al.22
Perceived disability in face recognition
Self rated disability for face recognition and expression discrimination was assessed by an eight item questionnaire. The questionnaire consisted of eight statements about face recognition, the consequences of this disability, and the attitude adopted by the subject towards their disability. The statements had “face validity,” having been generated following a review of the low vision literature and consultation with two clinicians with a specialist interest in low vision. Subjects rated how strongly they agreed/disagreed with the following statements on a four point Likert scale:
-
I have difficulty recognising familiar faces in the street
-
I would probably recognise a member of my family at the following distance
-
I am embarrassed constantly by failing to recognise friends in the street
-
I recognise friends only when they start to speak
-
I usually recognise characters on the TV because of their voices and not because I see their faces
-
I have difficulty following TV programmes because I cannot recognise the characters
-
I feel I sometimes miss something in conversations because I cannot see the expression in other people’s faces
-
The difficulty I have recognising faces in the street really bothers me.
Responses to these individual statements were scored from 0 to 3 depending on a subject’s extent of agreement/disagreement. Hence, scores ranged from 0 for “disagree strongly” to 3 for “agree strongly” (statements 1 and 3–8). Statement 2 required a subject to indicate the distance at which they were likely to recognise a member of their family (that is, “across the street,” “across a room,” “sitting next to me,” “none of the above”), for which scores were allocated from 0–3 respectively. In order to obtain an overall estimate of perceived disability, scores for individual items were summed to provide a total disability score with a potential range from 0 (no perceived disability) to 24 (maximum perceived disability).
Measured disability in face recognition
The assessment of face recognition performance comprised two different tests, familiar face recognition (FFR) and discrimination of face expression difference (FED). Both tasks were performed at 4 metres, initially binocularly with the subjects’ optimal refractive correction, and subsequently using the Ocutech VES (a bioptic Keplerian low vision telescope with autofocus capability). This monocular device was used for these tasks with the “better” eye (regardless of ocular dominance), as determined by the visual acuity with the optimal refractive correction. For both tasks, the test images were displayed on a screen at a 4 metre distance using a digital projector (SVGA, Impression A8+, ASK, Norway, www.askproxima.com). The display resolution was 600 × 800 pixels. The measured minimum and maximum luminance levels using test images of white squares on a black surround were 20 cd/m2 and 273 cd/m2 respectively (Weber contrast ratio ≥0.9). No attempt was made to gamma correct the device, since we had little control over the contrast/colour rendition in the source images for FFR.
FFR task
Following a demonstration trial, 20 test images were each displayed for 4000 ms. The 20 facial images were digitised from a range of photographs in popular magazine publications and included members of the UK Royal Family, sportsmen and women, politicians, and celebrities (10 males, 10 females). These images were selected following a pilot study where 35 colour facial images of famous people were displayed to 35 normally sighted elderly subjects (mean age = 67.7 years, range 51–89) using a laptop PC. In order that the FFR images were likely to be familiar to subjects included in the main trial, the 10 images of males and 10 images of females with the highest percentage correct recognition from this pilot study (ranging from 94% to 100% correct recognition) were selected for inclusion.
Images were cropped to head only and resized to 483 × 471 pixel size (24 bit colour depth). Images were displayed “life size” at 4 metres from the subject, with the angular subtense of total image being 4.9° (faces within this displayed image subtending ∼3°). Face recognition ability was scored as the percentage of correctly identified images as a proportion of the number of images identified at 0.35 metre (facial angular subtense ∼30°), in order to distinguish between failed recognition due to visual impairment and failed recognition due to lack of familiarity with the displayed images. In each case, this control task was carried out after the FFR test data had been collected.
FED task
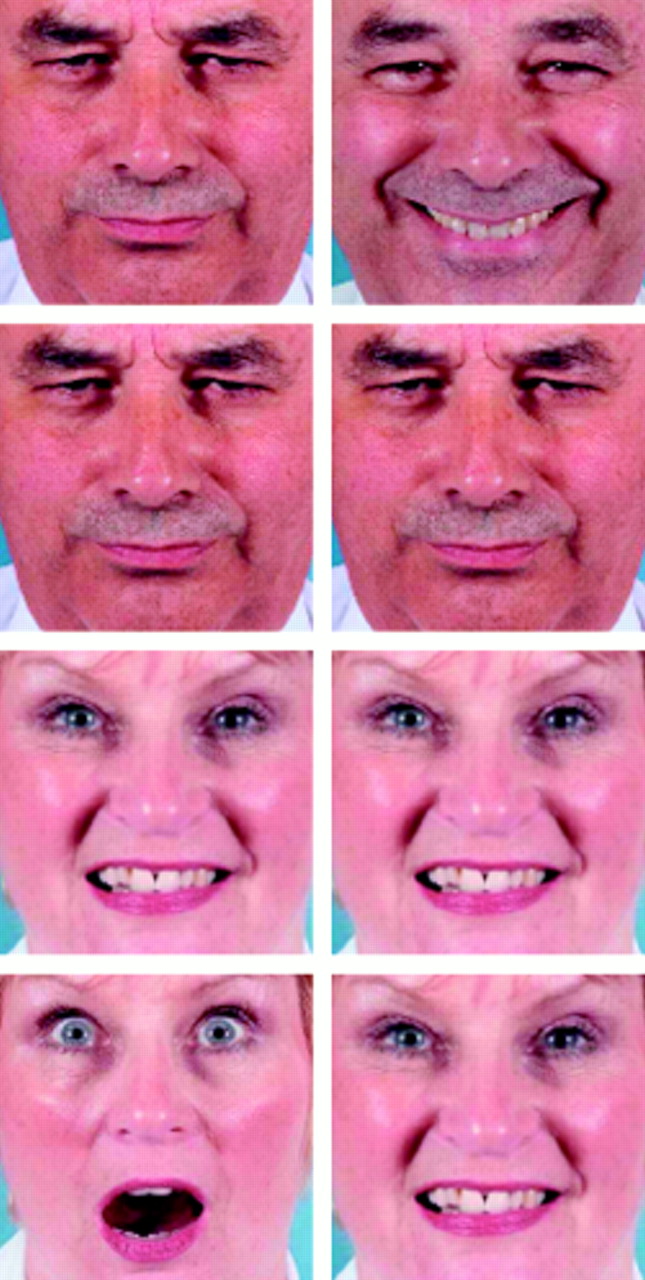
For this task, four images of the same person (300 × 391 pixel image size and 24 bit colour depth) were displayed on the screen at 4 metres from the subject (angular subtense of combined image height = 11°), with each face subtending an angle equivalent to viewing faces at approximately 2 metres. Images for the FED task were displayed in a 2 × 2 arrangement (Fig 1).

Two examples of the 2 × 2 arrangement of images used in the FED task. The total image height subtended 11° (equivalent to viewing the individual faces at ∼2 metres). The task comprised 40 trials with a wide range of signal differences, with the lower of these two examples being representative of a large difference.
Three of the images shown in each presentation were identical while the fourth had a different facial expression, with the location of the “odd one out” being randomised between presentations. Whereas the images in the FFR task comprised a variety of “poses” and expressions, those included in the FED task were photographed specifically for the study and cropped to face only (Fig 1). Care was taken to minimise any difference clues in these displayed images other than facial expression. For FED, the subject’s task was to discriminate which of the four images had a different facial expression. No naming of the expression was required. Following a demonstration trial, 40 presentations (each comprising four images) with a range of facial expressions (“happy,” “sad,” “surprised,” “frowning,” and “neutral”) were displayed, 20 with four images of a male face and 20 with four images of a female face. FED was scored as the percentage of images correctly identified as a proportion of the number of presentations. Each image was displayed for 6 seconds, but there was a variable interval of time between the 40 successive presentations.
Data analysis
Data were analysed using statistica 5.1 software (1998 edition). Data analysis comprised descriptive summary statistics to assess the underlying distributions of the raw data, regression analyses to assess intercorrelations between visual functions and face recognition disability, and comparative tests to evaluate the magnitude of change in task performance with the telescopic device.
RESULTS
Visual functions and perceived disability
The ranges and medians for binocular visual functions (distance visual acuity, continuous text reading acuity, Pelli-Robson CS, and the c-index of colour vision) are shown in Table 1. The mean disability score from the questionnaire was 15 (range 4–23), indicating that while the overall group of subjects perceived difficulty in recognising faces, the variation in self rated disability was considerable. Only one subject reported not having difficulty recognising faces in the street. However, there was a more dichotomous response as to whether subjects felt embarrassed when they failed to recognise someone in the street. Subjects either “agreed strongly” (n = 10, 33%) or “disagreed strongly” (n = 12, 40%) in most instances. A total of 22 of the 30 subjects (73%) indicated that voices helped them to recognise familiar people and 17 subjects (57%) also reported having difficulty in recognising facial expressions, resulting in difficulty following conversations.
Median values and ranges for binocular visual functions (n = 30)
Face recognition tasks
In order to achieve reasonable precision for the estimates of FFR performance, nine subjects who were familiar with ≤10 images (that is, ≤ 50%) for the control task at 0.35 metre were excluded from the subsequent analyses. For the FED task, data from two subjects were excluded, since they failed to complete the series of images presented in the task (one subject being unwilling and one being unable to complete this task). When using an optimal spectacle correction alone (that is, without a magnification device), the median percentage correct recognition was 26.3% (range 0–80%) for FFR and 46.3% (range 0–73%) for FED.
Relation between face recognition and visual functions
There was no correlation between the overall self rated disability and measured performance in FFR (r = 0.13, p = 0.56) and FED (r = 0.05, p = 0.78). Although analysis for individual questionnaire items did show a correlation between item 1 (difficulty recognising familiar faces in the street) and FFR (r = 0.49, p = 0.02), caution is needed in interpreting multiple comparisons, since one might expect a significant association to arise by chance. Items 2–8 did not correlate with measured disability (r <0.3, p>0.22). The correlation between both the FFR and FED tasks and the measures of visual function are shown in Table 2. Figure 2 shows scatter diagrams illustrating the relation between both the FFR and FED performance and distance and near acuity. FFR performance was most closely related to distance acuity (Fig 2A), while FED performance was most closely related to reading acuity (Fig 2D).
Correlation coefficients (Pearson r) between the measures of visual function and the face recognition tasks. p Values are presented in parenthesis
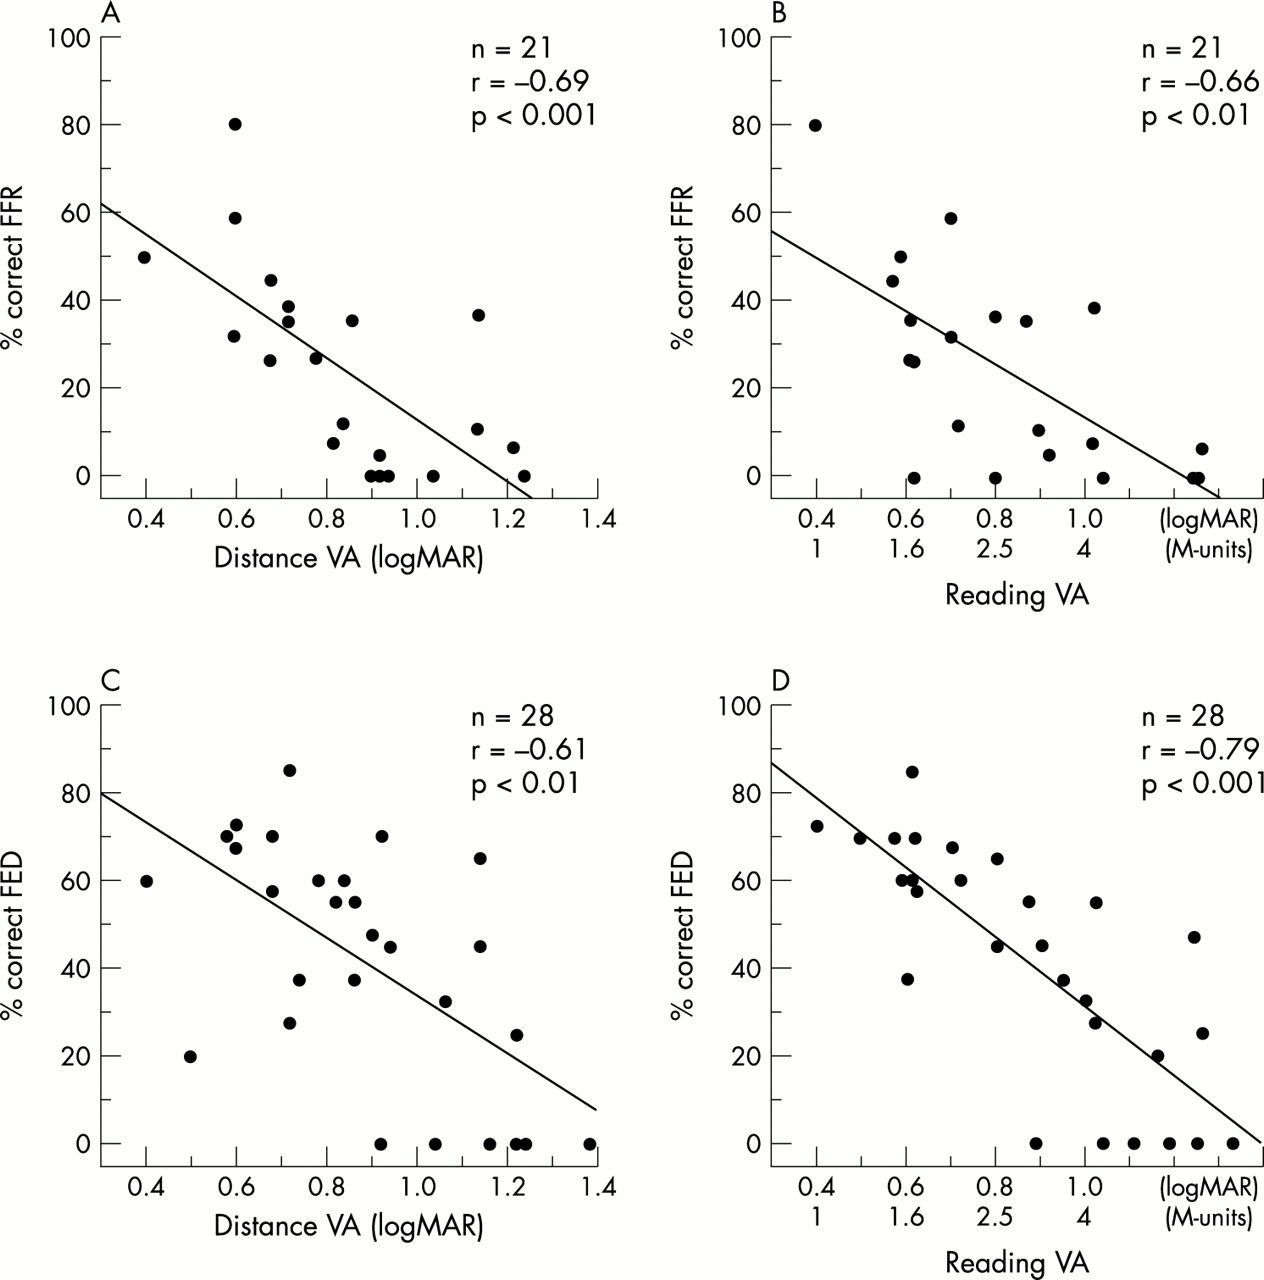
Scatter diagrams showing the relation between (A) distance visual acuity and percentage correct FFR, (B) continuous text reading acuity and % correct FFR, (C) distance visual acuity and percentage correct FED discrimination, and (D) continuous text reading acuity and percentage correct FED discrimination. Pearson’s correlation coefficient is shown in each case. Note the six data points along the abscissa in (C) and (D) (0% FED). These data were derived from subjects in whom application of a strict forced choice method was not feasible.
In multiple regression, distance acuity explained 49% of the total variance and adding other visual function variables (that is, reading acuity, CS, and colour vision) failed to yield a significant increase in the variance explained. Similarly, using the same independent variables for the FED task, continuous text reading acuity explained 63% of the total variance, with no other visual function variable yielding a significant increase in the variance explained.
Visual acuity and face recognition performance with a telescopic device
The medians and ranges of distance logMAR visual acuity, percentage correct FFR and percentage correct FED with both the optimal refractive correction and with the telescopic device are shown in Table 3. The mean improvement in VA was >0.4 logMAR (∼4 lines on the ETDRS chart, Wilcoxon matched pairs test, z = 4.7, p<0.0001). Subjects with better optimal acuity with spectacles obtained less improvement with the telescopic device than those subjects who had poorer spectacle acuity (r = 0.56; p <0.01). A Wilcoxon matched pairs test was used to compare the FFR and FED task performances both with and without the telescopic device. For each task, there was a statistically significant improvement in performance when subjects used the device (for the FFR task, z = 3.48, p <0.001 and for the FED task, z = 2.99, p <0.01).
Medians and ranges of distance visual acuity (logMAR) in the better eye, and percentage correct FFR and FED discrimination with the optimal refractive correction and with the telescopic low vision device. Median gains for FFR and FED are 48% and 50% respectively
Since the potential improvement in face recognition depended on a subject’s performance without telescopic magnification, the “gain” (that is, the ratio of the actual improvement to the maximal possible improvement for that subject) was calculated, as suggested by Peli et al.11 (Gain = CRt − CRr/(100 − CRr), where CR is the percentage correct recognition in the FFR or the FED task with the telescope (t) or the optimal refractive correction (r)). The median gains obtained for the FFR and FED tasks with the telescopic device were 48% and 50% respectively. Figure 3 shows a plot of the gain in FFR and FED against baseline performance without magnification. A minority of subjects had a minimal or even “negative” gain in the face recognition tasks, especially the FED task. Some degree of scanning between the four faces within the displayed area (angular subtense of 11.1°) may have been required on account of field of view of the device itself (∼12.5°). While it might be argued that a single exposure was insufficient for non-telescope users to familiarise themselves with the use of the device, there was no statistically significant difference in gain between the previous telescope users and the non-users for distance acuity, percentage correct FFR, and percentage correct FED (Mann-Whitney U tests, p>0.05). This lack of a statistically significant difference in the improvement obtained with the telescope between the device user and non-user groups cannot be explained by differences in the measured baseline visual functions, since these were not significantly different between groups (p>0.05). However, our power to detect a difference between user and non-user groups is small (on account of the sample size), and it is of interest to note that all three subjects who did not have a positive gain in the FFR task and five of the six subjects that did not have a positive gain in the FED task were naive telescope users.

Gain in percentage correct FFR (A) and percentage correct FED discrimination (B) with the bioptic device plotted against performance with the optimal refractive correction alone for FFR (n = 21) and FED (n = 25). Data points above 0 represent an improvement in performance with magnification whereas those points below 0 represent a decrement in performance. For FED, the results for three subjects with a large negative “gain” (below –60%) are not shown in the diagram.
DISCUSSION
In this study we explored the association between two measures of face recognition performance with both perceived disability in face recognition and clinical measures of visual function. In addition, we quantified the gain in measured performance on face recognition tasks when subjects used a bioptic device. The authors are not aware of research that has attempted to address this latter objective. The former objective has been studied, although our recognition task (FFR) differed, in that we deliberately included non-standardised colour images of different poses and expressions. We were interested in the relations between clinical measures of visual function and a task that more closely resembled the “real world” nature of face recognition. It should be pointed out, however, that our control for unfamiliarity in FFR by using magnified images may not have guaranteed that failed recognition was attributable to unfamiliarity, since it is possible that a subject with very poor CS, for example, might fail to recognise a familiar face. This possibility may have influenced some of our findings—for example, with respect to the benefits of telescopic magnification for FFR.
Our face expression task also differed, in that it required subjects to correctly identify the face with a different facial expression from a sample of four faces from the same individual, thereby avoiding the potential confounding factor of the various expressions being interpreted and named differently by the subjects. It might be argued, however, that a limitation of our approach is that the facial expression itself may not matter. Local contrast differences (for example, around the mouth in Fig 1) could result in a subject being able to discriminate the different image from the distracters, even in the presence of image degradation (albeit these contrast differences have been generated by a changed facial expression). In the interests of having a “real world” FED task, however, we wished to use real images of faces and it was not realistic to produce these images as contrast neutral. We must also acknowledge that a strict forced choice approach for FED was difficult among these subjects. When subjects were reluctant to respond, they were given strong encouragement to guess, but in six cases no response was obtained within the time response window of 6 seconds (see Fig 2C and D).
Perceived and measured disability
To our knowledge, there is no questionnaire specifically targeted to face recognition disability, although some instruments do include items on face recognition, including the Activities of Daily Vision Scale,23 the NEI-VFQ,24 the DLTV,6 and the Melbourne Low Vision ADL index.25 While the individual item relating to “recognising familiar faces in the street” did correlate with measured disability in face recognition, caution is needed when considering multiple comparisons, since such a finding could arise by chance. There was no relation between overall perceived disability and measured disability, despite our inclusion of a sample of subjects with AMD with a wide range of visual impairment. While it might be argued that those subjects with less perceived difficulty masked the correlation for the group as a whole, subgroup analysis (using a cut-off criterion of ≥14 for the summed questionnaire items to reflect greater perceived difficulty) still failed to reveal a significant correlation. Although a larger sample size might have resulted in a statistically significant correlation, the relation between the overall perception of disability and measured disability is probably weak, despite some evidence for a relation between the specific difficulty in recognising familiar faces and measured recognition performance. A note of caution should be raised here, however, in that while we believe the questionnaire items included have face validity, we acknowledge that the reliability and validity of our questionnaire has not been established and that this limitation may have influenced these findings. More formal questionnaire development would be necessary to be able to comment further on the complex relation between subjective and measured disability, although we believe that some discrepancy between perceived and measured disability is not unexpected. For example, while there is good evidence for a correlation between the subjective rating of vision or vision related QoL and specific measures of visual function,4,26,27 some discrepancy might be expected because other variables (including, for example, duration of vision loss, psychosocial status, cognitive status, personality, etc) could influence questionnaire responses. Friedman et al28 have shown that there is a substantial discrepancy between self reported reading difficulty and reading performance in a subset (10%) of the elderly population, a finding that they attribute, at least in part, to underlying expectations and experiences. It is also worth noting that our questionnaire does, at least in part, address issues that are somewhat broader than visual disability alone. For example, the questions relating to “embarrassment” (item 3) and being “bothered” by failure to recognise faces (item 8) ask the subject to place their disability within the context of visual handicap, an approach that may reduce the close association between the questionnaire and measured performance. This suggestion is supported by the individual item analysis, where a correlation was found between item 1 and measured recognition performance.
Relation between visual function and measured disability
In the present study, visual acuity was related most closely to face recognition disability in AMD. While it might be speculated that the closer association of distance acuity with the FFR task, and reading acuity with the FED task, relates to a requirement for greater integration of spatial information for both reading and our expression discrimination task (in comparison with a distance acuity task and our recognition task), this is not supported by other published data. While Bullimore et al5 also report a closer association of reading acuity with expression identification, their task required the naming of an expression from a series of single images rather than identification of the different facial expressions from the scanning of four images. In addition, their study and a more recent study by Haymes et al29 also showed a closer association between a face recognition task and reading rather than distance acuity.
While several studies report the importance of visual acuity in predicting different visual disabilities,6,29–31 other studies highlight the fact that sometimes this association is relatively weak—for example, in relation to ability to perform tasks,10 see large low contrast objects,32 or perform activities requiring mobility.33–35 Recently, Rubin et al36 have shown that visual acuity alone is not the only measurement associated with subjective disability to perform activities of daily living, and that contrast and glare sensitivity, stereoacuity, and visual fields are also independent risk factors for visual disability in an older population. While we did not measure all possible visual functions (see below), our findings suggest that colour vision does not closely relate to face recognition performance. While colour has been shown to provide important information for recognising certain objects such as food items,37 chromatic variation between different faces, especially between faces within the same race, is limited. Arguably, however, colour may well prove to be more useful in a real life task, where recognition of clothing is expected to contribute to the recognition of individuals, for example, or where facial colour itself might be a cue to a person’s health state.
In the present study, binocular CS was correlated with FED but was not correlated with FFR. The finding may relate in part to the difference in test design. While the former was a discrimination task, the FFR was a recognition task. Differing amounts of contrast difference between the images may be useful in distinguishing the different facial features across the 4 images (for example, the change in contrast between a face with open versus closed mouth). CS has been shown to be a good predictor for a variety of functional tasks.9,32–35,38 However, our results suggest that CS is less closely related to face recognition ability than visual acuity, and furthermore, once the results of visual acuity are taken into account, CS does not provide additional information. It might be argued that because face recognition is more closely correlated with visual acuity than with CS, magnification of the retinal image might be a more effective method for helping patients with AMD to recognise faces than contrast enhancement techniques. While there are studies suggesting that image enhancement improves face recognition in patients with low vision,11,39 this approach is not widely used. When using a telescopic low vision device, the visual acuity of the subject is being improved without an associated improvement in CS. Our finding of a significant improvement in face recognition performance with a bioptic device supports the view that acuity has an important role in face recognition.
An important limitation of this study is the omission of a measure of central visual field status. These measures are difficult to obtain with precision in subjects with AMD, and the possible use of a non-foveal retinal locus complicates the interpretation of these data. Thus, we cannot comment on the possibility that central field status would be more or less important in predicting face recognition disability than acuity or CS. However, studies that have included a measure of central fields (albeit not specific to subjects with AMD) have tended to show a weaker association with this parameter and performance on activities of daily living than measures of acuity or CS.29,40,41
Face recognition with telescopic magnification
As might be expected, 28 out of 30 subjects’ visual acuity improved with telescopic magnification, with a mean improvement of ∼4 lines on the logMAR chart (albeit the magnitude of improvement at ∼2.4× change in letter size is smaller than might be anticipated from 4× magnification). Furthermore, there were significant gains in performance for FFR (86% of subjects improved, median gain = 48%) and FED (79% of subjects improved, median gain = 50%).
Some subjects may not have achieved potential improvements in visual acuity or FFR/FED performance with the telescopic device. Firstly, owing to the motion parallax of a telescope, even small device movements are magnified, resulting in large image movements that can be especially disturbing when looking at smaller letter sizes. Secondly, unfamiliarity with the system may have influenced the findings. Some subjects found the device difficult to handle and struggled when looking through the eyepiece, or when trying to locate the desired image because of the magnification. While the difficulty that some subjects may have had in seeing images within the FED task might have been overcome by increasing the display time, we considered it important to try to reflect the reaction times that might be required in the more dynamic “real world” context. Finally, as previously pointed out, the restricted field of view of the telescope necessitated some scanning of the image in the FED task, since the visual angle subtended by the four faces within each presentation was similar to the field of view of the telescope (∼12.5°).
In conclusion, face recognition abilities are impaired in AMD, and while this disability is not measured clinically, visual acuity is correlated closely with measured disability. However, we were not able to show an association between perceived disability in face recognition and measured task performance in face recognition, suggesting that this relation is complex. Further work is needed to tease apart the factors that contribute to disability and handicap for face recognition. A bioptic device is able to decrease significantly the measured disability in face recognition in a research setting. While the merits of the bioptic device included in this study compared with those of other magnification systems cannot be commented upon, the combination of bioptic design and autofocus capability appear to be suited to the mid-range face recognition difficulties patients are often concerned about. There is evidence that previous full field telescope users are able to make increased use of a telescopic device when introduced to this system42 and that there is both patient and clinician preference for these devices in comparison with conventional Keplerian systems.14 However, the long term effectiveness of these devices in the rehabilitation of people with visual impairment requires further evaluation through prospective randomised clinical trials.
REFERENCES
Footnotes
-
Presented as a poster at the ARVO annual meeting, Fort Lauderdale, Florida, May 2001.