Article Text

Abstract
Aims To develop and validate a short questionnaire to assess self-reported visual ability in children and young people with a visual impairment.
Methods A list of 121 items was generated from 13 focus groups with children and young people with and without a visual impairment. A long 89-item questionnaire was piloted with 45 visually impaired children and young people using face-to-face interviews. Rasch analysis was used to analyse the response category function and to facilitate item removal ensuring a valid unidimensional scale. The validity and reliability of the short questionnaire were assessed on a group of 109 visually impaired children (58.7% boys; median age 13 years) using Rasch analysis and intraclass correlation coefficient (ICC).
Results The final 25-item questionnaire has good validity and reliability as demonstrated by a person separation index of 2.28 and reliability coefficient of 0.84. The items are well targeted to the subjects with a mean difference of −0.40 logit between item and person means, and an ICC of 0.89 demonstrates good temporal stability.
Conclusion The Cardiff Visual Ability Questionnaire for Children (CVAQC) is a short, psychometrically robust and a self-reported instrument that works to form a unidimensional scale for the assessment of the visual ability in children and young people with a visual impairment.
- Child health (paediatrics)
- children and young people
- intraclass correlation coefficient
- low vision aid, questionnaire
- Rasch analysis
- visual impairment
Statistics from Altmetric.com
- Child health (paediatrics)
- children and young people
- intraclass correlation coefficient
- low vision aid, questionnaire
- Rasch analysis
- visual impairment
Introduction
Visual impairment early in life has profound implications in terms of reduced educational, recreational and social experience in children.1 2 Even though childhood visual impairment is less common than in adults, the associated life-long burden of disability is more significant in terms of number of ‘blind years’ experienced by children in their life time.3 The extent to which visual impairment limits a child's ability varies. So, it is important to measure the individual's perception of their visual ability in order to understand what effect, if any, interventions have on a child's functioning. In terms of low-vision rehabilitation, as in adults, there is a need to promote cost effective paediatric low-vision rehabilitation service delivery.4 Therefore, an assessment tool is needed to capture the individual self-reported difficulty in performing the activities that drive children's daily living and the change in difficulty performing these activities after rehabilitation.4 5
There are three questionnaires described in the literature that are aimed at determining the impact of visual impairment in children. One of these is only for children ≤7 years and is aimed at determining parent's perceptions of treatment for the impairing conditions (Children's Visual Function Questionnaire (CVFQ)).6 One was developed with children in India and so is most suited to measuring the activities of children in developing countries (LV Prasad-Functional Vision Questionnaire (LVP-FVQ)).7 The psychometric properties of the third, which uses input from specialist instructors (such as teachers, occupational therapists, and orientation and mobility instructors), parents and children, have not been described (Impact of Visual Impairment on Children (IVI-C)).8 Therefore, as yet there is not a validated tool available to assess the difficulty in performing the activities in children's daily lives in developed countries.
The measurement of quality of life and visual ability is considered to be an essential aspect to measure treatment and rehabilitative outcomes in eye care.4 7 However in the past, carers and/or professionals have been asked to answer on children's behalf, that is, by proxy.6 9 It is well documented in both the adult and paediatric literature that information provided by proxy-respondents is not equivalent to that reported by the patient.9 10 There are circumstances when children are too young, too cognitively impaired, too ill or fatigued to complete a paediatric questionnaire, and reliable and valid parent proxy-reported instruments are appropriate in such cases.9 The proxy method may also be useful for people with multiple disabilities. Ideally, information on children's opinions, attitudes and behaviour should be collected directly from children, if they are cognitively able to answer the questions.11 Studies have shown that paediatric questionnaires work well if vague and ambiguous wording is avoided and the number of response options is limited to decrease the burden on the child's visual or auditory memory.12 Children as young as 5 years old can reliably complete a questionnaire when given the opportunity to do so with an age-appropriate instrument.13
There is need to determine: (1) the participation of children and young people with a visual impairment in society; and (2) the change in ability outcomes following interventions. The current project focussed on the second, that is, to design a tool that would enable change in ability to carry out activities that are important to them to be measured.
The aim of this study was to develop a short, self-reported questionnaire capable of measuring the visual ability of children and young people in developed countries to take part in activities that matter. This questionnaire is named the Cardiff Visual Ability Questionnaire for Children (CVAQC).
Methods
Item selection
To ensure content validity, 121 items were initially identified on the basis of 13 focus group discussions (the details of the focus group study will be published separately). Seven focus groups included visually impaired (VI) and six groups included normally sighted (NS) children and young people. All participants were aged between 5 and 18 years, and there were four to eight individuals in each group. The inclusion criteria were: children who can access print, able to converse in English, and with no other physical, sensory or severe cognitive impairment. The question ‘route’ had open-ended questions on the activities children and young people like doing, are interested in or struggle with at home, in school, in the playground, with friends and socially.
Subsequently, the items generated were reviewed by the authors to look for repeated ideas that represented item redundancy. Thirty-two redundant items were removed on this basis and so the 121 items were reduced to 89 items. The 89 items were then read to eight normally sighted children (aged 5–11 years) to identify item ambiguity and preferences for positive or negative valencing of items. All children preferred negatively valenced items, that is, ‘how difficult’ rather than ‘how easy’. Items that the children identified as ambiguous or difficult to understand were rephrased. The 89-item questionnaire had six response categories (‘Very easy’, ‘Easy’, ‘A little bit difficult’, ‘Difficult’, ‘Very difficult’ and ‘Impossible or can't do because of my eye sight’) and a seventh response (‘Do not do for other reason/s’), which was scored as missing data.
Piloting the 89-item questionnaire
The questionnaire was piloted on a group of 49 VI children. The children were identified and recruited from primary (5–11 years) and comprehensive (12–18 years) schools, a special school for VI young people, Gwent Visual Impairment Service, a football team for VI children and young people, and Gwent Actionnaires (a community-based organisation for sporting and recreational opportunities for VI children and young people). The Qualified Teachers for the Visually Impaired (QTVI), the head of Gwent Visual Impairment Service, the head of Gwent Actionnaires and the head coach of the football team were involved in recruiting and obtaining written consent from all the children and their legal guardians for participants <16 years. Inclusion criteria were the same as that of the focus groups study. Exclusion criteria were severe VI (preventing access to print) and inability to communicate verbally.
All the participants were given a matching card with the response categories to help them remember the response options. A different matching card with smiley faces representing the six category options was also provided to those who were either young or cognitively less able. Each interview was completed within 20 min and question ordering was varied to control for a fatigue effect. Habitual binocular visual acuity and contrast sensitivity were measured on all participants using a logarithm of the minimum angle of resolution (logMAR) letter chart and Pelli–Robson contrast sensitivity chart, respectively. A letter-matching card was used for those children who could not read.
Rasch analysis was undertaken according to the Andrich rating scale model using Winsteps version 3.85.1.14 First, Rasch analysis was used to identify the optimum number of response categories that participants could discriminate reliably between. Second, Rasch analysis fit statistics were used to identify any items that did not contribute to the underlying unidimensional scale and therefore should be removed, that is, items which do not contribute to the scale.15 This process reduced six response categories to four and 89 items to 25.
Assessment of the validity and the reliability of the 25-item CVAQC
The 25-item CVAQC was again administered in face-to-face interviews to a separate group of visually impaired children and young people aged 5–18 years. Once again, the participants were recruited by QTVIs, the head of Gwent Visual Impairment Service, the head of special school for VI young people and the head of Gwent Actionnaires. Inclusion and exclusion criteria were the same as in the focus groups study and the pilot study. Informed written consent was obtained from parents and the participants. The interviews were carried out on an appointment basis in the participants' schools. Habitual binocular visual acuity and contrast sensitivity were also measured.
The reliability and validity of the 25-item CVAQC was measured using person and item reliability estimates. The stability of the measure was evaluated by assessing its test–retest reliability. This was measured using a group of 39 participants (test–retest time, 2–3 weeks), with the intraclass correlation (ICC).16 These data were also used to confirm the validity of collapsing categories.
The differential item functioning (DIF) shows whether the items have significantly different meaning for the different groups within the study population, despite possessing equal level of underlying trait (ie, visual ability) being measured.17 DIF was assessed for primary school (<11 years) children versus secondary school (>12 years) young people. DIF is small or absent if the difference in item measure is <0.50 logit, minimal if 0.50–1.00 logit and notable if >1.00 logit.18
Results
The 89-item questionnaire
The 89-item questionnaire was administered in face-to-face interviews to 49 VI children and young people. Four questionnaires were excluded from analysis because more than 33% of the questions were incomplete and were considered unreliable.19 Therefore, 45 questionnaires (67% boys; median age 13 years, range 5–18 years) were included in the final analysis. Habitual binocular visual acuity ranged from logMAR 0.30 (6/12) to 1.64 (6/240) and logarithmic contrast sensitivity from 0.05 to 1.85.
Response scale analysis
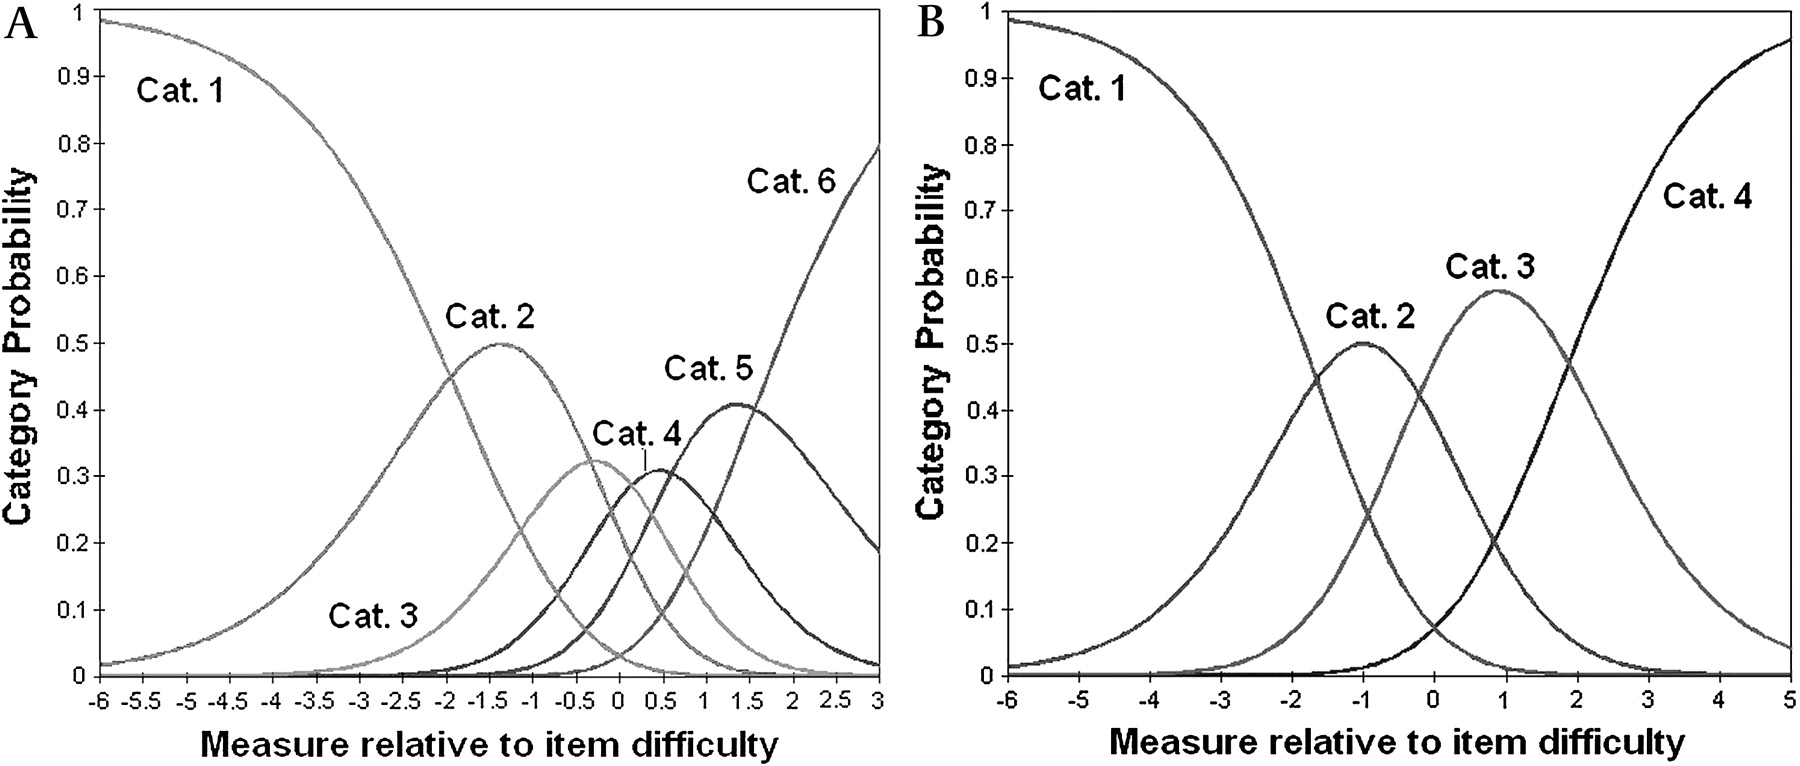
Category diagnostic statistics identified that all the six response categories were ordered, indicating that each category had a distinct probability of being selected (figure 1A). However, during the interview, it was evident that participants struggled to remember all the six categories. Furthermore, the end category ‘impossible’ was only selected in 2% of total answers. An underutilised category compromises the precision of threshold estimates; therefore category 6 was merged with category 5 (very difficult).20

(A) Category probability curves for the six response categories. Cat. 1, Very easy, Cat. 2, Easy; Cat. 3, A little bit difficult; Cat. 4, Difficult; Cat. 5, Very difficult; Cat. 6, Impossible. (B) Category probability curves showing the operation of the four response option (after category 6 was merged with category 5, and category 3 with category 4). Cat. 1, Very easy; Cat. 2, Easy; Cat. 3, Difficult; and Cat. 4, Very difficult.
Category 3 (a little bit difficult) and 4 (difficult) were separated by less than half the recommended normal separation value of 1.4 logit.17 In terms of average patient measures these two categories occupy a limited range of the scale for maximum probability of selection.21 Therefore, categories 3 and 4 were also merged together. The combined four response category option improved structure calibration and category utilisation (figure 1B).20 The new four response categories were worded as ‘Very easy’, ‘Easy’, ‘Difficult’ and ‘Very difficult’.
Person and item estimates
In figure 2 the spread of each item calibration is visualised compared with the range of person ability estimates. Winsteps provides statistics to describe the precision of these estimates. The root mean square error (RMSE) over all the items is 0.27. The high item-separation reliability coefficient 3.13 of the items indicates the stability of the item estimates. Winsteps also provides a statistic called the person separation reliability coefficient, which describes the reliability of person ordering and is similar to the conventional Cronbach alpha coefficient. It is 0.94 for this sample. The person separation ratio (signal to noise ratio) was 3.90, which is greater than the recommended value of 2.15

Person visual ability and item difficulty map or scale for the 89-item and four categories Cardiff Visual Ability Questionnaire for Children (CVAQC). The subjects are represented by ‘x’ on left of the scale and items (questions) are represented by Q followed by the item number on the right of the scale. The more difficult items are placed near the bottom of the scale. The more visually able subjects are near the bottom of the scale and less visually able are at the top. M, mean; S, 1 standard deviation from the mean; T, 2 standard deviations from the mean. The M, S and T are shown for the children and the items, that is, on either side of the dashed line.
Item reduction
To improve measurement validity, Rasch analysis was used to identify items that misfitted the Rasch model. Removal of items was principally driven by fit statistics (infit and outfit), which estimates the extent to which responses show adherence and compatibility with the Rasch model expectations.22 Items fitting perfectly to the unidimensional scale have an expected infit or outfit statistic of 1 and their value can range from zero to infinity.23 24 The standard cut-off range is from 0.7 to 1.3.14 Items were considered for removal from the scale which fulfilled the highest number of candidate criteria in order of priority as proposed by Pesudovs (2003)15 19 24 (1: infit mean square outside 0.80–1.20; 2: outfit mean square outside 0.70–1.30; 3: item with mean furthest from the subject mean; 4: high proportion of missing data (> 50%); 5: ceiling effect (>50% in end category); and 6: skew and kurtosis outside –2.00–+2.00).
Skew (symmetry of a distribution) and kurtosis (peakedness or flatness of a distribution) values indicate the measurement of normality of a data distribution. If the skew and kurtosis values of items are outside the normal range then those items do not contribute to the unidimentionality of the scale. Hence, the items should be removed.
Items were removed until the scale provided good fit values, with no significant missing data or ceiling effect and good person separation (>2.00). This procedure reduced the scale to 37 items. During the interview, it was observed that many of the participants either lost interest or got bored after 24 or 25 questions. Therefore, the number of items was reduced to 24 items by further modifying Pesudovs' criteria. The three added criteria were: 1: missing data (>25%), 2: high item redundancy, that is, three or more items at the same level on persons items map which signifies items having the same level of difficulty and measure; and 3: redundant items furthest from the subject mean.
To ascertain that the final instrument covered all the important areas guided by the focus groups, the authors reviewed the items and focus group results again. As a result, item 3 ‘chatting with your friends’, which was removed before due to high kurtosis value (>2.00) was brought back into the scale. The remaining 25-item instrument had good measurement precision denoted by high person- and item-separation reliability coefficients (0.82 and 0.94, respectively) and the real person and item separation (2.10 and 4.11, respectively). The 25 items were regrouped according to the face validity into seven subscales (identified in table 1).
Descriptive statistics, Rasch fit statistics and rating of difficulty for the 25-item, four-response category questionnaire (very easy, easy, difficult and very difficult)
Assessment of the validity and the reliability of the 25-item CVAQC
The shortened CVAQC was completed by an additional 110 VI children and young people (58.2% boys; median age 13 years, range 5–18 years). Participants habitual binocular visual acuity ranged from logMAR 0.1 (6/7.5) to 1.90 (6/480) and log contrast sensitivity from 0.05 to 2.00. The average length of time for each appointment was 10 min. This included collecting personal details, measuring visual acuity and contrast sensitivity, reading the instructions and asking the 25 questions.
Questionnaires are invalidated if they had >33% missing data. This applied to only one subject, who was aged 5 years. The subject was excluded from the analysis leaving 109 questionnaires.
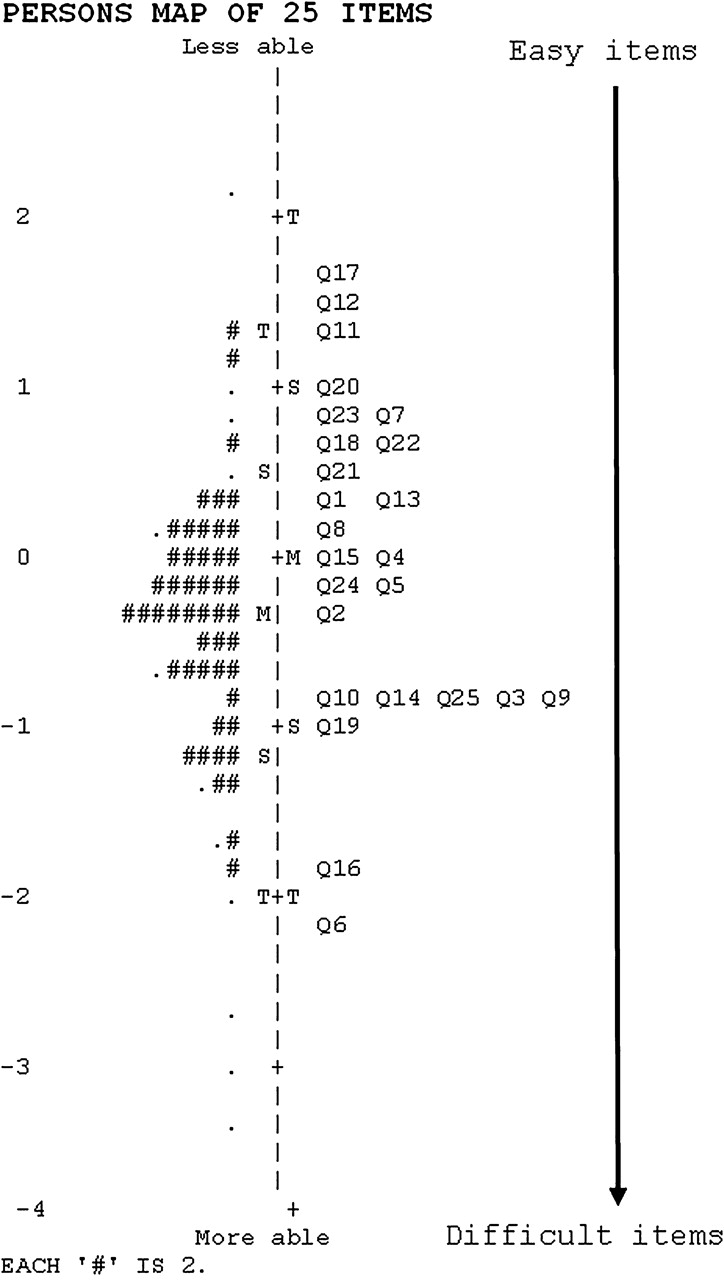
Rasch analysis identified that all 25 items had good fit statistics denoted by infit and outfit values <1.5 as recommended by Linacre,14 and skew and kurtosis values within normal limits (table 1). The items were well targeted to the subjects with a mean difference of −0.40 logits (figure 3). Items located at the top of the map, for example, Q17 ‘chatting with your friends’, discriminate between those people who are less able. Conversely, items located at the bottom of the map, for example, Q16 ‘reading a bus or train time table on a screen at a station’, are high-level ability discriminating items (figure 3).

Person item map for 25-item and four categories Cardiff Visual Ability Questionnaire for Children (CVAQC). Items are denoted by Q followed by item number shown on right. Two people are represented by ‘#’ on left of the dashed line. The sample population shows excellent targeting of items to subjects, that is, the subjects and the questions overlap well on the scale. M, mean; S, 1 standard deviation from the mean; T, 2 standard deviations from the mean. The M, S and T are shown for the children and the items, that is, on either side of the dashed line.
The shorter instrument also had high measurement precision (person separation 2.28, reliability 0.84; item separation 6.20, reliability 0.97). The results also confirmed ordered structure threshold calibration and good utilisation of the four categories. In other words, the four category solution allows reliable discrimination of visual ability in children.
Test–retest was good when tested on 39 participants (61.5% male, median age 12 years): ICC of 0.89 for persons (95% CI 0.80 to 0.94) and 0.94 for items (95% CI 0.87 to 0.97). None of the 25 items showed notable DIF by age. Four items showed minimal DIF by age: ‘item 10, reading the board’ (0.92); ‘item 12, watching film’ (0.59); ‘item 21, playing computer games’ (0.54); and ‘Q25 playing ball games’ (0.60). Reading the board (item 10) and playing ball games (item 25) were rated difficult by older participants (>12 years) whereas watching films (item 12) and playing computer games (item 21) were rated difficult by younger participants (<11 years) relative to other tasks.
Discussion
The 25-item CVAQC is a valid and a reliable instrument that was developed using Rasch analysis to ensure good content validity, construct validity and temporal stability. The item selection was based on the information provided by the focus groups with children and young people. This means that the instrument is highly relevant to this population focussing on the most important activities both in and out of school.
Offering the clearest type of response options produces the best quality in questionnaire research with children. Hence, category collapsing was carried out in such a way that the resulting scale becomes ‘sensible’.17 25 The four response categories are likely to be a good compromise between stability and response burden. The re-analysis of the data with four response options increased the person and item reliability and the targeting of 89 items to subjects. Further testing the four response category options with an additional 109 subjects and 39 test–retest subjects showed good utilisation of all the categories. It confirms that four response category options to measure visual ability in children are consistent and optimum. The response scale collapsing and item reduction also brought the two means close enough to signify improved item targeting.
The initial 89-item version was too long, signifying a huge respondent burden. Items were removed using standard criteria primarily based on infit and outfit Rasch statistics proposed by Pesudovs in 2003.15 19 22 24 Unlike Pesudovs' criteria of 50% missing data, items with more than 25% missing data and high redundancy were also removed to reach the final 25-item questionnaire. It is not necessary to delete all misfitting items or items not satisfying the Pesudovs' criteria but reducing the number while retaining good measurement properties is key in questionnaire development.22 In instrument development, the minimum number of items needed is used to measure a domain, while maintaining acceptable reliability and separation ratio to ensure test quality.24 Therefore the removal of items was stopped when the separation ratio was nearing an unacceptable value (ie, <2.00).
The 25-item instrument administered to 109 subjects showed that items 3, 9, 10, 14 and 25 (figure 3) measured the same level of visual ability. Few of these items could be removed to shorten the instrument and decrease the administration time and response burden. However, when the 25-item instrument can be administered in a reasonable time period valuable information would be lost if significant items were eliminated.4
The parent proxy report, such as CVFQ, which was designed for use with children up to 7 years old, can be useful when children are unable or unwilling to provide self-report (table 2). However, CVFQ was developed to assess competence, personality, family impact and treatment difficulty imposed by specific eye diseases rather than an overall visual ability measurement.26 The CVAQC on the other hand, was designed to examine visual ability in terms of the children's perceived ability to perform vision specific tasks, such as using mobile phones and reading menus. It is suitable for the assessment of interventions such as the provision of low vision aids. The two types of instrument may be complementary, each appropriate for a particular purpose.
Comparing the features of the Cardiff Visual Ability Questionnaire for Children (CVAQC) with the other three questionnaires
The LVP-FVQ is aimed at assessing general visual functioning with items such as walking home at night, locating a ball and threading a needle. It was developed with children in India and hence will be the instrument for use with children in developing countries (table 2). The CVAQC, on the other hand, has robust psychometric properties compared with LVP-FVQ. The good separation indices of the CVAQC make it more discriminating than LVP-FVQ. Similarly, good fit statistics of all the 25 items of CVAQC indicate that it had less noise while measuring visual ability. In addition, the CVAQC measures visual ability in terms of activities important to the children. The LVP-FVQ, while appropriate as a measure of functional vision in the developing world may be less applicable to children in developed countries such as the UK.
All the participants in the focus groups and the pilot study were ‘white British’. Two of 110 pupils in the validity and reliability study were from ethnic minority groups, Asian Pakistani and Black African. The small number of children from ethnic minority groups in this study reflects the low prevalence of ethnic minority groups in Wales (2.1% of total population in Wales are non-white).27 We do not know the socioeconomic background of the participants, but all the participants were studying in state-funded primary and comprehensive schools; all the children with a VI in each school, Visual Impairment Service, football team for visually impaired children and Gwent Actionnaires were recruited and none declined. There were three children with multiple disabilities (two with cerebral palsy and one with Asperger’s syndrome) in the pilot study. In the validation and reliability study, four children had multiple disabilities (one with Down’s syndrome, two with Say–Field–Coldwell syndrome and one with Stickler syndrome). There was no difficulty administering the questionnaire to any participants as they were all able to communicate verbally in English.
Every effort was made to include younger children throughout the study, for example separate focus groups were conducted with younger children (5–7 years old) during the development of the questionnaire. There was not any concern about the missing data across the study population (ie, only those with low missing data <25% were included). There was no evidence of notable differential item functioning between primary and secondary school participants. However, the sample size for younger children (<7 years) was too small to separately assess DIF, reliability and validity of the tool in this age group. This is an area that needs further investigation.
In conclusion, the 25-item CVAQC is a reliable and a valid measure of visual ability in children and young people with a visual impairment. Because it uses items representing activities important to children across the age range, it may prove useful to those wishing to characterise the nature and degree of the difficulties that children and young people with a VI experience in everyday life.
Acknowledgments
The authors would like to thank all the participating children and young people and Mr Nathan Davies for his contribution in conducting the focus group study. We would also like to acknowledge Gwent Actionnaires, Gwent Visual Impairment Service, the Royal National College for the Blind and all the qualified teachers for visually impaired children in Wales. This project was funded by the Welsh Assembly Government, UK.
References
Footnotes
Competing interests None.
Patient consent Obtained.
Ethics approval All the procedures adhered to the tenets of the Declaration of Helsinki. Ethics approval was obtained separately for the focus groups, pilot and the main study for validity assessment from the School Human Research Ethical Committee at Cardiff University.
Provenance and peer review Not commissioned; externally peer reviewed.
Linked Articles
- At a glance