Article Text

Abstract
Background and purpose A recent expansion of the neurointerventional workforce in the USA could lead to a trend toward cerebral aneurysms being increasingly treated at low volume centers. Such a trend could have a negative impact on patient care as higher volume centers are known to have better outcomes.
Methods Using the Nationwide Inpatient Sample, we evaluated trends in aneurysm treatment in the USA from 2001 to 2010. Annual volumes of both ruptured and unruptured aneurysms were counted, as well as annual percentages of cases treated at high volume centers (≥50 aneurysms/year clipped or coiled).
Results The number of ruptured aneurysms treated per year has fluctuated between 9000 and 12 000 from 2003 to 2010. In 2001–2002, 27.4% of intracranial aneurysm patients were treated with clipping or coiling at high volume centers, with a peak of 70.1% in 2007–2008. This proportion dropped to 61.8% in 2009–2010. The proportion of patients clipped at high volume centers was 23.3% in 2001–2002 and peaked at 65.0% in 2007–2008. In 2009–2010, the proportion dropped to 58.6%. For coiling patients, 46.4% were treated at high volume centers in 2001–2002, with a peak of 70.1% in 2007–2008, and a drop to 61.8% in 2009–2010.
Conclusion A trend toward less cerebral aneurysms being treated in high volume centers in 2009 and 2010 is worrisome because high volume centers are known to tend to have better outcomes. This trend is likely due to recent expansion of the neurointerventional workforce.
- Subarachnoid
- Intervention
- Coil
- Aneurysm
Statistics from Altmetric.com
Introduction
A trend toward increasing treatment of ruptured aneurysms at high volume centers was recently reported for the period 2001–2008.1 Such a trend has implications for patient safety because multiple studies have established that outcomes for the treatment of both ruptured2–6 and unruptured2 ,5–10 aneurysms are better at centers that treat a higher volume of these patients. A recent expansion of the neurointerventional workforce in the USA11 ,12could lead to a reversal of that trend as patients are spread among an increasing volume of practitioners. We analyzed data from the Nationwide Inpatient Sample (NIS) to evaluate the recent trends in treatment of both ruptured and unruptured cerebral aneurysms in the USA.
Methods
Patients
We purchased the NIS hospital discharge database for 2001–2010 from the Health Care Utilization Project of the Agency for Healthcare Research and Quality, Rockville, Maryland. The NIS is a hospital discharge database that represents 20% of all inpatient admissions to non-federal hospitals in the USA.
The patients included in this study were all those who had a diagnosis of unruptured aneurysm (ICD-9-CM code 437.3) or subarachnoid hemorrhage (SAH) (ICD-9-CM code 430), and an ICD-9-CM procedural code of ‘clipping of aneurysm’ (ICD-9-CM code 39.51) or of ‘coiling of aneurysm’, which included ‘other repair of aneurysm’ (ICD-9-CM code 39.52), ‘endovascular repair or occlusion of head and neck vessel’ (ICD-9-CM code 39.72), and ‘other endovascular repair of aneurysm of other vessels’ (ICD-9-CM code 39.79).
Stratification of hospital volume
Hospital codes were provided and therefore we were able to determine the number of aneurysms (ruptured and unruptured) treated at each institution in a given year. We stratified hospital volume on the basis of the total number of aneurysms treated with clipping or coiling per year at each center. Hospitals treating ≥50 aneurysms per year were considered ‘high volume centers’ and hospitals treating <50 aneurysms per year were considered low volume centers.
Outcomes
We assessed the following outcomes: (1) number of SAH patients treated each year from 2001 to 2010 by treatment modality, (2) number of patients with unruptured aneurysms treated each year from 2001 to 2010 by treatment modality, (3) trends in the proportion of SAH patients treated at high volume centers from 2001 to 2010, (4) trends in the proportion of patients with unruptured aneurysms treated at high volume centers from 2001 to 2010, and (5) percentage of aneurysm treatment centers in the NIS that treated <50 intracranial aneurysms per year from 2001 to 2010. All data analysis was performed using the SAS based statistical software package JMP V.9.0 (http://www.jmp.com).
Results
Between 2001 and 2010, 84 434 patients were treated for unruptured aneurysms and 100 606 for ruptured aneurysms (total 185 040 patients); 46 072 patients with unruptured aneurysms (54.5%) were treated with coiling and 38 362 (45.4%) were treated with clipping. A total of 43 435 (43.2%) SAH patients were treated with coiling and 57 171 (56.8%) were treated with clipping.
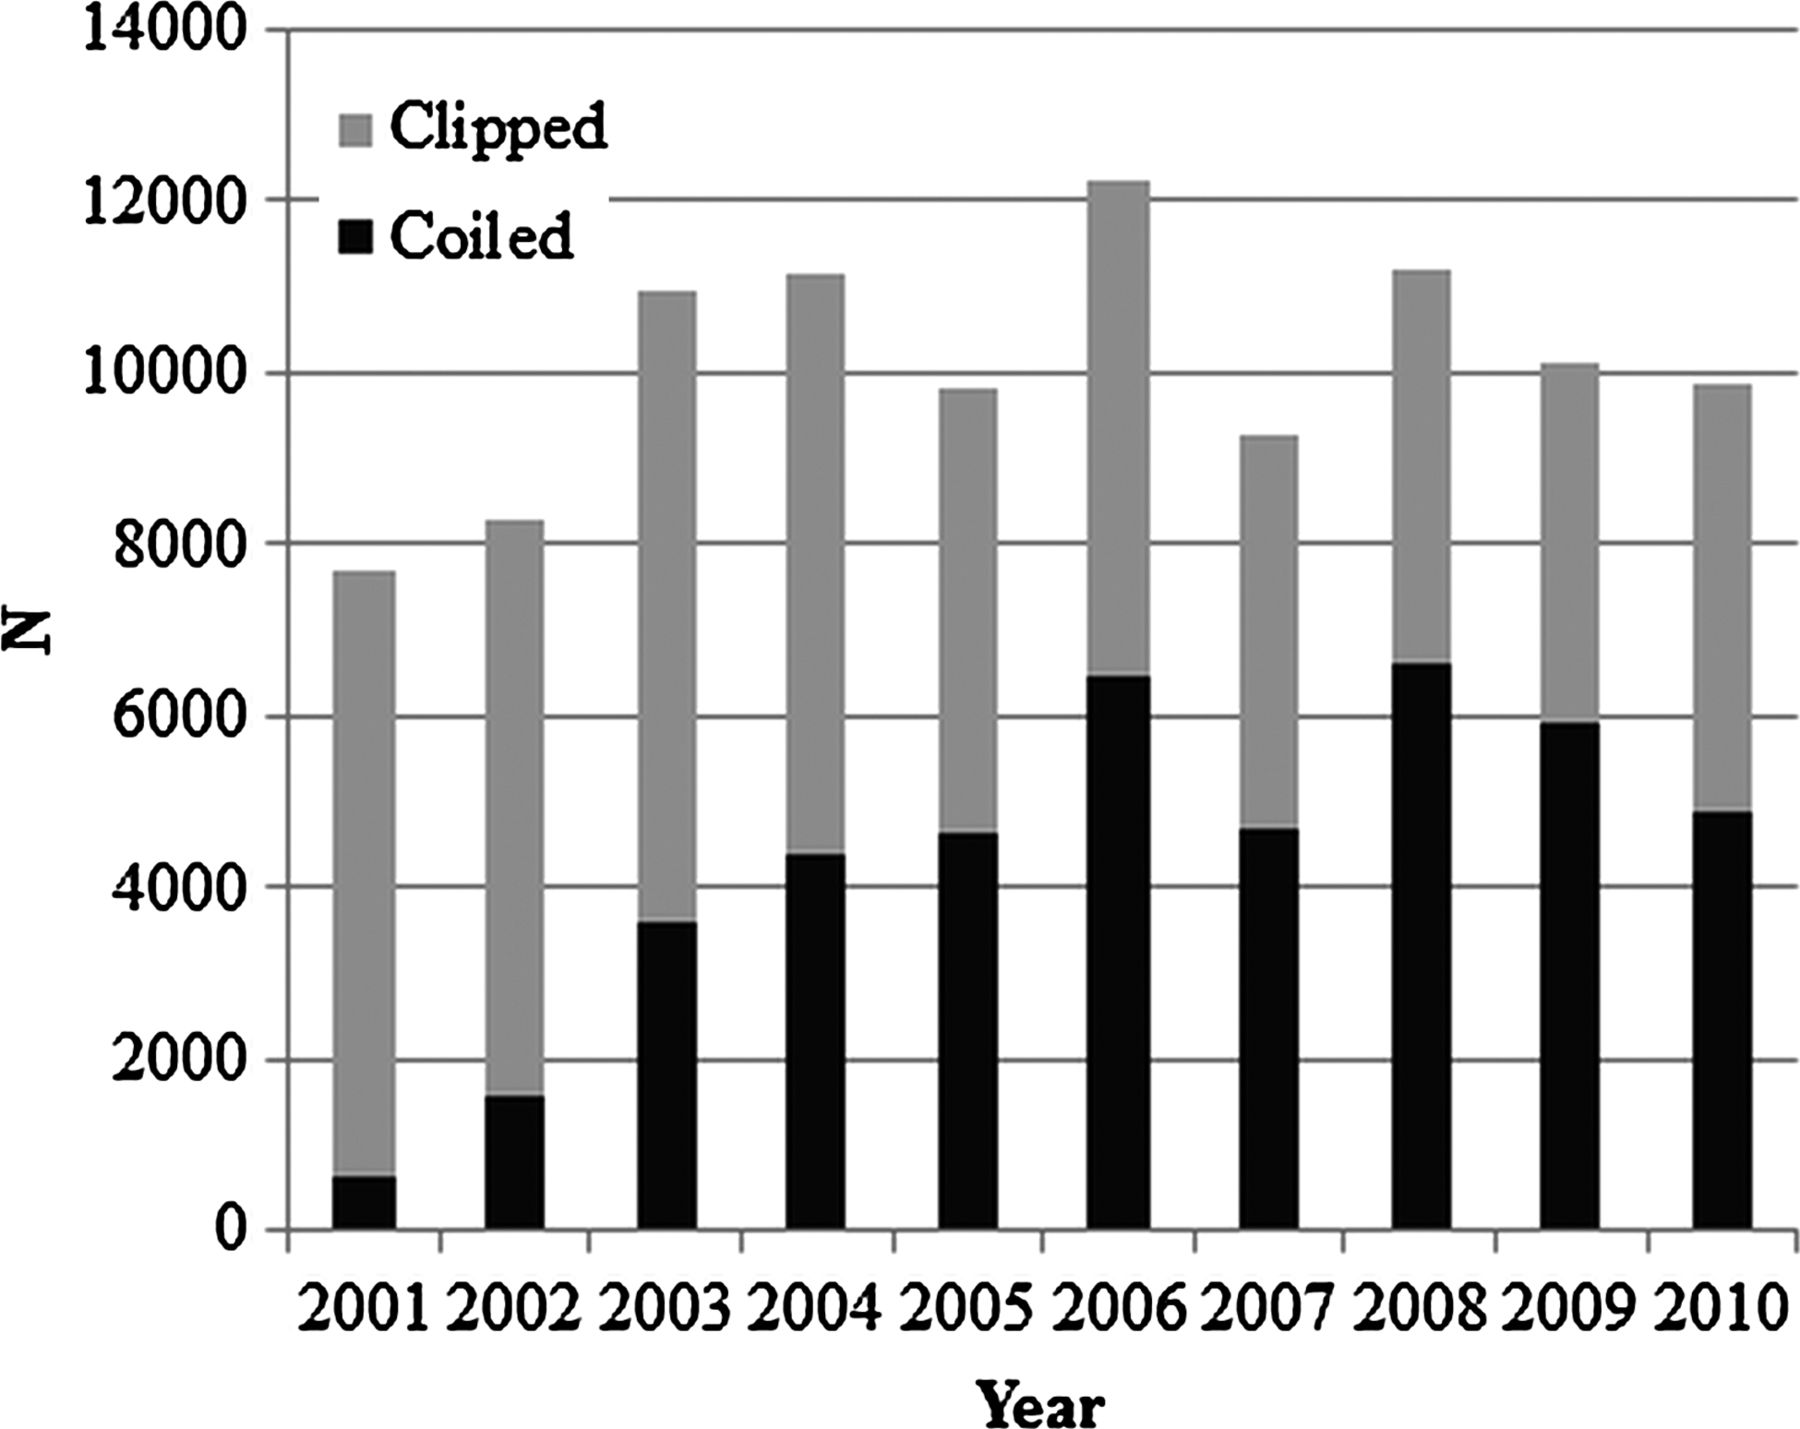
From 2001 to 2003, the number of patients treated for ruptured aneurysms increased from 7680 to 8268. From 2003 to 2010, the number of ruptured aneurysms treated per year has fluctuated between 9291 and 12 237 (figure 1). Between 2001 and 2005, the percentage of SAH patients treated with coiling increased from 8.3% to 47.0%. From 2005 to 2010, the treatment of ruptured aneurysms was fairly evenly split between clipping and coiling (figure 1).

Number of patients with subarachnoid hemorrhage treated annually by treatment modality.
The number of unruptured aneurysms treated with clipping and coiling increased steadily from 4474 in 2001 to 10 720 in 2006, but then fluctuated between 8304 and 11 897 cases from 2006 to 2010 (figure 2). From 2001 to 2004, the percentage of patients being coiled increased from 17.5% to 53.8%. Beginning in 2004, more than half of the unruptured aneurysms were treated with coiling (figure 2).

Number of unruptured aneurysm patients treated annually by treatment modality.
Trends in hospital volume
In 2001–2002, 27.4% of intracranial aneurysm patients were treated with clipping or coiling at high volume centers, with a peak of 70.1% in 2007–2008. This proportion dropped to 61.8% in 2009–2010. This trend was seen in both coiling and clipping patients. The proportion of patients clipped at high volume centers was 23.3% in 2001–2002 and peaked at 65.0% in 2007–2008. In 2009–2010, the proportion dropped to 58.6%. For coiling patients, 46.4% were treated at high volume centers in 2001–2002, with a peak of 70.1% in 2007–2008, and a drop to 61.8% in 2009–2010 (figure 3).

Percentage of aneurysm patients treated at high volume centers (≥50 cases per year).
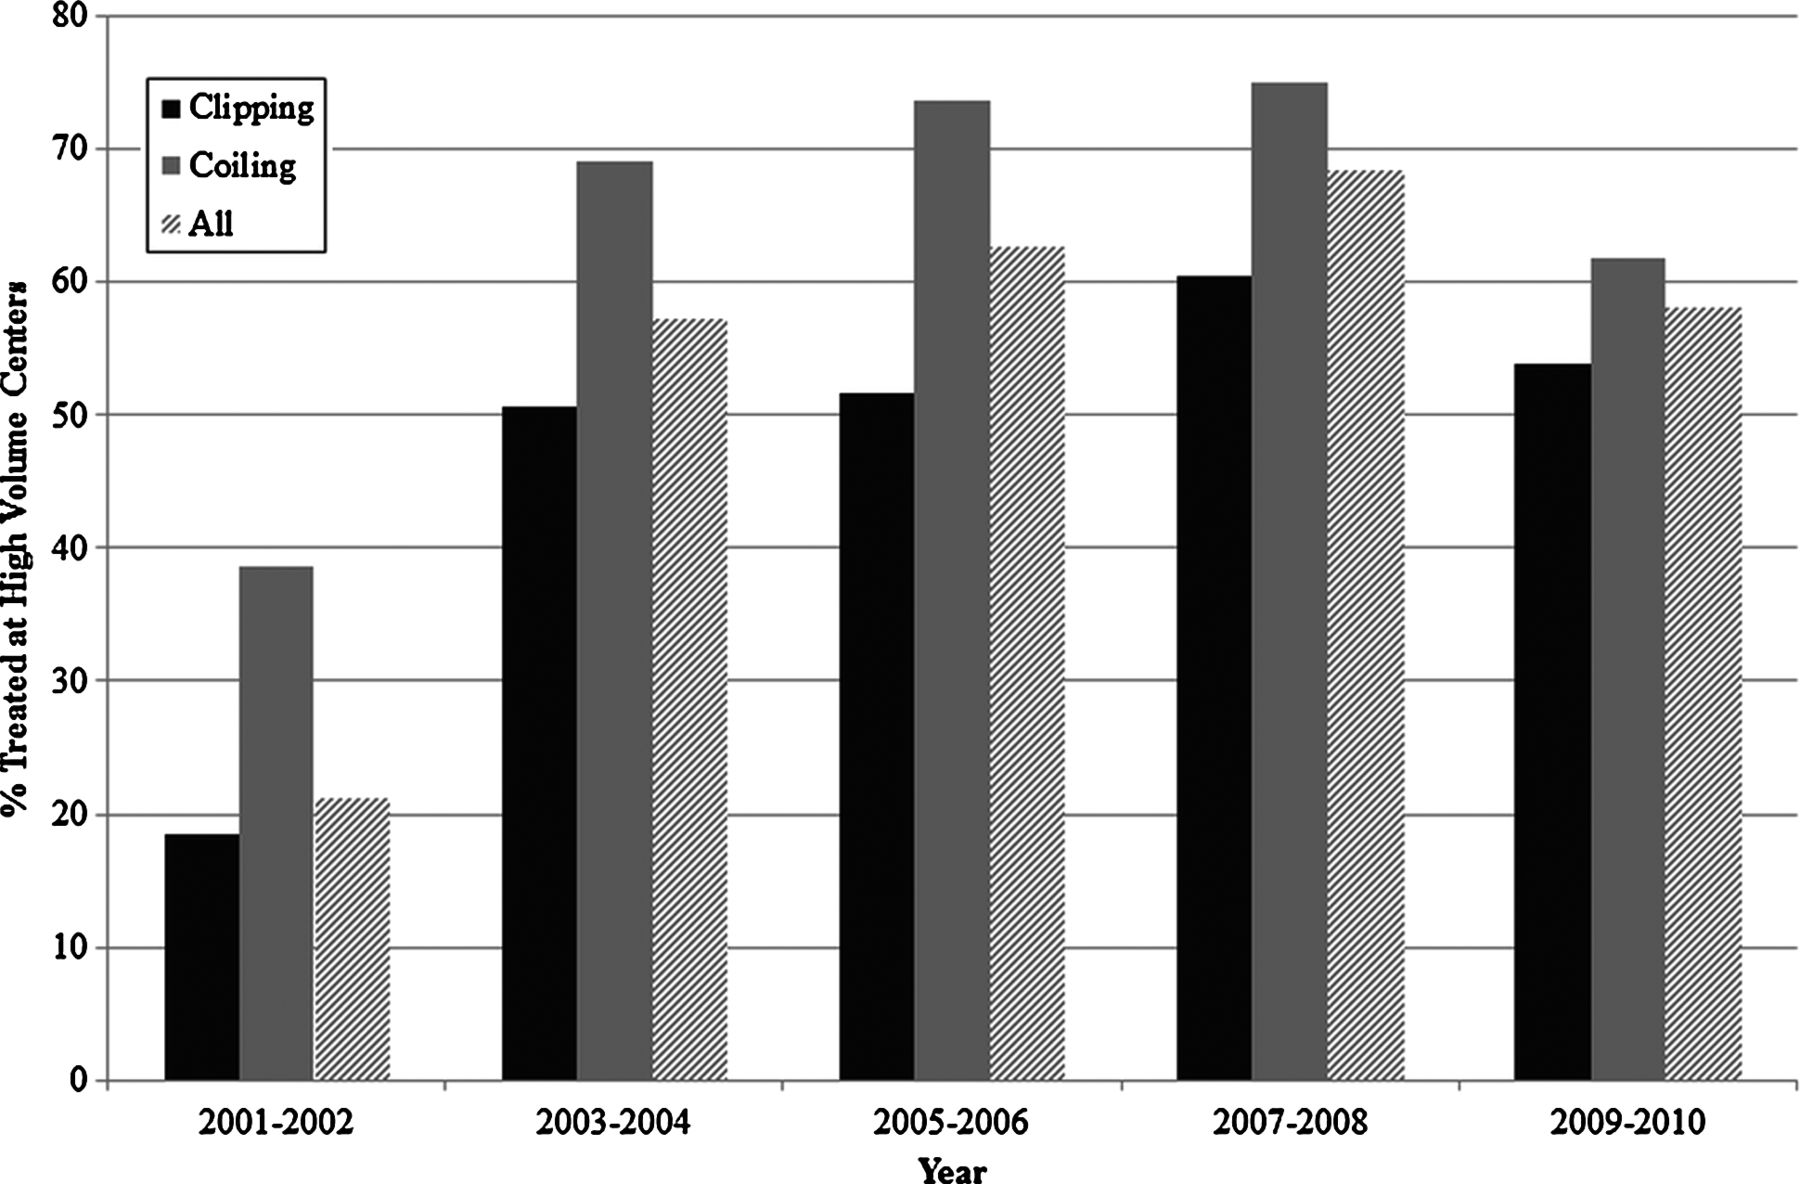
In 2001–2002, 21.3% of ruptured aneurysm patients were treated at high volume centers and this peaked at 68.5% in 2007–2008. This dropped to 58.1% in 2009–2010. For clipping patients with SAH, 18.5% were treated at high volume centers in 2001–2002, and this increased to 60.4% in 2007–2008 and dropped to 53.9% in 2009–2010. For coiling patients with SAH, 38.7% were treated at high volume centers in 2001–2002, and this increased to 75.0% in 2007–2008 and dropped to 61.8% in 2009–2010 (figure 4).

Percentage of patients with subarachnoid hemorrhage treated at high volume centers (≥50 cases per year).
In 2001–2002, 37.9% of unruptured aneurysm patients were treated at high volume centers and this peaked at 73.4% in 2005–2006. This proportion dropped to 65.4% in 2009–2010. The proportion of patients receiving clipping for unruptured aneurysms at high volume centers increased from 32.7% in 2001–2002 to 70.4% in 2007–2008, and dropped to 63.6% in 2009–2010. The proportion of coiling patients treated at high volume centers increased from 53.6% in 2001–2002 to 78.2% in 2005–2006 and dropped to 66.8% in 2009–2010 (figure 5).

Percentage of unruptured aneurysm patients treated at high volume centers (≥50 cases per year).
Due to variations in the sampling of hospitals in the NIS, the number of aneurysm treatment centers fluctuated between 104 and 155 during the study time period. The percentage of aneurysm treatment centers with <50 cases/year steadily declined from 99.3% in 2001 to 85.3% in 2008. Since 2008, there has been an increase in the percentage of low volume treatment centers to 91.3% (figure 6).

Percentage of aneurysm treatment centers which are low volume centers (<50 cases per year).
Discussion
Our results show that while the number of patients with cerebral aneurysms treated with clipping and/or coiling has leveled off, the proportion of cases treated at high volume centers decreased in 2009 and 2010. This has implications for patient safety as multiple studies have established that outcomes for the treatment of both ruptured2–6 and unruptured2 ,5–10 aneurysms are better at centers that treat a higher volume of these patients. The shift in cases away from high volume centers is likely related to the rapidly expanding supply of neurointerventionalists, which has been the subject of recent analysis.11 ,12
The neurointerventional workforce expansion is difficult to track precisely because there is no strict definition of what a neurointerventionalist is, such as board certification. While it is difficult to precisely count practicing neurointerventionalists on an annual basis, it is clear from available information that the workforce has expanded considerably.11 ,12 The workforce expansion is likely outpacing any expansion of patients needing neurointerventional services. Our study shows that growth of the cerebral aneurysm patient population undergoing treatment has leveled off, so incremental neurointerventionalists added to the workforce would be generally expected to establish their practices by diverting patients away from high volume centers. Our study results indicate that this is indeed what is taking place. It might very well be true that this trend of diverting patients away from high volume centers is accelerating because the trend of the neurointerventionalist workforce expanding by about 10% per year11 has probably not slowed down after 2010.
A limitation of our study is that coding inaccuracies undoubtedly occur, but this is no different from other retrospective studies of administrative databases. We do not intend to provide a threshold for the number or proportion of aneurysms that should be treated at high volume centers to optimize outcomes, but rather provide readers with an understanding of a general trend during the study period.
Conclusion
A trend toward a lower proportion of cerebral aneurysms being treated in high volume centers in 2009 and 2010 is worrisome because high volume centers are known to have better outcomes. This trend is likely due to recent expansion of the neurointerventional workforce.
References
Footnotes
-
Contributors All authors have made substantial contributions to conception and design, acquisition of the data, and interpretation of the data. All authors participated in drafting and/or revising the article for important intellectual content. All authors have approved the final draft of this manuscript.
-
Competing interests HJC: site PI at enrolling site for SAPPHIRE (Stenting and Angioplasty with Protection in Patients and HIgh Risk for Endarterectomy) registry sponsored by Cordis Endovascular. DFK: grant—ev3 funding for clinical trials and preclinical research; grants/grants pending—Penumbra, MicroVention, Micrus, and Cordis.
-
Ethics approval The study was approved by the institutional review board.
-
Provenance and peer review Not commissioned; externally peer reviewed.
-
Data sharing statement The authors agree to share any data on request. These data were obtained from a nationwide administrative database and are publicly available for a small fee. Details on obtaining this database can be found on AHRQ.gov. The authors would be happy to answer any questions on data acquisition for any interested readers and reviewers. The authors are willing to share their spreadsheets with any readers who request them.