-
PDF
- Split View
-
Views
-
Cite
Cite
Attila Altiner, Silke Brockmann, Martin Sielk, Stefan Wilm, Karl Wegscheider, Heinz-Harald Abholz, Reducing antibiotic prescriptions for acute cough by motivating GPs to change their attitudes to communication and empowering patients: a cluster-randomized intervention study, Journal of Antimicrobial Chemotherapy, Volume 60, Issue 3, September 2007, Pages 638–644, https://doi.org/10.1093/jac/dkm254
Close - Share Icon Share
Abstract
Assessing the efficacy of an educational intervention that aimed to reduce unnecessary antibiotic prescriptions in primary care by motivating GPs to change their attitudes to communication and by empowering patients.
One hundred and four GPs in North-Rhine/Westphalia-Lippe, Germany were cluster-randomized into intervention and control. GPs randomized to receive the intervention were visited by peers. The intervention strategy was focused on the communication within the encounter, not on sharing knowledge about antibiotic prescribing. Leaflets and posters were provided that aimed at patient empowerment, thus enabling patients to raise the topic of antibiotic prescriptions themselves.
Eighty-six GPs (83%) remained in the study at 6 weeks and 61 GPs (59%) at 12 months. Antibiotic prescription rates within the control group were 54.7% at baseline and 36.4% within the intervention group at baseline. Generalized estimating equation models were applied. Baseline imbalances and confounding variables were controlled by adjustment. After the intervention, the ORs for the prescription of an antibiotic dropped to 0.58 [95% CI: (0.43;0.78), P < 0.001] after 6 weeks and were 0.72 [95% CI: (0.54;0.97), P = 0.028] after 12 months in the intervention group. In the control group, the ORs rose to 1.52 [95% CI: (1.19;1.95), P = 0.001] after 6 weeks and were 1.31 [95% CI: (1.01;1.71), P = 0.044] after 12 months; these ORs correspond to an ∼60% relative reduction in antibiotic prescription rates at 6 weeks and a persistent 40% relative reduction at 12 months.
An interventional strategy that focused on doctor–patient communication and patient empowerment is an effective concept to reduce antibiotic prescriptions in primary care.
Introduction
Reducing antibiotic prescriptions for respiratory tract infections has become an important issue for primary healthcare across Europe, North America and many other countries. Most of the antibiotics used for respiratory infections are prescribed in primary care, particularly for patients with acute cough symptoms.1–3
Whether a small minority of all patients with acute cough benefit to some extent from antibiotics is an ongoing debate. However, a consensus has been established that antibiotics are usually not necessary for the initial treatment of acute cough due to respiratory infection.4 The over-prescription of antibiotics puts patients at risk of side effects and of bacterial resistance and leads to unnecessary costs. Furthermore, irrational prescribing of antibiotics for acute cough nourishes the vicious circle of medicalization of a self-limiting illness, in which patients learn that antibiotics seem to be necessary for their symptoms and then expect them the next time they experience them.5
Non-biomedical aspects such as perceptions of patients' expectations play an important part in the decision process whether or not to prescribe antibiotics for acute respiratory infections.6,7 GPs often perceive a pressure to prescribe antibiotics.8 In contrast, patients do not expect antibiotics as often as their GPs think they do.9,10 Misconceptions as well as misunderstandings and uncertainties regarding the role of antibiotics exist on both the patients' and doctors' side. When patients describe severe symptoms or the wish to get well quickly, GPs often misinterpret this behaviour as a demand for antibiotics. However, patients are often just worried and want to be reassured that a serious disease is sufficiently ruled out.6,7,9
Considering this background, we presumed that a better understanding and an improved patient-centred approach within the consultation could help to reduce unnecessary antibiotic prescriptions. We also expected that ‘informing’ both sides in the consultation, the patient and the doctor, about the mutual discordance between patients' expectations and perceived patients' expectations by the GP (‘antibiotic misunderstanding’), would help them to start talking openly about the topic, and thus reduce the overall rate of antibiotic prescriptions without reducing antibiotic prescriptions when they are justified (e.g. for pneumonia).
Starting a process of behavioural change is a complex task in which combined interventions have turned out to have the largest impact.11 We therefore performed a cluster-randomized controlled trial to assess the effect of a complex peer-led intervention. The purpose of the intervention that we developed was to address specific doctor–patient misunderstandings that lead to unnecessary antibiotic prescriptions for acute cough.
Methods
Ethics
Approval was granted by the Ethics Committee of the medical faculty of the University of Duesseldorf (no. 2398). The trial was registered with the Projektdatenbank Versorgungsforschung NRW, ID: 90/34/CHANGE.
Documentation
The cluster-randomized controlled trial had three phases of data collection: baseline, 6 weeks after the intervention and 1 year after the intervention. The documentation included data on the patient, the symptoms, examinations done and all prescriptions, including drug samples dispensed.
Sample size
The sample size calculation was based on the assumption of 6 month antibiotic prescription rates of 50% in the control group and 40% in the intervention group. A standard sample size calculation would result in approximately 1000 patients required to demonstrate this effect in a two-sided likelihood-ratio test with a power of 90%. For the cluster-randomized trial, the required sample size had to be increased by a factor that was assumed to lie in an interval from 3 to 5, corresponding to an assumed intraclass correlation coefficient of 0.1–0.2. Allowing a drop-out rate of 20%, it was decided to recruit 200 practitioners who should contribute 20 patients in each observation period. The number of patients per practitioner was conservatively defined in order to cope with the problem that possible variations in presentation rates could not be taken into account when the sample size was calculated.
Recruitment and randomization and inclusion criteria
All 2036 GPs from nine regions in North-Rhine and Westphalia-Lippe, representing areas of high, medium and low population density, were invited by letter to participate in a ‘study on the care of acute cough in general practice’. The invitation did not reveal that the primary outcome of the study was ‘rate of antibiotic prescriptions’. Two hundred and thirty-nine GPs volunteered to participate in the study and received the material for the baseline documentation of all consecutive patients visiting the surgery within a period of 6 weeks because of acute cough. According to the inclusion criteria, patients had to be 16 years of age or older, had to understand German, had to be seen for the first time within an episode of cough and should not have had another episode of cough for the previous 8 weeks. Underlying chronic lung diseases such as asthma, chronic obstructive pulmonary disease, immune deficiency or malignant diseases were exclusion criteria.
One hundred and one of the 104 doctors presented reliable documentation, as tested by study monitoring in 5% of the total documented patients, and were randomized into control and intervention groups. Ten GPs who worked in the same practices were randomized as pairs. Stratified randomization was discussed as collection of baseline data revealed considerable variation in several variables between GPs. However, because study size made it impossible to stratify for all these covariates, we decided not to perform a stratified randomization, but to strictly follow a program-generated complete randomization list.
Intervention
Peers. GPs in the intervention group were visited by GP peers in their clinics during normal working hours. The peers were five practising GPs (two females/three males, 33–63 years of age), all of them assigned teachers in our department, and were trained within three sessions for their outreach visits. The central topic of the peer visits was the phenomenon of antibiotic misunderstanding during a consultation, as described earlier. In order to address the GPs' beliefs and attitudes most effectively, the peers were trained to explore and evaluate their ‘opposite’ motivational background. The peers used a semi-standardized dialogue script to distribute their message using communicative techniques derived from the elaboration likelihood model.12
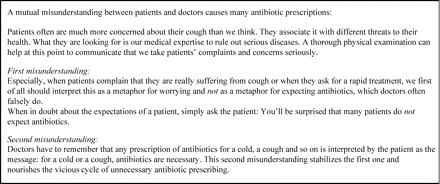
Peers motivated the GPs to explore patients' expectations and demands thoroughly and open-mindedly, to elicit anxieties and expectations and to make antibiotic prescribing a subject in the consultation. Many aspects of this interventional strategy were derived from qualitative research that preceded this study.13 The main messages addressed to the GPs are summarized in Figure 1.
Key educational messages for GPs allocated to the peer intervention.
Materials for patients
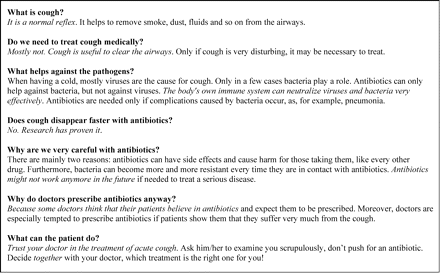
We developed a patient leaflet and a poster for the waiting room. These materials contained brief evidence-based information about acute cough and antibiotics, but mainly focused on the patients' role within the antibiotic misunderstanding. By explaining the reasons why GPs often feel a pressure to prescribe antibiotics, patients were expected to be enabled to raise and clarify the issue themselves within the consultation. The messages addressed to the patients are shown in Figure 2.
Control group
The control group did not receive any part of the intervention.
Documentation
In each of the three documentation intervals of 6 weeks (baseline before randomization, 6 weeks after intervention and 12 months after intervention), the participating GPs recorded all their patients with acute cough meeting the inclusion criteria. We chose a study-specific paper documentation instead of using computerized data from the surgeries or statutory health insurance data for the following reasons: (i) exact assignment of all prescriptions to the indication ‘acute cough’; (ii) inclusion of all eligible patients (∼15% of all patients in Germany have private health insurance where prescription data would be difficult to obtain); (iii) inclusion of drug samples (including antibiotics) dispensed by GPs; and (iv) limited availability and data quality of routine data.
Each patient was assigned a unique identification number that could be connected with the patient only by the participating GP. The documentation of each patient contained: age, sex, duration of cough before consultation, smoker yes/no, fever, severity of the disease rated by GP (score 1–4), prescribed drugs or given drug samples. GPs were also free to document their results of physical examination or any other possibly relevant information.
Outcome measures
The primary outcome measure was the rate of antibiotic prescriptions per acute cough and by GP. We neither followed up patients in relation to clinical outcome nor patient satisfaction, as it has been sufficiently demonstrated that neither clinical outcome nor patient satisfaction is significantly affected by a rational reduction in antibiotic prescriptions for respiratory tract infections.14–16
Analysis
Generalized estimating equations (GEE) models with logit links and exchangeable correlation structure (i.e. population averaged) were applied to estimate and test rates and rate ratios. All analyses presented in this article (with the exception of the sensitivity analyses) were performed including only practices with complete follow-up. At first, baseline characteristics were compared between groups. Study groups were not fully balanced, as frequently observed in cluster-randomized trials.17 A significant difference was found in antibiotic prescription rates, a variable that could potentially bias the results. To exclude confounding effects, we decided to perform two parallel analyses of the data, an unadjusted analysis and an analysis adjusted for six patient-level and seven physician-level covariates including prescription rates. A backward elimination led to a final model that only included significant confounder variables (discussed subsequently). Relative changes from baseline are given as odds ratios. The intervention effect is quantified by the between-groups odds ratio of the corresponding estimates of changes from baseline from the fully adjusted model, which we assume to give the best account of the study results. Confounding effects are reported on the basis of the model with selected variables. In each case, the given rates and ratios are accompanied by Wald test P values or 95% confidence intervals.
In order to find out whether the strength of the intervention effect depends on the individuality of the peers, we performed an additional analysis in which each peer was modelled as a separate intervention and tested for differences. Likewise, in an exploratory manner, we introduced the available physicians' characteristics (age, sex and experience) to the model to find out whether prescription behaviour can be predicted from readily available data. Based on the patients with full data sets meeting the inclusion criteria, all models were fitted using STATA/SE 8.0.18
Monitoring
All participating GPs were contacted at least once during each documentation interval (baseline and follow-up periods) by telephone. Monitors asked for the prescription data randomly of chosen patients as found in the GPs' own computerized records and compared these data with the data sent to us.
Results
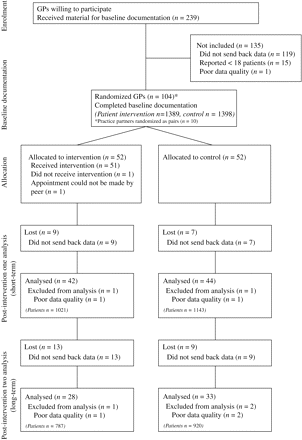
One hundred and four GPs completed the baseline documentation (November 2003 to January 2004) and were randomized to either intervention or control (52/52). After randomization, 51 outreach visits were performed by the peers (January–February 2004). Eighty-six GPs (42 intervention/44 control) completed the second documentation interval starting 6 weeks after the intervention (February–April 2004). Sixty-one GPs (28 intervention/33 control) completed the third documentation interval 12 months after the intervention (January–March 2004). Flow chart and characteristics of GPs and patients are shown in Figure 3 and Table 1, respectively.
General practitioners and patient characteristics at baseline, 6 weeks and 12 months after intervention
| . | Baseline . | Six weeks . | Twelve months . | ||||||
|---|---|---|---|---|---|---|---|---|---|
| . | Intervention . | Control . | P value . | Intervention . | Control . | P value . | Intervention . | Control . | P value . |
| Eligible patients (n) | 753 | 898 | — | 675 | 885 | — | 787 | 920 | — |
| Patients per GP (n) | 26.9 | 27.2 | 0.71 | 24.1 | 26.8 | 0.08 | 28.1 | 27.9 | 0.78 |
| Male patients (%) | 40.0 | 44.9 | 0.20 | 39.8 | 42.7 | 0.41 | 40.3 | 45.1 | 0.22 |
| Age (years) | 42.2 | 42.0 | 0.81 | 44.9 | 43.9 | 0.60 | 41.7 | 41.8 | 0.93 |
| Patients with fever (%) | 22.5 | 27.9 | 0.31 | 26.3 | 29.3 | 0.58 | 43.5 | 46.6 | 0.63 |
| Smoker (%) | 32.6 | 34.9 | 0.55 | 28.8 | 33.2 | 0.17 | 29.5 | 31.2 | 0.66 |
| Duration of cough before seeing GP (days) | 5.2 | 5.3 | 0.80 | 5.4 | 4.8 | 0.13 | 4.1 | 4.4 | 0.34 |
| Severity of illness (scores 1–4) | 2.1 | 2.2 | 0.13 | 2.1 | 2.2 | 0.30 | 2.2 | 2.4 | 0.05 |
| Male GPs (%) | 75.0 | 76.7 | 0.89 | 75.0 | 76.7 | 0.89 | 75.0 | 76.7 | 0.89 |
| Age (GP) (years) | 49.1 | 47.2 | 0.34 | 49.1 | 47.2 | 0.34 | 50.1 | 48.2 | 0.34 |
Analysed data sets of 58 GPs (28 intervention/33 control).
At baseline, average antibiotic rates were 36.4% in the intervention group and 54.7% in the control group. In the intervention group, average antibiotic rates changed from baseline to 29.4% at 6 weeks after the intervention and to 36.7% after 1 year, although the simultaneously collected rates in the control group increased to 59.4% after 6 weeks and to 64.8% after 1 year, according to the unadjusted analysis. These figures correspond to odds ratios for changes from baseline of 0.73 [95% CI: (0.59;0.88), P = 0.002] and 1.01 [95% CI: (0.84;1.22), P = 0.931] in the control group and 1.22 [95% CI: (1.03;1.44), P = 0.025] and 1.53 [95% CI: (1.29;1.82), P < 0.001] in the intervention group. However, these figures were confounded by differences in the severities of diseases over time. After backward elimination, four explanatory variables remained in the model: patients' disease severity, measured on a 4-point scale [odds ratio 4.8, 95% CI: (3.9;5.9) per step on scale, P < 0.001], and average practice severity (severity of the disease rated by the GP) [odds ratio 0.14, 95% CI: (0.06;0.33), P < 0.001 per category step on the scale], patients having fever [odds ratio 1.80, 95% CI: (1.35;2.39), P < 0.001 compared with no fever] and frequency of fever in practice, as determined by the log odds [odds ratio 1.31, 95% CI: (1.08;1.59), P = 0.007 per category step on the scale].
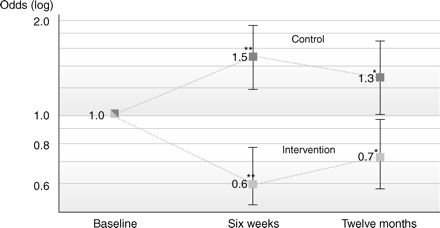
After full adjustment, the estimates changed to 0.58 [95% CI: (0.43;0.78), P < 0.001] and 0.72 [95% CI: (0.54;0.97), P = 0.028) in the intervention group and 1.52 [95% CI: (1.19;1.95), P = 0.001] and 1.31 [95% CI: (1.01;1.71), P = 0.044) (Figure 4) in the control group, resulting in between-groups odds ratios of 0.38 [95% CI: (0.26;0.56), P < 0.001 compared with control] after 6 weeks and 0.55 [95% CI: (0.38;0.80), P = 0.002 compared with control] after 1 year, indicating a strong intervention effect that persisted after 1 year, although slightly attenuated.
Odds ratios for antibiotic prescriptions in intervention and control.
Sensitivity of the results to loss-to-follow-up
Of the GPs who were initially included in the study, 17% dropped out 6 weeks after intervention and another 24% dropped out within 1 year. Although there were no significant differences between GPs who complied up to the end of the study and GPs who dropped out, we decided to perform a cluster-level sensitivity analysis to rule out that the result was influenced by differential missing values. For this purpose, we imputed new values for missing average antibiotic rates. First, we performed a regression analysis according to GPs with complete data sets to receive a prediction rule of 6 weeks and 1 year antibiotic prescription rates from baseline antibiotic rates. Secondly, we used these rules to estimate follow-up prescription rates for those physicians that dropped out of the study. The analysis resulted in estimates of 0.59 after 6 weeks and 0.65 after 1 year for the intervention effect. Alternatively, if the last observations (baseline or 6 weeks) were carried out, the intervention effect was estimated to be 0.60 after 6 weeks and 0.57 after 1 year. Both analyses are in line with the results reported earlier.
Discussion
Design
Frequency, duration and severity of disease vary with season and regional spread of pathogens. Thus, it was not to be expected that the prescription rates would be constant in a control group. Seasonal and regional variations may bias results and reduce the power of the study. The complex design of the study had to be taken into account in the analysis stage. We performed GEE modelling to be able to give unbiased estimates and correct P values or confidence limits. The observed intraclass correlation was 0.20. Participation rates were lower than anticipated. However, as the intervention effects were larger than expected, the power of the study was sufficient to demonstrate even more specific effects of interest, without the need to re-recruit further participating GPs.
The cluster randomization resulted in baseline imbalances only in the primary outcome variable. The differences may simply result from random effects, as the initial antibiotic prescribing rate was the parameter with the largest variance. Although adjustment for baseline changed the estimated rates, it had no impact on the odds ratios. Subsequent analyses gave no signs that the strength of the intervention effect depended on any of the baseline recorded characteristics of the GPs, including antibiotic prescription frequencies.
Control group
As expected, the prescription rates in the control group varied considerably with time. Adjustment for severity and duration of disease changed the time trends considerably. This can be explained by a much higher rate of upper respiratory infections (epidemiological data) as well as an increase in the severity of the symptoms accompanying acute cough (study data) in January–March 2005 when compared with 2003 and 2004.19 The severities of symptoms are known to be relevant determinants for antibiotic prescriptions.7,8 However, an increase in antibiotics after 6 weeks in 2004 when compared with baseline was observed. This observation can be explained by a law that came into effect on 1 January 2004: over-the-counter remedies (OTCs) such as mucolytics, analgesics and cough mixtures (including herbal preparations) before then reimbursed by the German statutory health insurance funds (when prescribed by a physician) were now excluded from reimbursement. Before the law came into effect, German GPs had frequently prescribed these drugs. To be still able to provide their patients with ‘free’ drugs, GPs moved from prescribing OTCs to drugs that were still being reimbursed: antibiotics and codeine.20
Potential biases and confounding
When interpreting the results, we have to take into account the potential biases in the intervention group. A social desirability bias may have caused a selection bias of patients to be reported by GPs allocated to intervention or could lead to unreliable reports. We were aware of that problem and tried to make the barrier for such a selection bias as high as possible. As part of the monitoring, GPs' own computerized records were compared with the self-reported data sent to us. We did not detect any irregularities. However, instead of giving false data, GPs simply could have avoided reporting patients who had received an antibiotic. This would have led to differences in the numbers of patients reported in intervention practices when compared with control. Therefore, we checked the numbers and characteristics of the patients, but did not find any systematic differences between intervention and control. However, we did not monitor the patient population of participating GPs during the trial period; therefore, we cannot completely rule out that under-reporting of patients with acute cough occurred. Also it has to be considered that GPs allocated to intervention could have dropped out after ‘returning’ to old prescribing behaviour. However, the performed sensitivity analysis showed that drop-outs did not bias the reduction of antibiotic prescription rates as observed in the intervention group. Therefore, we are confident that the study results are not influenced by a selection bias.
The probability that a patient received antibiotic treatment increased with fever and severity of disease. It was interesting to see that this probability increased also when a high percentage of patients in a practice had fever, indicating the presence of a local epidemic.
Intervention group
According to this analysis, antibiotic prescription rates were initially reduced by ∼60% and remained on a level of ∼40% reduction after 1 year. The result indicates that the one-time intervention resulted in immediate changes of prescription habits, which were maintained over a long period without re-intervention.
Comparison with other randomized trials
A few successful intervention trials that achieved a long-term reduction in antibiotic prescriptions in primary care show a large variability in the design of the interventions used.21 Samore et al.22 reduced antibiotic prescription rates with the help of a computerized clinical decision system within a group of GPs who had very high prescribing rates of 84.1% to 75.3% after 1.5 years of continuous utilization. Welschen et al.14 used group education and prescription feedback successfully within a low prescribing setting (27% prescription rate) with a relative 11% reduction in antibiotic prescriptions after 9 months. Little et al.23,24 found ‘delayed-prescribing’ to be an effective strategy to reduce antibiotic prescriptions in upper respiratory tract infections. Briel et al.25 could not show a significant benefit of additional communication training in patient-centredness in comparison with guideline dissemination alone.
The achievement of a relative reduction of antibiotic prescriptions of 40% after 1 year, as observed in our study, is unprecedented. Our intervention differed from previous studies as it focused primarily on changing the attitudes to communication of GPs and patients in contrast to interventions that were outlining medical evidence, or using a more technical or organizational approach.
Conclusions
The study illustrates that reducing antibiotic prescriptions in primary healthcare settings is a complex but realistic task. Using a message that does not focus on ‘knowledge’ but aims at a process of changing communication within the patient–doctor encounter might be a reasonable and effective concept.
Acknowledgements
The authors thank Samuel Coenen for his advice and support in the preparation of this study.
Funding
This study was partly funded by a research grant from the AOK Bundesverband (a statutory health insurance fund).
Transparency declarations
None to declare.
References
Author notes
Present address. Department of General Practice and Family Medicine, University of Witten/Herdecke, Alfred Herrhausen-Str. 50, 58448 Witten, Germany.


