


Tuberculosis (TB) remains a major global health problem, with 9·4 million new cases and 1·7 million deaths each year(1). HIV infection increases the risk of reactivation of latent TB(Reference Woldehanna and Volmink2) and in settings where HIV prevalence is high; HIV co-infection may be above 50 % in TB patients(Reference Corbett, Watt and Walker3, Reference Range, Magnussen and Mugomela4).
Both TB and HIV cause undernutrition due to reduced food intake and increased utilisation of energy and nutrients(Reference Onwubalili5–Reference Macallan7) and the co-existence of the two diseases may lead to more undernutrition(Reference Niyongabo, Henzel and Idi8–Reference Swaminathan, Padmapriyadarsini and Sukumar10). Despite advances in HIV and TB management, undernutrition is common among HIV-infected TB patients(Reference Paton, Castello-Branco and Jennings11) and may affect treatment outcome and survival(Reference Range, Changalucha and Krarup12) and regain of functional abilities. Thus, nutritional support should be an integrated component of case management, although there are insufficient data on the optimal nutrient amounts and composition(Reference Abba, Sudarsanam and Grobler13).
In a recent two-by-two factorial trial among sputum-positive pulmonary tuberculosis (PTB+) patients in Tanzania, we found that daily supplementation with Zn and other micronutrients increased weight gain by 2·4 kg and reduced mortality by 70 % among those co-infected with HIV(Reference Range, Changalucha and Krarup12). Based on these findings, we conducted two trials to further examine the effects of nutritional support on weight, body composition and handgrip strength. Among PTB+/HIV+ patients, we assessed the effects of adding energy–protein to the multi-micronutrient supplement previously found to improve survival(Reference Range, Changalucha and Krarup12), whereas among PTB+/HIV − , PTB − /HIV+ and PTB − /HIV − patients, the effects of multi-micronutrient supplementation were assessed(Reference PrayGod, Range and Faurholt-Jepsen14). Here, we report the results of the first trial.
Subjects and methods
Study setting and recruitment
The study was conducted from April 2006 to March 2009 at four TB clinics in Mwanza city, under the Tanzanian National TB and Leprosy Programme (NTLP). Although the incidence of TB is still high in Tanzania (183 per 100 000 population in 2009), the cure rate is 84 %(1), and the prevalence of multi-drug resistance TB is only 1·1 % among new cases and 3·9 % among relapse cases(Reference Chonde, Basra and Mfinanga15).
New or relapse(16) PTB+ HIV-co-infected patients were enrolled in the study after giving a written informed consent if they were residents of Mwanza city. Patients with extra-pulmonary TB, pregnancy, age under 15 years or terminal illness were excluded. Patients who were either PTB − or HIV − were included in a concurrent trial(Reference PrayGod, Range and Faurholt-Jepsen14).
The diagnosis and treatment of TB followed established guidelines(17). Briefly, all TB suspects were asked to bring three sputum samples for sputum microscopy and were asked to do a chest X-ray as appropriate(17, Reference Githui, Kitui and Juma18). Patients were classified as PTB+, if two samples tested positive or one sample tested positive and a chest X-ray was suggestive of TB. After diagnosis, all patients were started on TB treatment based on existing national guidelines(16). However, the treatment duration and mode of supervision for patients diagnosed with TB for the first time changed 6 months after the study started(19). From April 2006 to the end of September 2006, the total TB treatment period was 8 months using single drug tablets. Rifampicin, isoniazid, pyrazinamide and ethambutol were used in the first 2 months (intensive phase) and ethambutol and isoniazid for the last 6 months (continuation phase). Patients were observed daily for the intake of drugs at the health facility by a health worker during the intensive phase. During the continuation phase, patients collected drugs from the health facility on a monthly basis for self-administration at their homes. From 1 October 2006, the NTLP reduced treatment duration from 8 to 6 months and introduced new drug formulations and mode of supervision. During this period, the same regimen consisting of rifampicin, isoniazid, pyrazinamide and ethambutol in a multi-drug tablet was used during the intensive phase and rifampicin and isoniazid were used during the continuation phase (4 months). Patients were asked to choose either to have their treatment supervised at home or at the health facility. Those who chose home-based supervision had to select a person to supervise their daily treatment at home. Also, they had to collect drugs from the health facility once weekly during the intensive phase and every 2 weeks during the continuation phase. Those who chose health facility-based supervision had to take the drugs daily at the clinic throughout the treatment period. In both time periods, patients who were being re-treated for TB, received treatment for 8 months and their drug intake was observed daily at the health facility(17).
The management of HIV infection was done based on national guidelines at the time of the study(20). Patients were immediately initiated on antiretroviral therapy (ART) if they had a cluster of differentiation 4 (CD4) count of < 200 cells/μl, those with a WHO stage 4 illness and/or a CD4 count of 200–350 cells/μl were initiated on ART after completion of 2 months of TB treatment, and the need for ART was assessed after completion of TB treatment for patients with a CD4 count of >350 cells/μl. Patients who developed TB after starting ART were allowed to continue with ART throughout TB treatment.
Study design and interventions
The study was a randomised controlled trial assessing the effect of energy–protein supplementation among HIV-infected PTB+ patients on weight, arm fat area, arm muscle area and handgrip strength. Patients were randomised to receive one or six energy–protein biscuit bars daily for 60 d during the first 2 months of TB treatment. One of the biscuit bars given to the experimental group and the one given to the control group contained additional micronutrients, so that the supplemental micronutrient intake was similar in the two groups. Each energy–protein biscuit bar weighed 30 g and contained 4·5 g protein, 615 kJ energy, and 120 mg P, 120 mg Ca, 36 mg Mg, 70 mg Na, 150 mg K and only traces ( < 1 mg) of Fe and Zn. The biscuit bar with additional micronutrients also contained the following: vitamin A 1·5 mg, vitamin B1 20 mg, vitamin B2 20 mg, vitamin B6 25 mg, vitamin B12 50 μg, folic acid 0·8 mg, niacin 40 mg, vitamin C 200 mg, vitamin E 60 mg, vitamin D3 5 μg, Se 0·2 mg, Cu 5 mg and Zn 30 mg. The amount of additional micronutrients was similar to what was found beneficial among TB patients previously(Reference Range, Changalucha and Krarup12). The products were manufactured by Compact AS (Bergen, Norway) for the present trial, based on modification of a commercial product as requested by the researchers. Thus, each day, patients in the intervention arm received a total of 3690 kJ and 27 g protein, whereas those in the control arm received 615 kJ and 4·5 g protein. As a result, the trial tested the effect of providing about 50 % of the daily energy requirement, and of the RDA for protein(21) based on an average of 60 kg weight for non-TB controls in this setting(Reference PrayGod, Range and Faurholt-Jepsen22). The levels of micronutrients in the two arms were similar, although the levels for P, Ca and Mg were slightly higher in the intervention arm.
In order to match the mode of TB drug intake and supervision, in the first 6 months of the study, all supplements were taken under the observation of clinic staff, whereas from 1 October 2006 to the end of the study, most patients (90 %) took their supplements at home under the supervision of a home-based supporter, since they had also chosen to take their TB drugs at home. In this period, patients were advised against sharing the supplements with any family member and were asked to come to the TB clinic to collect their supplements every 6–12 d. The remaining 10 % of patients continued with health facility-based supplement intake supervision.
Randomisation and allocation concealment
Patients were allocated to treatment arms following a computer-generated randomisation sequence, using permuted blocks of ten. The sequence was generated using the website http://www.randomization.com, and used by a designated research staff to sequentially arrange and label supplement packs with identity numbers ranging from 1 to 500. During the study, the randomisation sequence and code were kept in a safe cabinet and was only accessible to the designated research staff. Recruitment was done by TB clinic staff. Then, the same designated research staff who was not employed at any of the TB clinics assigned an identity number to the recruited patient, and sent the corresponding nutritional supplement pack to the respective clinic. Thereafter, TB clinic staff were responsible for dispensing the supplements and keeping the intake records. The present trial was not blinded since both patients and TB clinic staff could discern the experimental intervention.
Outcome measures
The primary outcomes were weight gain at 2 and 5 months, i.e. at the end of the supplementation period and 3 months after. Secondary outcomes were gains in arm fat area, arm muscle area and handgrip strength at 2 and 5 months.
Data collection
Data on demography, smoking and alcohol intake were collected using questionnaires while data on ART were retrieved from antiretroviral use databases in ART clinics. Between 08.00 and 12.00 hours, blood was collected in a 10 ml plain vacutainer tube for HIV testing and a 5 ml EDTA vacutainer tube for CD4 count. HIV status was determined using Capillus HIV-1/HIV-2 (Trinity Biotech Plc., Wicklow, Ireland) and Determine HIV-1/HIV-2 (Inverness Medical Innovations, Inc., Newark, DE, USA) tests in parallel. HIV infection was diagnosed if both tests gave a positive result and HIV-negative diagnosis was made if both tests produced a negative result. Indeterminate results were resolved using ELISA-Organon Uniform II (Organon Teknia Limited, Boxtel, The Netherlands). CD4 count was determined as cells/μl using a Partec Cyflow Counter (Partec GmbH, Münster, German).
Weight was determined to the nearest 0·1 kg using a digital scale (Seca, Australia) and height was determined to the nearest 0·1 cm using a height board. Mid-upper arm circumference was determined to the nearest 0·1 cm using a tape measure, and triceps skinfold thickness was determined to the nearest 0·1 mm using the Harpenden caliper on the left arm. Measurements were made in duplicate, and are reported as mean values. Based on mid-upper arm circumference and triceps skinfold thickness measurements, arm muscle area and arm fat area were calculated as described previously(Reference Frisancho23) and BMI was calculated as weight (kg)/(height (m))2. Handgrip strength was determined to the nearest 0·1 kg using a digital dynamometer (Takei Scientific Instruments Company Limited, Tokyo, Japan). A total of four measurements were taken, with the mean of the two maximum measurements (one in each hand) reported. All measurements were done at recruitment and repeated at the end of 2 and 5 months. Training was provided before the study, and regular supervision was done to ensure adherence of the protocol and the same staff did the measurements throughout the study.
Ascertainment of supplement intake
Before October 2006, TB clinic staff recorded directly the intake of supplements after patients had taken the supplement under their supervision. From October 2006 onwards, patients who chose to take supplements at home were asked to record the intake of supplements using a log designed for this purpose. When patients came to collect another pack of nutritional supplements, the log was handed to the TB clinic for updating the supplement intake record. Intake of at least 80 % of the supplements was regarded as adequate compliance.
Sample size and power considerations
We planned to recruit 500 PTB patients. In a previous trial, we found that the standard deviation for weight gain in the first 2 months was 3·5 kg (N Range, AB Andersen, A Mugomela and H Früs). Therefore, we would be able to detect a 0·95 kg or a greater weight-gain difference with 80 % power and 5 % significance level, while allowing for 15 % loss to follow-up. With recruitment of 377 patients and a 12 % loss to follow-up, we would be able to detect an overall 1·1 kg weight-gain difference between the two groups.
Statistical analysis
Data were twice entered in EpiData (EpiData Association, Odense, Denmark) and analysed using Stata/IC version 10 (StataCorp LP, College Station, TX, USA). Normal probability plots were used to assess normality of the continuous variables. Differences in categorical and continuous variables between groups were tested using the χ2 test and t test, respectively. Additionally, linear regression was used to adjust for potential confounders and to test for interactions with respect to baseline CD4 count groups ( < 350 or ≥ 350 cells/μl), sex, ART during supplementation and mode of supplementation (clinic- v. home-based supplementation). Where interaction was detected, the effect of the intervention was assessed by the level of the effect modifier. Analysis was done on an intention-to-treat basis. P values below 0·05 were considered significant. The trial was registered at ClinicalTrials.gov (http://clinicaltrials.gov) identifier: NCT00311298.
Ethical considerations
The present study was conducted according to the guidelines laid down in the Declaration of Helsinki. Written informed consent was obtained from all patients enrolled in the present study. Ethical permission was obtained from the National Medical Research Coordinating Committee of the National Institute of Medical Research in Tanzania and approval from the Danish National Committee on Biomedical Research Ethics. Patients who did not know their HIV status were offered pre- and post-test HIV counselling and referred to nearby ART clinics for management.
Results
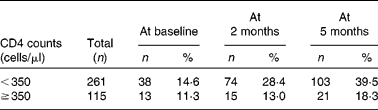
Of the 1042 TB patients who were screened at TB clinics during the recruitment period, 398 (38·2 %) were eligible, of which 377 (94·7 %) consented to participate in the trial. As seen in the trial profile (Fig. 1), of those not eligible, 154 (23·9 %) had extra-pulmonary TB, 376 (58·4 %) were non-residents and the remaining 114 (17·7 %) were aged < 15 years, terminally ill or pregnant. Of the 377 recruited, the mean age was 35·4 (range 16–80) years, BMI was 18·6 (sd 2·9) kg/m2, and 187 (49·6 %) were females and 261 (69·4 %) had CD4 cell counts below 350 cells/μl. Baseline CD4 count data for one patient in the energy–protein group were not available.
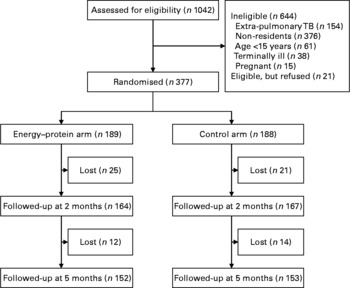
Fig. 1 Trial flow chart. TB, tuberculosis.
Randomisation achieved baseline equivalence of background characteristics (Table 1). At 2 and 5 months, forty-six (12·2 %) and seventy-two (19·1 %) patients were lost to follow-up, respectively. However, at both time points, the proportions lost to follow-up were similar across intervention and control arms (13·2 v. 11·2 %; P = 0·54 and 19·6 v. 18·6 %; P = 0·81, respectively). At 2 months, those lost to follow-up had lower arm muscle area (29·6 v. 33·8 cm2; P = 0·03), whereas those lost at 5 months had lower weight (48·5 v. 51·5 kg; P = 0·01) and arm muscle area (30·4 v. 34·0 cm2; P = < 0·001). The proportion of patients on ART kept on increasing after study entry, but this proportion did not differ between intervention and control arms at 2 and 5 months (25·9 v. 21·3 %; P = 0·29 and 33·3 v. 32·5 %; P = 0·86, respectively). In addition, throughout the follow-up period, the group with CD4 counts < 350 cells/μl had a larger proportion of patients on ART (Table 2).
Table 1 Baseline characteristics of 377 pulmonary tuberculosis patients randomised to either the energy–protein or control group
(Percentages, number of patients, mean values and standard deviations)

CD4, cluster of differentiation 4; ART, antiretroviral therapy.
Table 2 Antiretroviral use among 376 pulmonary tuberculosis patients at baseline and during a 5-month follow-up period
(Number of patients and percentages)
CD4, cluster of differentiation 4.
Overall, study patients had considerable weight and handgrip strength gain by the end of 2 and 5 months of treatment. However, energy–protein supplementation had no main effects on gain in weight, arm fat and muscle area, and handgrip strength at 2 and 5 months, but was associated with a marginally significantly higher increase in handgrip strength (1·3 kg; 95 % CI − 0·1, 2·8; P = 0·07) at 5 months (Table 3). At 2 months, there was an interaction between energy–protein supplementation and CD4 count level for weight (P interaction = 0·03), which was explained by a 1·9 kg (95 % CI 0·1, 3·7; P = 0·04) higher weight gain among patients with CD4 counts of 350 cells/μl or higher, and the lack of effect among those who had CD4 counts below 350 cells/μl ( − 0·2 kg; 95 % CI − 1·3, 0·8; P = 0·66). The beneficial effect seemed to be accompanied by changes in both arm fat and muscle area, though the estimates were not significant (Table 4). After 5 months, there was an interaction between energy–protein supplementation and CD4 count level for handgrip strength (P interaction = 0·04), which was explained by a 2·3 kg (95 % CI 0·6, 4·1; P = 0·009) higher gain in handgrip strength among those with CD4 counts of < 350 cells/μl and lack of effect among those with higher CD4 counts ( − 1·0 kg; 95 % CI − 3·5, 1·5; P = 0·43; Table 4). Interestingly, at 5 months, there was a marginally significant interaction between energy–protein supplementation and ART use for handgrip strength (P interaction = 0·08) due to a greater effect of energy–protein supplementation on handgrip strength among those on ART (3·0 kg; 95 % CI 0·5, 5·6; P = 0·02) but not among those not on ART (0·4 kg; 95 % CI − 1·3, 1·5; P = 0·61).
Table 3 Effect of energy–protein supplementation on weight, arm fat area, arm muscle area and handgrip strength among 377 pulmonary tuberculosis patients at 2 and 5 months
(Number of patients, mean values and 95 % confidence intervals)

* Difference assessed using the unpaired t test.
† Difference computed as the mean increase from baseline to follow-up.
‡ Difference computed as the mean change in the energy–protein group minus control group.
Table 4 Effect of energy–protein supplementation on weight, arm fat area, arm muscle area and handgrip strength among 376 pulmonary tuberculosis patients at 2 and 5 months by cluster of differentiation 4 (CD4) count groups
(Number of patients, mean values and 95 % confidence intervals)

* Difference assessed using the unpaired t test.
† Test for interaction between energy–protein supplementation and CD4 count groups.
‡ Difference computed as the mean increase from baseline to follow-up.
§ Difference computed as the mean change in energy–protein minus the control group.
Proportions of patients with adequate compliance did not differ between the period when supplements were taken in clinics compared with when they were taken mainly at home (90·6 v. 87·4 %; P = 0·47). Similarly, in both periods, the proportions of patients with adequate compliance did not differ between the study arms (P = 0·34 and P = 0·66, respectively). Furthermore, the effect of the intervention on weight at 2 months was not modified by compliance (P interaction = 0·52). There was no confounding or effect modification by sex and mode of supplementation.
Discussion
The present study was based on the results of our earlier two-by-two factorial trial in which PTB+ patients were randomised to either multi-micronutrients (excluding Zn) or placebo, and independently to Zn or placebo, to be taken daily alongside TB treatment for 8 months(Reference Range, Changalucha and Krarup12). In this earlier trial, we found that by the end of the 7th month of supplementation, there was an interaction between Zn and other micronutrients, in that patients receiving both Zn and other micronutrients had an additional weight gain of 2·4 kg, and among those who were HIV-co-infected, there was a 70 % reduction in mortality. Based on these results, we wanted to test whether supplementation with energy–protein in addition to micronutrients further improves weight and handgrip strength among PTB+ HIV-co-infected patients, and how it affected arm muscle or fat area.
In the present trial, we found no overall effects of the experimental intervention on weight and body composition, but an additional 1·3 kg increase in handgrip strength at 5 months, although this was only marginally significant. This finding is similar to that in the study in Singapore(Reference Paton, Chua and Earnest24). In the Singaporean study, investigators tested the effect of high-energy (including protein) supplementation v. dietary advice on weight and grip strength among TB patients for 6 weeks. They found that at 6 weeks, the intervention led to a considerable increase in grip strength. However, in contrast to our findings, the increase was associated with an increase in lean mass and was not sustained at 6 months. These discrepancies between the two studies may probably be explained by differences in study populations and designs. For example, the Singaporean study did not include HIV+ patients, whereas all the present study participants were HIV-infected. Handgrip strength is a proxy measure of work capacity and therefore its increase among TB patients is important, because it may lead to improved ability to produce or procure foods, and hence patients may be able to better care their families.
Regarding the lack of overall effects, we see five possible explanations. First, compliance with respect to the supplement may have been inadequate, in that patients in the experimental arm may have not taken all the five additional biscuits or the biscuits may have replaced rather than supplemented the usual diet with 50 % of the requirements for a healthy individual. Although our data suggest that compliance was very high; this explanation cannot be ruled out considering that most of the patients took the supplements at home and thus their compliance was reported rather than observed. Second, the present trial was not blinded, and thus data collectors knew which patients were receiving the experimental intervention, which may have resulted in information bias. However, this is unlikely since such a bias would more probably have caused beneficial effects, rather than eliminated a true effect. Third, the amount of protein and micronutrients provided per day or the duration of supplementation may have been inadequate to support the accrual of new tissues. Since both TB and HIV infections are catabolic processes(Reference Paton, Castello-Branco and Jennings11, Reference Kotler, Wang and Pierson25, Reference Macallan, McNurlan and Milne26), the repletion of lean mass may require higher amounts of protein and other nutrients to compensate for the impairment in anabolism which is associated with infection(Reference Paton, Ng and Chee27–Reference Williams, Bartsch and Muurahainen29). Furthermore, the amount of Zn and other type II nutrients such as P and K provided may have been inadequate to meet the demands for additional lean tissue synthesis posed by additional intake of energy–protein. This is plausible considering that Zn is essential in cell division and protein synthesis(Reference Golden and Golden30) and both P and K are important in anabolism(Reference Golden, Hernandez and Argente31). Fourth, the supplement may have increased physical activity and hence energy requirements, rather than leading to increased weight gain. Although this is likely, as reflected in the marginally significant increase in handgrip strength, we cannot ascertain it since we did not have the means to assess energy balance. Fifth, inadequate disease treatment may have led to low supplement intake and/or increased energy expenditure. With respect to TB treatment, this is unlikely to explain the lack of effect since as reported, under the NTLP, the cure rate is high, prevalence of multi-drug resistance TB is low and the proportion of patients who might have atypical mycobacterial infection, i.e. those with CD4 counts < 50 cells/μl(Reference Aviram, Fishman and Boiselle32), was about 3 %. However, with regard to HIV treatment, the proportion of patients who were on ART was lower than expected at baseline and throughout the follow-up period. For example, at baseline, about 40 % of all patients had CD4 counts of < 200 cells/μl and expected to be on ART, but only 13 % were receiving antiretroviral drugs. Thus, it is likely that inadequate HIV management may have contributed to the lack of effect of the intervention probably due to recurrent opportunistic infections.
Among the subgroups defined by CD4 count level, we found the seemingly beneficial effect on weight at 2 months among patients with higher CD4 counts and on handgrip strength among those with lower CD4 counts at 5 months. The differences in intervention effects at 2 months may probably be explained by a tendency to have a better nutrient intake and metabolism among those with higher CD4 counts compared with the general HIV-infected PTB+ population and vice versa among those with lower CD4 counts. Similarly, among the subgroups defined by ART use, we found that the intervention tended to have a beneficial effect on handgrip strength among patients who were on ART at 5 months. This may suggest that among PTB+ HIV-infected patients, irrespective of CD4 counts, ART may enhance the increase in mass muscle and/or muscle function, which are the major determinants of handgrip strength, probably because ART may prevent against recurrent opportunistic infections, the main cause of weight and possibly functional loss among HIV-infected patients(Reference Macallan, Noble and Baldwin33). In fact, the beneficial effect of the intervention on handgrip strength at 5 months among patients who had CD4 counts < 350 cells/μl at baseline may be explained by the fact that at this time, 40 % of these patients were receiving ART compared with only 18 % among those with CD4 count ≥ 350 cells/μl.
At the end of 5 months, patients in both arms had gained considerable weight, although this was only about 60 % of 7–10 kg of the deficits found at the beginning of TB treatment(Reference PrayGod, Range and Faurholt-Jepsen22, Reference Range, Malenganisho and Temu34). Although deficit in weight at the beginning of treatment is due to many factors including pre-TB underweight and HIV infection, most of the deficit is due to active TB(Reference PrayGod, Range and Faurholt-Jepsen22). Therefore, nutritional support against a background of TB treatment should ensure regaining of nearly all the deficit by the time treatment is completed. The suboptimal weight recovery, even among the sub-group in which the experimental intervention seemed to be beneficial, may imply that the nutritional support offered may have been inadequate in composition, duration or timing.
The strength of the present trial is that it was randomised, and that the overall loss to follow-up was modest. Although the planned sample size was not achieved due to slow recruitment pace, the study was large enough to detect clinically important differences with high power. In addition, our outcome measures included a functional outcome, i.e. handgrip strength, which is an important marker of health status including survival(Reference Cooper, Kuh and Hardy35). However, we only used proxies in assessing body composition and did not have markers of energy intake or expenditure and in most of our patients, compliance was assessed using reported information. Future studies should use better methods and include mechanistic sub-studies in order to be able to fully explain the findings.
Conclusions
Among PTB+ HIV-co-infected patients, energy–protein supplementation against a background of high multi-micronutrient intake had no overall effect on weight and body composition, but had a marginally significant effect on handgrip strength at 5 months. More studies are needed to develop a macronutrient supplement for TB patients co-infected with HIV, with effects on lean mass, functional outcomes and survival, before it can be recommended to TB programmes.
Acknowledgements
The present study was supported by the Danish Council for Independent Research – Medical Sciences (grant no. 22-04-0404) by Danida through the Consultative Research Committee for Development Research (104.Dan.8-898) and the University of Copenhagen through the Cluster in International Health. The funding bodies had no role in the study design, data collection, data analysis, data interpretation or decision to publish the findings. H. F., N. R., J. C. and A. B. A. conceived the study. G. P. and K. J. coordinated the implementation of the study, and G. P. analysed the data and wrote the first draft of the manuscript. All authors contributed to the data collection and interpretation of the results and commented on the drafts and approved the final version. All authors reported no conflicts of interests. The authors would also like to thank all the health facility staff as well as all study participants who were involved in the study.


