Article Text

Abstract
Objective Since most biomedical research focuses on a specific disease, evaluation of research output requires disease-specific bibliometric indicators. Currently used methods are insufficient. The aim of this study is to develop a method that enables detailed analysis of worldwide biomedical research output by disease.
Design We applied text mining techniques and analysis of author keywords to link publications to disease groups. Fractional counting was used to quantify disease-specific biomedical research output of an institution or country. We calculated global market shares of research output as a relative measure of publication volume. We defined ‘top publications’ as the top 10% most cited publications per disease group worldwide. We used the percentage of publications from an institution or country that were top publications as an indicator of research quality.
Results We were able to classify 54% of all 6.5 million biomedical publications in our database (based on Web of Science) to a disease group. We could classify 78% of these publications to a specific institution. We show that between 2000 and 2012,‘other infectious diseases’ were the largest disease group with 337 485 publications. Lifestyle diseases, cancers and mental disorders have grown most in research output. The USA was responsible for the largest number of top 10% most cited publications per disease group, with a global share of 45%. Iran (+3500%) and China (+700%) have grown most in research volume.
Conclusions The proposed method provides a tool to assess biomedical research output in new ways. It can be used for evaluation of historical research performance, to support decision-making in management of research portfolios, and to allocate research funding. Furthermore, using this method to link disease-specific research output to burden of disease can contribute to a better understanding of the societal impact of biomedical research.
- health economics
This is an Open Access article distributed in accordance with the Creative Commons Attribution Non Commercial (CC BY-NC 4.0) license, which permits others to distribute, remix, adapt, build upon this work non-commercially, and license their derivative works on different terms, provided the original work is properly cited and the use is non-commercial. See: http://creativecommons.org/licenses/by-nc/4.0/
Statistics from Altmetric.com
Strengths and limitations of this study
The proposed method offers quantitative insight in research quantity and quality for 269 disease groups.
The proposed method can be used for evaluation of historical research performance at disease level. It can support decision-making in management of research portfolios, showing relative strengths and weaknesses of institutions and countries, as well as identifying research gaps at national and global levels. It can also be valuable in allocation of research funding.
Author keywords were used instead of the standardised Medical Subject Headings descriptors, which are not available in the Web of Science database.
Research about, for instance, molecular mechanisms, medical techniques and health sciences could often not be classified to a specific disease group and was thus not included in our results.
Introduction
One of the goals of biomedical research is to eradicate burden of disease. The grand societal challenges in European funding also build on the premise that (biomedical) research should contribute to prevention and treatment of diseases.1
Yet surprisingly, biomedical research output has not been systematically catalogued by diseases so far.2 Most publicly available metrics for analysing biomedical research by topic have severe limitations. Research fields in the Web of Science (WoS) database produced by Clarivate Analytics are defined at a too high level, since they cover a complete medical specialism.3 The Scopus database produced by Elsevier has the same problem. Medical Subject Headings (MeSH) terms4 are more specific, but are available only for a selection of journals.
Several authors have made efforts to analyse research output and funding at disease level, but only for a selection of diseases. Evans et al compared research output between countries for 19 disease groups, based on the International Classification of Disease, Ninth Revision (ICD-9) chapters.5 Gillum et al 6 and Gross et al 7 analysed burden of disease and research funding for a selection of 29 conditions, derived from the ICD. In various other studies funding, research output and burden of disease were described for specific diseases in a case by case approach. This was done, for example, for yellow fever8 and neglected tropical diseases.9 In other studies, total biomedical research output was analysed for specific countries10 11 or compared between countries.12 13
Text mining techniques are increasingly applied to biomedical text to uncover unseen relationships.14 In this study, we use these techniques to create a reference structure of disease groups and to catalogue publications accordingly. This opens a bridge between biomedical research output and other information available at disease level, which can contribute to a better understanding of the societal impact of biomedical science.
Methods
Selection of biomedical publications
The analysis was based on the Clarivate Analytics WoS database available at the Centre for Science and Technology Studies (CWTS) of Leiden University. Since the goal of this study is to quantify research output by disease, we included biomedical research fields only. Of the 250 WoS research fields, we selected the 84 fields that are most medically oriented. We validated the selection by looking at the research output of the eight Dutch university medical centres: over 98% of their publications were in one of these fields. Online supplementary appendix 1 provides a full list of research fields included in this study. The dataset was compiled in June 2014. It includes all publications in the 84 selected research fields, published between 2000 and early 2014, with WoS document type ‘article’ or ‘review’. Not all publications from the first 6 months of 2014 were available, due to periodical updating of the CWTS in-house version of the WoS database. The dataset contained 6.5 million publications in total.
Supplementary file 1
Classification of publications by disease group
We defined 269 disease groups, based on the ICD-10 classification and covering the full spectrum of this classification. We used a two-step approach to categorise publications to disease groups.
First, we categorised the author keywords listed by authors in their publications. In total, 158 700 unique author keywords were used in at least 10 publications in our dataset. Of these keywords, the 32 400 most frequently used keywords (used in more than 70 publications each) were short listed and further evaluated. Twenty-one per cent of these keywords were specific for a single-disease group. For example, the keyword ‘Alzheimer’s disease’ was linked to ‘dementia’. Many keywords were not suitable to use for categorisation to disease groups because they were either too general or not disease-specific. Examples of keywords not linked to a disease group are ‘inflammation’ and ‘keyhole surgery’. We note that not all publications include author keywords.
In the second step, a text mining algorithm was used to search for disease-specific terms in titles and abstracts of publications. In this step, first a list of 10 983 unambiguous, disease-specific terms was generated by hand by medical professionals to characterise specific disease groups. Examples of terms for the disease group ‘malignant neoplasm prostate’ include ‘prostate cancer’, ‘prostate carcinoma’, ‘malignant tumour prostate’ and ‘sarcoma prostate’. The generated disease-specific terms were then reviewed by another medical professional for ambiguity. Subsequently, publications with 1 of these 10 983 terms in either title or abstract were assigned to the corresponding disease group. If the same publication was assigned to multiple disease groups, it was fully counted for all of them.
The method was validated in several ways. The first step was a manual examination of a random sample of 680 publications assigned to a disease group. Subsequently, a random sample of 315 publications not assigned to a disease group was manually examined. The examination was executed by research professionals among whom research coordinators and a clinical librarian of the Dutch university medical centres. The percentage of publications that could be assigned to a disease group was compared between WoS research fields. In addition, several institutional profiles resulting from the classification of research output to disease groups were discussed with researchers and deans from those institutions.
Classification of publications by institution and country
The name of an institution is often reported in many different ways in publications. Some authors, for example, report an abbreviated name while others report the full name, and some authors report the name of the university with which a hospital is associated while other authors report only the name of the hospital itself. These inconsistencies are problematic when analysing the research output of institutions. We addressed this problem by relying on the categorisation of affiliations used in the CWTS Leiden Ranking 2014.15 In this way, we could compare the research output of the 750 largest universities worldwide (based on number of publications in WoS), of 1099 hospitals, and of 46 public research organisations. Publications from all affiliations, also those not included in the selected institutions, were included when comparing research output between countries.
Publications were assigned fractionally to institutions and countries. This was done based on the number of addresses in the address list of a publication in which a certain institution or country is mentioned. For instance, if a publication includes five addresses and two of these addresses mention Leiden University (eg, two different departments within Leiden University), the publication is assigned to Leiden University with a weight of 2/5 = 0.4. So the publication is not counted as a full publication for Leiden University but as 40% of a full publication. This methodology is known as address-level fractional counting.16
Indicators of quantity and quality of research
We used several indicators of quantity and quality of biomedical research per disease group to provide quantitative insight in the research strengths of specific institutions and countries. Quantity was measured by the fractionally counted volume of publications of an institution or country. Citations are often seen as an indicator of scientific impact, or somewhat less precisely, as an indicator of quality. Since research fields differ in citation practices, comparison of citation counts between fields is difficult. Likewise, comparison of citation counts between older and more recent publications is problematic, because older publications have had more time to accumulate citations. To overcome this, we identified for each combination of a disease group and a publication year the 10% most cited publications globally. We used the volume of these ‘top publications’ as an indicator of quality of output when comparing countries or institutions. Only publications that appeared between 2000 and 2012 were used to identify ‘top publications’, since publications after 2012 were too recent for the calculation of meaningful citation statistics in 2014. Self-citations, that is, citations given by an author to his or her own work, were excluded. For the comparison of research portfolios between countries, between institutions and over time, we used an institution’s (or country’s) share in the global publication volume per disease group as an indicator of the total volume (quantity). Additionally, we used the share of top publications in the total output of an institution (or country) as a size-independent indicator for quality. This relative measure enables a comparison of research output for different disease groups within the research portfolio of an institution (or country).
Patient and public involvement
No patients or public were involved in our study.
Results
This section first describes the results of the validation of our method. Second, results for several applications of the method are described.
Validation of the proposed method
We were able to relate 54% of all publications in the selected 84 research fields to a disease group, 3.2 million publications in total. Of all publications, 29% were assigned to a single-disease group, 14% to two disease groups and 11% to three or more disease groups. Fields of research with a large share of disease-specific publications were mainly clinical research fields. Over 80% of all publications in research fields, such as allergology, rheumatology and clinical neurology, were linked to a disease group. Research fields like ethics, microscopy and biophysics had a much lower percentage of disease-specific publications (10%, 17% and 27%, respectively). In these fields, we indeed would not expect a large share of the publications to be linked to a disease group, so the low percentages confirm that our method behaves as expected. We refer to online supplementary appendix 1 for an overview of the share of disease-specific publications per research field.
Between 2000 and 2012, the annual volume of publications within the included research fields increased by 64%. In the same period, the volume of disease-specific publications increased by 92%. This means that disease-specific publications grew in share: from 48% in 2000 to 57% of total volume in 2012. After manual verification, we found that 2% of the sample of disease-specific publications (n=680) were incorrectly assigned to a disease group, and 1% of the sample of uncategorised publications (n=315) were incorrectly not assigned to a disease group, both indicating the method to be accurate. Incorrect links were mainly due to sentences such as ‘patients with diabetes were excluded’ in the abstracts of publications.
About 1900 institutions were analysed in this study. Together these institutions accounted for 69% of the address lines in disease-specific publications worldwide. Seventy-eight per cent of the disease-specific publications had at least one author from one of these institutions.
As expected, we found strong differences in the share of disease-specific publications between different types of research institutions in the Netherlands. We verified institution-specific results with researchers and deans of five top ranking institutions in the Netherlands and abroad. In all cases, the disease-specific research output was in line with their expectations about their own institution’s position in relation to other institutions worldwide.
Application 1: biomedical research output by disease group
Using our method, we can compare the research output between disease groups. The number of publications in the period 2000–2012 varies widely between disease groups, as shown in figure 1. ‘Other infectious diseases (not including HIV and tuberculosis)’ were the disease group with most publications. ‘Diabetes mellitus’, ‘metabolic diseases’ and ‘mood disorders’ were also large. The number of publications on malignant neoplasms was just a little bigger than the total publication volume on heart diseases.

Research output per disease group. (Total volume of publications per disease group between 2000 and 2012). Source: Gupta Strategists, CWTS, analysis based on Web of Science. CWTS, Centre for Science and Technology Studies.
Interestingly, the worldwide research profile by disease is not constant over time. Some disease groups have seen a rapid growth in research output, while other disease groups have grown only mildly in research output, as shown in figure 2. Lifestyle diseases (obesity and diabetes), cancers (lung, prostate, colon and breast) and mental disorders (depression and other mental disorders) gained in share in the worldwide research portfolio. On the other hand, diseases such as anaemia, pain in chest and throat, leukaemia, and HIV show a decreasing share in the total research portfolio, although the research output has still grown in absolute volume.
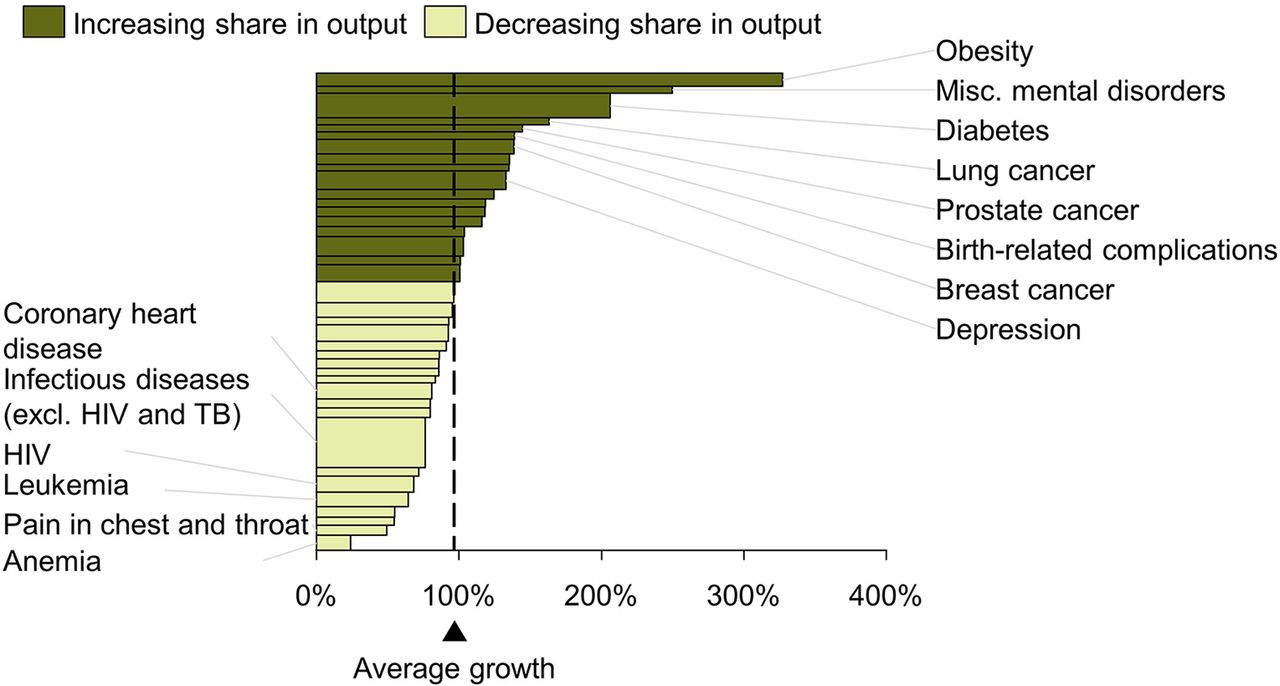
Growth in disease-specific research output by disease group. (Growth in number of publications between 2000 and 2012, width represents total number of publications. Only the 40 disease groups with the most publications in 2012 are shown). The 40 disease groups with most publications in 2012 are shown here. Source: Gupta Strategists, CWTS, analysis based on Web of Science. CWTS, Centre for Science and Technology Studies; TB, tuberculosis.
Application 2: biomedical research output by disease by country
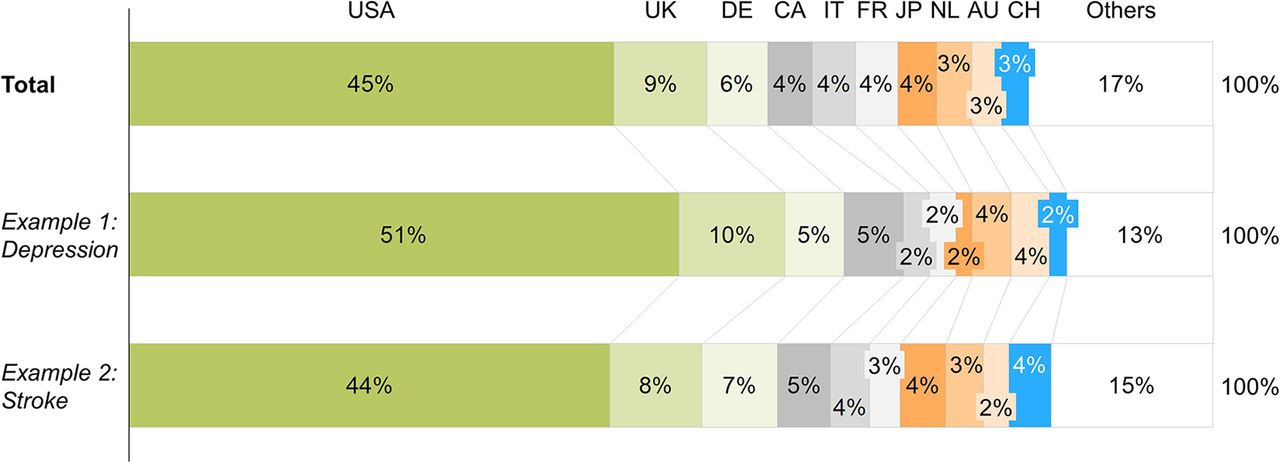
The most cited disease-specific research publications originate from a small set of countries. Figure 3 shows the relative share of countries in the 10% most cited publications per disease group. The top 10 countries with the largest share in top 10% most cited research output account for 83% of the total body of disease-specific publications worldwide. Notably, the USA accounts for 45% of the top 10% most cited publications. There are however differences in research profiles between countries. For instance, Canada has equal shares in top publications on ‘depression’ and ‘stroke’, while China has two times as many top publications on ‘stroke’ compared with ‘depression’.

Distribution of top publications by country. (Share in 10% most cited publications within each disease category, 2000–2012). Source: Gupta Strategists, CWTS, analysis based on Web of Science. AU, Australia; CA, Canada; CH, China; FR, France; GE, Germany; IT, Italy; JP, Japan; NL, Netherlands; CTWS, Centre for Science and Technology Studies.
It is possible to evaluate the development over time of each country’s share in publication volume for a specific disease. Figure 4 shows the growth in number of breast cancer publications by country between 2000 and 2012. Although the number of publications of every country has grown during this period, some countries have grown faster than others. Most Western countries have grown slower than the world average. Countries that have grown faster than average are mainly developing economies, with China showing 700% growth. Notably, Iran experienced a remarkable 3500% growth in research output, but its total volume of disease-specific publications remains small.

Growth in research output of breast cancer for the 30 largest countries. (Growth in number of publications between 2000 and 2012, width represents total number of publications). Several of those countries were too small to get a text label in the graphic. Source: Gupta Strategists, CWTS, analysis based on Web of Science. CTWS, Centre for Science and Technology Studies; BRIC, Brazil, Russia, India and China.
Application 3: research output by disease on an institution level
Our method allows for identification of institutions with a remarkable position in research on a specific disease group. We use multiple sclerosis (MS) as an example, but figure 5 can easily be constructed for all 269 disease groups used in this study. The figure shows for all institutions their volume of MS publications and their respective share in the top 10% most cited publications about MS worldwide. Harvard’s unique position in MS research is illustrated by the facts that Harvard had the largest share in the total MS publication volume and that one in four of its publications was in the top 10% most cited publications about MS. Other centres with remarkable quantity and quality of MS research were University College London and VU University Amsterdam. A display like figure 5 recognises institutions that have a high quality without a high production.

Scientific output of MS by institution. (y-axis: share of institute’s output in total output, x-axis: % of publications in 10% most cited, 2000–2012. Only institutions with at least 20 publications about MS in study period were shown). Only instructions with at least 20 publications about MS between 2000 and 2012 are shown in figure. Source: Gupta Strategists, CWTS, analysis based on Web of Science. CTWS, Centre for Science and Technology Studies; MS, multiple sclerosis.
Using our method, it is possible to follow the research output of individual institutions for specific disease groups over time. As an example, figure 6 shows the rise of South African research output on HIV. Between 2000 and 2004, the annual South African research output on HIV is relatively constant, but from 2005 onwards, several South African universities have grown rapidly, passing several famous HIV research institutions in volume. This growth seems partly due to growth of international collaboration. For instance, 10% of all South African publications on HIV were coauthored with Harvard University in 2012, while this was only 2% in 2005. During this time, internationally renowned Harvard scientists such as Bruce Walker and Till Bärnighausen have started working part time for the University of Kwazulu-Natal.

HIV publication volume over time per university for selected universities. (y-axis: fractioned volume of peer-reviewed publications about HIV, x-axis: year). Source: Gupta Strategists, CWTS, analysis based on Web of Science. CTWS, Centre for Science and Technology Studies.
In addition to comparing institutions for a specific disease, our method also allows us to map research portfolios of countries or institutions by disease, based on volume and top 10% publications. Using these portfolio maps, we can now compare complete disease-specific research portfolios between institutions. As an example, we plotted portfolio maps of four universities in figure 7. Substantial differences in their profiles can easily be seen. Harvard University has much larger publication volumes than the three others. Imperial College has a large number of disease groups with at least 30% of their publications counting as top publications. Both University of Amsterdam and Karolinska Institute have a remarkable position in research on malignant oesophageal neoplasms, whereas Imperial College does not.

Examples of institution research profiles. (y-axis: institutions share in global publication volume on disease group, x-axis: % of institutions publications that is in the global top 10% most cited, balls represent disease groups). HU, Harvard University; IC, Imperial College; KI, Karolinska Institute; UvA, University of Amsterdam.
Discussion
Our proposed method allows for systematic classification of publications in WoS to disease groups. We were able to classify 54% of all 6.5 million biomedical publications in the WoS database to a disease group. Between 2000 and 2012, ‘other infectious diseases’ were the largest disease group with 337 485 publications. In this period, lifestyle diseases, cancers and mental disorders have grown most in research output. On a country level, the USA was responsible for the largest number of top 10% most cited publications per disease group, with a global share of 45%. Iran (+3500%) and China (+700%) have grown most in research volume. On an institution level, we were able to relate 78% of biomedical publications to a specific institution. Below we describe some examples of potential use and then discuss possibilities for future research.
Potential value of the proposed method
The method can be used for evaluation of historical research performance at the level of specific diseases. It can support decision-making in management of research portfolios, showing relative strengths and weaknesses of institutions and countries. Combining these insights with indicators of innovation and research productivity17 can illustrate whether research performance is aligned with successful transfer of scientific knowledge to clinical practice.
Linking the disease-specific research output to burden of disease provides insights in ‘ white spots’ in global and regional research.18 These insights can support fact-based allocation of research funding, making it possible to better align research portfolios to local or global needs and to adjust portfolios to changes of those needs over time. This can be the starting point for further understanding of what drives research output other than burden of disease, for instance, economic strengths, political structures, research legacy, etc. Quantitatively unravelling the different drivers that determine disease-specific publication volume could provide insights in how we can realign research efforts across countries to have greater impact on reduction of disease burden.
Opportunities for additional research
Using disease groups based on the ICD-10 classification has the advantage of being exhaustive: all diseases can be included. When looking for research on a rare disease, the used classification system is not specific enough. However, our method can be adapted to answer such specific questions by using specific author keywords and tailor-made text phrases to look for in titles and abstracts. Addition of MeSH descriptors next to author keywords can further complete the method, although this requires the use of other bibliographic databases, since WoS does not include MeSH descriptors. Ultimately, the use of dynamic and customised research categories will make it easier to find the institutions with the strongest positions in research on specific diseases, thus answering portfolio questions in ways that are not possible yet.
Our method classifies each publication to disease nomenclature but does not categorise the nature of disease-specific research. For example, a publication classified to a disease group could describe a new gene involved in the pathogenesis, analyse the societal impact of the disease, or merely state the disease as a potential application for a new surgical technique. Ideally, the method should be supplemented with additional categories that, based on text mining, can identify the type of research and application. Also, clinical trial registers (eg, https://www.clinicaltrialsregister.eu/ or https://clinicaltrials.gov/) can be included. As an example, using a simple algorithm based on MeSH descriptors, it is possible to identify cell-based, animal-based and patient-based research.19
Now that publications are allocated to disease groups, bibliometric indicators of research quantity and quality can be combined with other information available on disease level. For instance, quality of care, patient-reported health outcomes, cost of treatment and patents. This can be valuable in aligning research and healthcare portfolios of university medical centres.
Conclusion
We have shown that it is possible to systematically link research output to disease groups. Our method makes it possible to compare research output by countries or institutions and to monitor changes in biomedical research output over time or by disease. The novelty and value of the method is that it allows a disease-specific analysis, for instance, making it possible to compare research output with burden of disease. Since the major goal of biomedical research is alleviation of disease burden, our method allows for evaluating current strengths and shortcomings.
Acknowledgments
The authors would like to thank the research coordinators and deans of the Dutch university medical centres for their contribution to the validation of this research method, the group of medical interns for their assistance in drafting the disease-specific terms, and Professor Marcel Levi for his comments on the method.
References
Footnotes
Contributors LvdL and NH made the definitions of disease groups, categorised the author keywords and made the disease-specific keywords. TdK, NH and LvdL performed the analysis. LvdL wrote the manuscript together with NH and TdK. NH and LvdL validated the results with researchers and deans. LW implemented the text mining algorithm, assigned the publications to disease groups and calculated the bibliometric statistics. The Centre for Science and Technology Studies (CWTS) at Leiden University provided the cleaned address data for the universities, hospitals and public research organisations included in the study. IM, LW and AG provided feedback on the manuscript.
Funding The authors have not declared a specific grant for this research from any funding agency in the public, commercial or not-for-profit sectors.
Competing interests None declared.
Patient consent Not required.
Provenance and peer review Not commissioned; externally peer reviewed.
Data sharing statement Technical appendix can be provided. The appendix includes a definition of biomedical research by WoS research fields.