Article Text

Abstract
Objectives The objective of the study was to examine diagnosis-specific sickness absences of different lengths as predictors of disability retirement in different occupational classes.
Design Register-based prospective cohort study up to 8 years of follow-up.
Participants A 70% random sample of the non-retired Finnish population aged 25–62 at the end of 2006 was included (n=1 727 644) and linked to data on sickness absences in 2005 and data on disability retirement in 2007–2014.
Main outcome measures Cox proportional hazards regression was utilised to analyse the association of sickness absence with the risk of all-cause disability retirement during an 8-year follow-up.
Results The risk of disability retirement increased with increasing lengths of sickness absence in all occupational classes. A long sickness absence was a particularly strong predictor of disability retirement in upper non-manual employees as among those with over 180 sickness absence days the HR was 9.19 (95% CI 7.40 to 11.40), but in manual employees the HR was 3.51 (95% CI 3.23 to 3.81) in men. Among women, the corresponding HRs were 7.26 (95% CI 6.16 to 8.57) and 3.94 (95% CI 3.60 to 4.30), respectively. Adjusting for the diagnosis of sickness absence partly attenuated the association between the length of sickness absence and the risk of disability retirement in all employed groups.
Conclusions A long sickness absence is a strong predictor of disability retirement in all occupational classes. Preventing the accumulation of sickness absence days and designing more efficient policies for different occupational classes may be crucial to reduce the number of transitions to early retirement due to disability.
- social medicine
- public health
This is an Open Access article distributed in accordance with the Creative Commons Attribution Non Commercial (CC BY-NC 4.0) license, which permits others to distribute, remix, adapt, build upon this work non-commercially, and license their derivative works on different terms, provided the original work is properly cited and the use is non-commercial. See: http://creativecommons.org/licenses/by-nc/4.0/
Statistics from Altmetric.com
Strengths and limitations of this study
A strength of this study was the 8-year prospective and population-based cohort design, based on a 70% register sample of the total Finnish non-retired working-age population.
Data were obtained from national registers, constituting highly reliable sources with objective register-based measures, no self-report bias, practically no loss to follow-up and very little missing information.
We were able to utilise date-specific information on both sickness absence and disability retirement.
A limitation to this study was the lack of information on, for example, health status, health behaviours or work environment that could explain or mediate the observed associations.
Due to the observational nature of the data, causal effects cannot be established.
Introduction
Large numbers of employees leave the labour market early due to health problems.1 In particular, those in disadvantaged social positions have an increased risk of problems with health and work ability.2–7 Both inequalities in health and a loss of workforce due to health problems cause substantial costs for societies.1 8 To extend working lives, which has become an important target in many OECD countries,9 identifying those with an increased risk of work disability is crucial.
Previous studies have discovered several sociodemographic, work-environmental and health-related predictors of work disability.10–13 One of the strongest early markers of disability retirement is sickness absence (SA).14 The risk of disability retirement has been shown to depend on both the duration and the diagnosis of SA. In particular, long-term SA4 5 and SA due to musculoskeletal diseases15; mental and behavioural disorders16; and diseases of the nervous, respiratory and circulatory systems5 indicate a high risk of disability retirement.
However, to our knowledge, there are no studies focusing on whether this association varies by occupational class. There are large occupational class differences in both SAs of various lengths17 18 and the risk of disability retirement,19–22 but no studies have been conducted on whether the length of SA predicts disability retirement differently in different occupational classes. The differences between occupational classes are substantial in SA due to musculoskeletal diseases, but they are smaller in SA due to mental and behavioural disorders.23 24 The varying diagnostic profiles of the occupational classes may confound the association between the length of SA and the risk of disability retirement. This emphasises the need to consider both the length and diagnosis of SA when occupational class differences in the risk of disability retirement are examined.
Thus, to fill the gap in previous research, the aim of this study was to examine diagnosis-specific SAs of different lengths as predictors of disability retirement in different occupational classes. We examined, first, how the length of all-cause SA predicts disability retirement in different occupational classes. Second, the diagnosis of SA was treated as an effect modifier in order to study how the length of SA due to musculoskeletal diseases, mental and behavioural disorders or other diagnoses predicts disability retirement in different occupational classes. Third, we treated the diagnosis as a confounder and studied whether the differences in the diagnoses of SAs explain the occupational class differences in the association between the length of SA and disability retirement.
Methods
Study population
Our data were drawn from several linked registers of the Social Insurance Institution of Finland (Kela), the Finnish Centre for Pensions and Statistic Finland. A 70% random sample of the non-retired Finnish population aged 25–62 years at the end of 2006 was retrieved from the population data file of Kela (n=1 727 644). Data on sociodemographic characteristics in 2006, new medically certified SA episodes >10 working days starting in 2005 and new disability pensions from 2007 to 2014 were linked using the participants’ personal identification numbers.
Measurement of disability retirement
Data on disability retirement were retrieved from the registers of the Finnish Centre for Pensions (earnings-related pensions) and Kela (basic level national pensions). In Finland, the disability retirement system covers all permanent residents. Disability pensions can be granted to persons aged 18–62 (earnings-related scheme) or 16–64 (national pension scheme), if their work disability is medically assessed to be long term (at least 1 year) or permanent. Transferring to full-time or part-time disability pensions between 1 January 2007 and 31 December 2014 was analysed in this study.
Measurement of sickness absence
SA was measured through sickness allowance, derived from the register of Kela. In Finland, sickness allowance is paid to compensate for short term by work incapacity lasting up to approximately 1 year, after which a disability pension can be granted. Sickness allowance may be paid after a waiting period of 10 consecutive working days of work incapacity (Sundays and midweek holidays are not counted as working days). A sickness certificate from a physician is required. All new registered sickness allowance spells that started during the time period 1 January 2005 to 31 December 2005 were included, and each spell was followed until its end. All, including possible multiple spells, were totalled per diagnostic category (see below) per person. Since disability retirement is usually followed by 1 year of SA, we started the follow-up at 1 January 2007.
The diagnostic groups were chosen based on statistics of the two most prevalent diagnostic causes of SA in 2005.25 Three diagnostic groups for SAs were used: musculoskeletal diseases (M00–M99), mental and behavioural disorders (F00–F99) and other diagnoses (the rest of the diagnostic groups). The length of SA was calculated as the total number of days in each diagnostic group, and they were categorised as follows: 0, 1–30, 31–60, 61–180 and over 180 days, per diagnostic group (table 1).
Distributions of the study population in 2006 (n=1 727 644), prevalence and length of SA beginning in 2005 and proportion of participants experiencing a DR in 2007–2014
Measurement of occupational class
Information on occupational class at the end of 2006 was drawn from the register of Statistic Finland26 and categorised into five classes: upper non-manual employees, lower non-manual employees, manual workers, self-employed (including self-employed and owners of companies with salaried employees) and those classified as being outside employment. The latter group included long-term unemployed persons (58.1%), students (20.1%) and missing or unknown (21.8%). Pensioners in 2006 were excluded from this study at the baseline because the study focused on new disability retirements from January 2007 onwards.
Other covariates
Information on gender, age, marital status and level of urbanisation at the end of 2006 was drawn from the registers of Kela. The analyses were performed separately for men and women, as there are known gender differences in patterns of both SA and disability retirement.24 27 28 Age was categorised into four groups in 10-year intervals. Marital status was categorised into three groups: never married, married and ‘other’, which included those who were divorced or widowed and those with missing information. The level of urbanisation was categorised into urban, densely populated and rural according to classifications of Statistic Finland.29 The distributions of the covariates are shown in table 1.
Statistical methods
Each individual in the study population was followed from 1 January 2007 until the start of a disability pension, the start of another type of pension, age 63 (the first potential old-age retirement age), death or the end of the study period on 31 December 2014. The mean follow-up time was 7 years. Differences in the risk of disability retirement during 2007–2014 by occupational class and length of SA were analysed with Cox proportional hazards regression. All analyses were conducted separately for men and women and were adjusted for age, marital status and level of urbanisation of the home municipality at the end of 2006 (later referred to as sociodemographic variables). The results are presented as HRs with their 95% CIs. The statistical significance of interactions between the length of SA and occupational class was tested by the Wald test by including the length of SA in the interaction model as a five-category variable. The analyses were conducted using the Stata V.14.2 software.
Ethical considerations
The study used secondary data retrieved from registers, and thus no ethics approval was required according to Finnish law. Good scientific practice and data protection regulations were followed in the collection, use and reporting of the data. Kela, the Finnish Centre for Pensions and Statistics Finland, provided permission to use the anonymous register-based data.
Results
Population characteristics
During the 8-year follow-up, a total of 123 736 persons transferred to disability retirement, including 7.0% of men and 7.3% of women (table 1). A higher percentage of women (12.5%) than men (8.9%) had at least one spell of SA that started in 2005. Both the prevalence of SA and the proportion of those experiencing disability retirement were higher among those in lower occupational classes and among those who were of older age, those whose marital status was other than married or never married, and those who lived in rural municipalities. Additionally, the same groups had a higher median number of SA days. In every diagnostic group of SA, the proportion of persons with a new disability retirement was higher among those with longer SAs.
HRs for the risk of disability retirement for different lengths of SA in different occupational classes are shown in figure 1, and the reference group is upper non-manual employees with no new SA spells, starting in 2005. Due to their multiplicative nature and to enable direct visual comparability, the HRs are plotted on a logarithmic scale.30 31 In addition, the online supplementary appendix tables 1 and 2 show the HRs for disability retirement calculated with a separate reference group for each occupational class.
Supplementary file 1
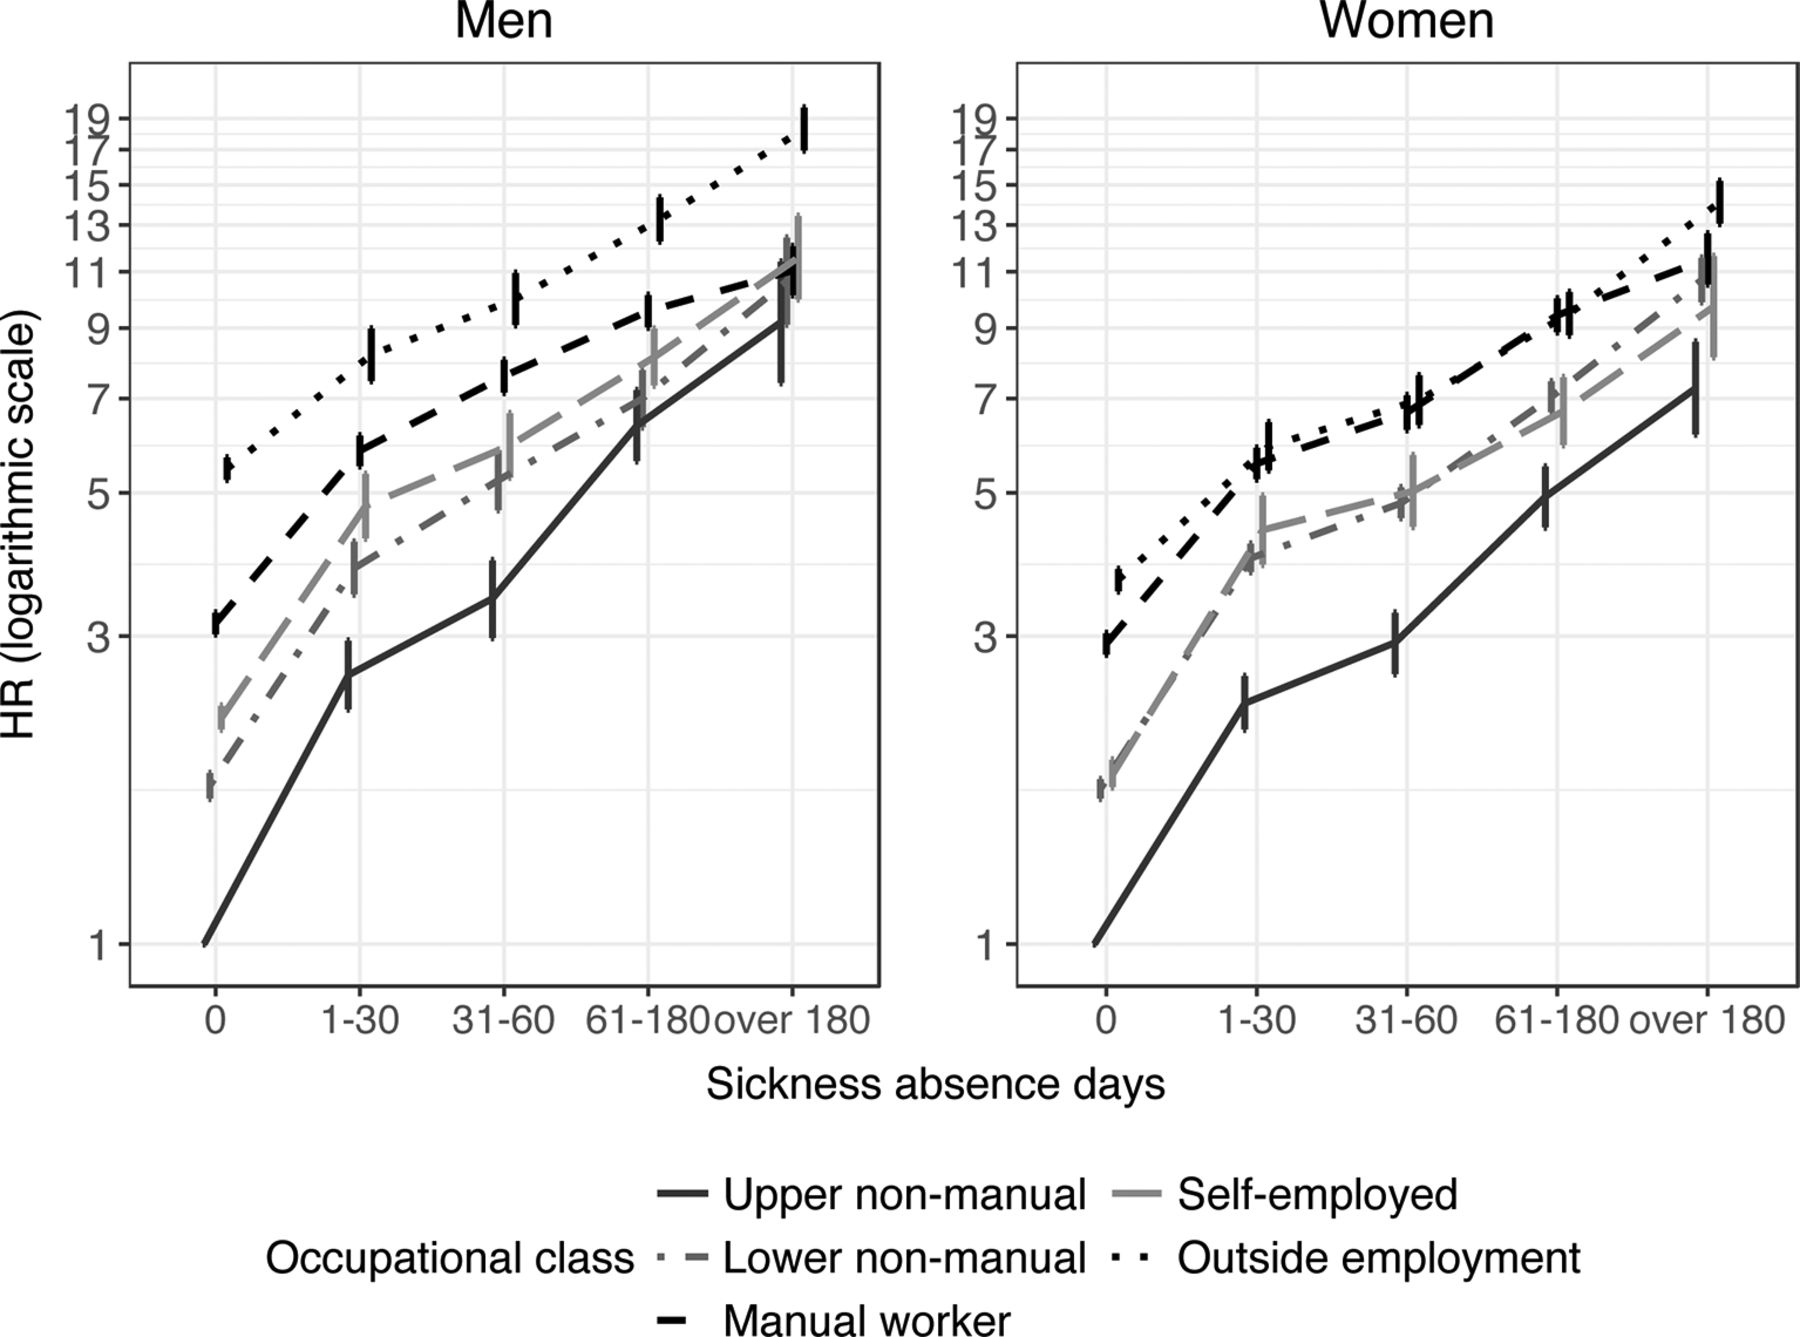
HRs for the risk of all-cause disability retirement in 2007–2014 with their 95% CIs according to the length of all-cause SA in different occupational classes in men and women. Upper non-manual workers with no sickness allowance days is the reference group. HRs on the logarithmic scale. All adjusted for all sociodemographic variables. SA, sickness absence.
In general, the longer the SA is, the higher the risk of all-cause disability retirement is in all occupational classes and in both genders. Upper non-manual employees had the lowest risk of disability retirement in men and women. Among men, those outside employment clearly had the highest risk of disability retirement, while among women the risk was highest for manual workers and those outside employment. Lower non-manual workers and self-employed workers were between these classes. The interaction terms between the occupational class and the length of SA on the risk of disability retirement were statistically significant in both men (p values from the Wald test p<0.001) and in women (p<0.001) when comparing each occupational class separately to upper non-manual employees (online supplementary appendix tables 1 and 2).
Among upper non-manual employees, the risk of disability retirement increased slightly more steeply with increasing length of SA than in other occupational classes (figure 1, online supplementary appendix tables 1 and 2). In upper non-manual men with >180 days of SA, the HR of disability retirement was almost 10-fold (HR 9.19 95% CI 7.40 to 11.40) compared with those with no SA, whereas in manual workers, the same HR was 3.51 (95% CI 3.23 to 3.81) (online supplementary appendix table 1). Among women, the pattern was similar, but the occupational class differences were not as large as in men, with the HR being 7.26 (95% CI 6.16 to 8.57) in upper non-manual employees and 3.94 (95% CI 3.6 to 4.3) in manual workers, accordingly (online supplementary appendix table 2).
Figure 2 shows the HRs for all-cause disability retirement in different diagnostic groups, again calculated with upper non-manual employees without SA as the reference group (see the online supplementary appendix tables 1 and 2 for separate reference groups). In every diagnostic group, the association between the length of SA and the risk of disability retirement was largely similar. However, there was an indication that the association between increasing length of SA and the risk of disability retirement was slightly stronger in SA due to mental and behavioural disorders than in other diagnostic groups.
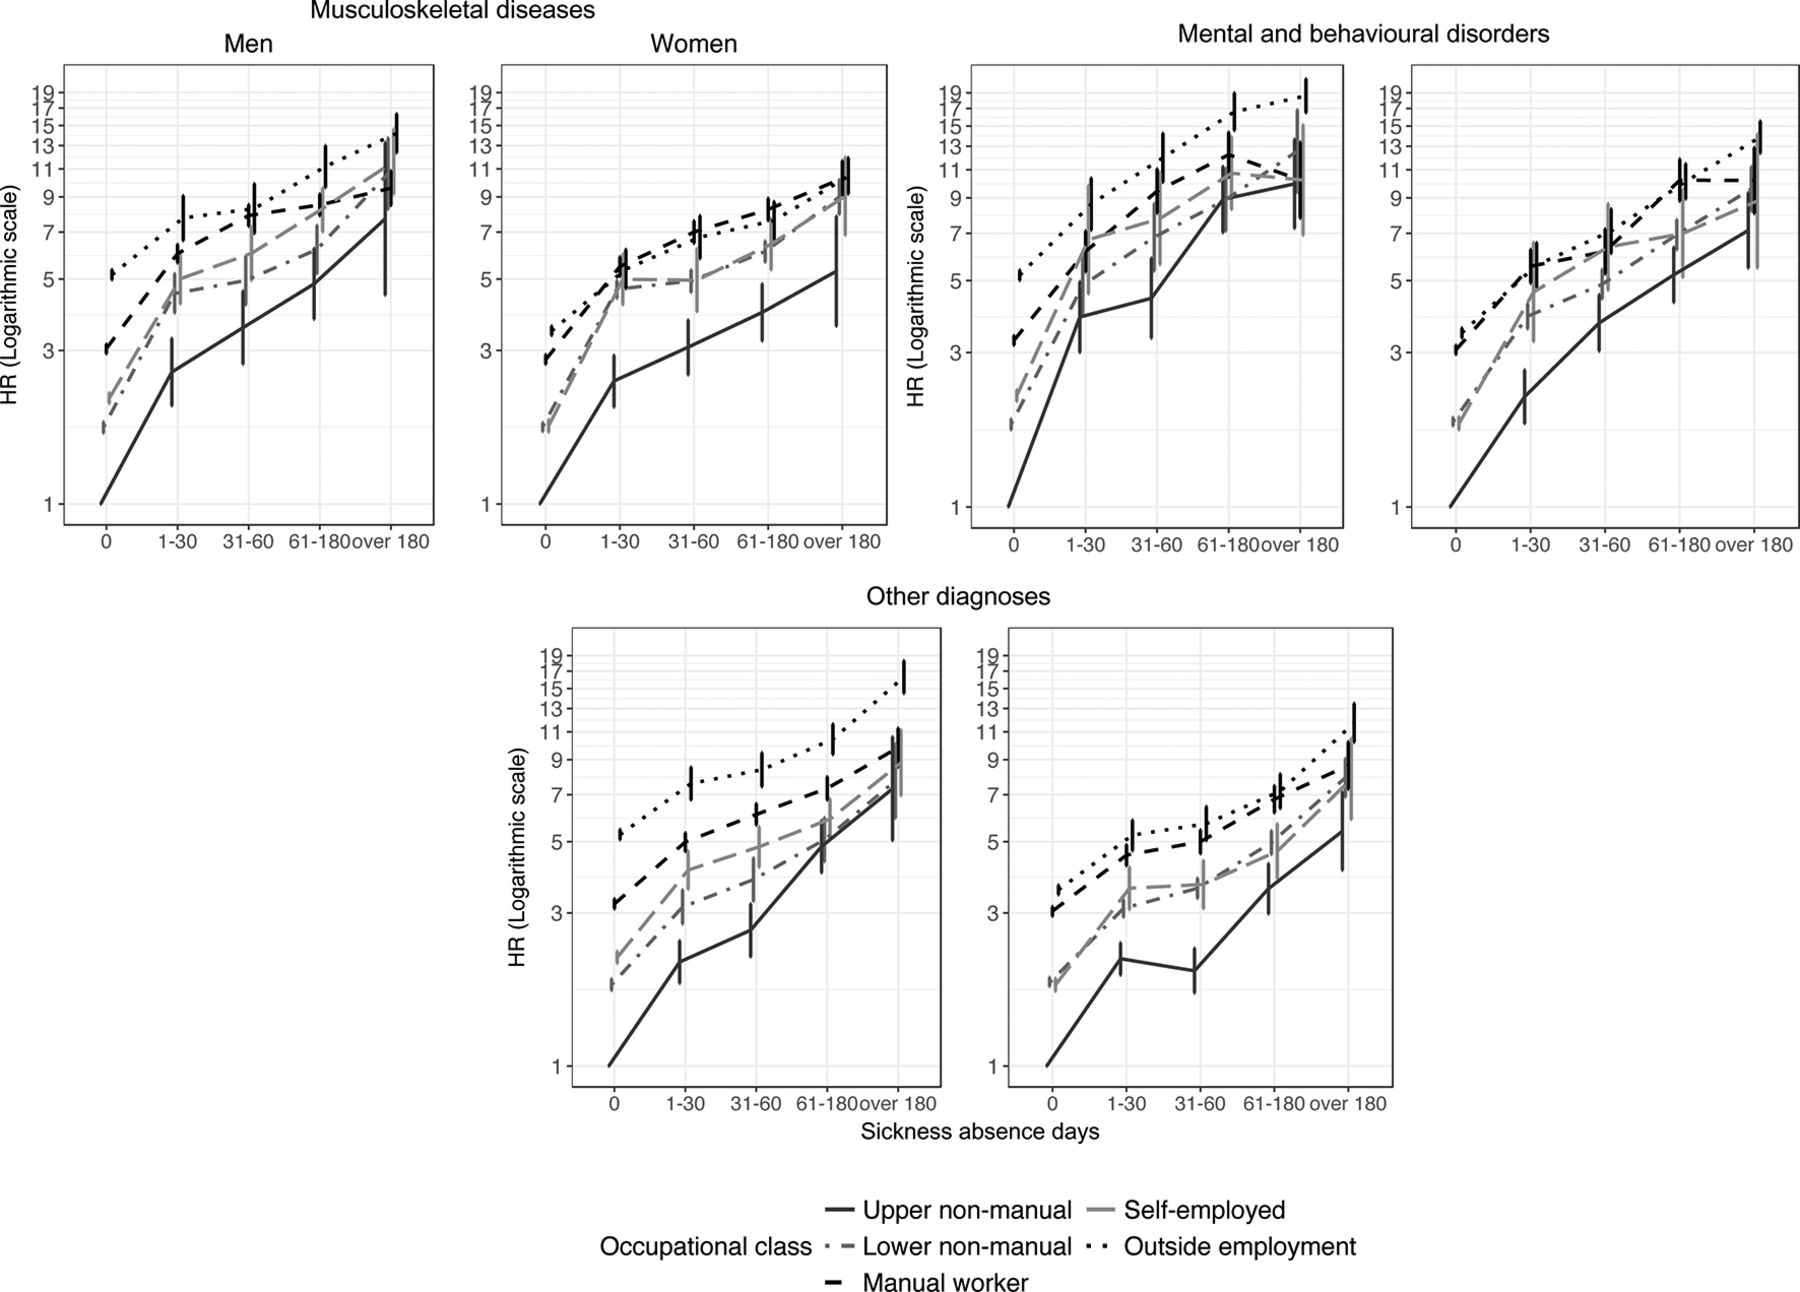
HRs for the risk of all-cause disability retirement in 2007–2014 with their 95% CI according to the length of diagnosis-specific SA in different occupational classes in men and women. Upper non-manual workers with zero sickness allowance days is the reference group. HRs on the logarithmic scale. All adjusted for all sociodemographic variables. SA, sickness absence.
The association between the length of diagnosis-specific SA and the risk of disability retirement was similar in all occupational classes. However, in upper non-manual employee men with >180 days of SA due to mental and behavioural disorders, the HR of disability retirement was 9.74 (95% CI 7.10 to 13.37) compared with upper non-manual employees with no SA due to the same diagnostic category, and the same HR was 7.28 (95% CI 4.22 to 12.55) when the SA was due to musculoskeletal diseases and 6.89 (95% CI 4.78 to 9.93) due to other diagnoses (online supplementary appendix tables 1 and 2). Additionally, in women there was an indication that a long SA due to mental and behavioural disorders predicted disability retirement more strongly, especially in upper non-manual employees. A similar indication, but to a lesser extent, was found in lower non-manual employees. However, in other occupational classes, there were no diagnostic group differences in the association between those with no SA (own occupational class as a reference group) and those with >180 SA days (online supplementary appendix tables 1 and 2).
To assess how the different diagnostic profiles of SA in different occupational classes affect the total association between length of SA and disability retirement shown in figure 1, we calculated the HRs after adjusting for the diagnosis of SA (figure 3). In general, adjusting for the diagnosis somewhat attenuated the association of increasing lengths of SA with risk of disability retirement in every occupational class. However, in men, the length of SA continued to predict disability retirement more strongly among upper non-manual employees than it did in other occupational classes. In women, the occupational class differences in the strength of association between the increasing length of SA and the risk of disability retirement were largely explained by the occupational class differences after controlling for the diagnosis of SA.

HRs for the risk of all-cause disability retirement in 2007–2014 according to the length of SA in different occupational classes in men and women. Upper non-manual workers with no sickness allowance days is the reference group. HRs on the logarithmic scale. All adjusted for all sociodemographic variables. Dotted lines represent HRs when not adjusted for diagnoses and solid lines represent HRs after adjusting for the diagnoses. SA, sickness absence.
Discussion
Main findings
Our results indicate that the length of sickness absence (SA) was associated with a higher risk of disability retirement in all occupational classes, especially in upper non-manual employees. Even short-term SA spells (those <31 days long) were associated with a higher risk of disability retirement compared with having no SA days. Furthermore, very long-term SA spells (those >180 days) were associated with a clearly higher risk of disability retirement. There was an indication that the length of SA due to mental and behavioural disorders predicted disability retirement slightly more strongly than the length of SA due to other diagnoses, with the association again being stronger in upper non-manual employees than in other occupational classes. The diagnosis of SA partly explained the differential association between the length of SA and the risk of disability retirement in different occupational classes.
Interpretation of the results
In this study, we found that manual workers and those outside employment clearly had a higher risk of disability retirement than did the other occupational classes, especially among those with no SA or with short-term SA. Among those with a long-term SA, the occupational class differences were narrower. The unemployed, which was the largest subgroup in those outside employment, and manual workers generally have poorer health21 32–35 and health behaviour,32 36 physically more strenuous jobs21 32 36 and less job control21 32 36 37 than higher occupational classes. These factors increase the risk of disability retirement, even without any SA or with short-term SA. Health problems can select people to unemployment,33 34 and long-term health problems increase the risk of disability. In the present study, the occupational class differences were smaller in long-term SAs, implying that those with long-term sicknesses have an increased risk of disability retirement, despite their occupational class. However, the risk of disability retirement increased with an increasing length of SA more strongly in upper non-manual employees than in other social classes. Upper non-manual employees have long SAs less frequently than manual workers do, indicating that upper non-manual employees with long-term SA are possibly a more selected group in terms of their disability retirement risk.
The diagnoses and long-term consequences of SAs are known to differ between occupational classes.23 38 39 This may be related to differences in work tasks and working conditions between the occupational classes. Some illnesses may be directly caused by work-related hazards. Furthermore, some health problems that prevent those with physically demanding jobs from working may not affect work ability among those in desk jobs. Previous studies have found that socioeconomic differences in the diagnoses of SAs are large in musculoskeletal diseases.23 In general, our study agrees with previous findings in that the association between the length of SA and the risk of disability retirement does not differ much between diagnostic groups of SAs.40 However, in this study, there was an indication that the length of SA due to mental and behavioural disorders predicted disability retirement slightly more strongly than did the length of SA due to other diagnoses, particularly among upper non-manual employees. SA due to mental and behavioural disorders has been found to present a greater risk of disability retirement than has SA due to other diagnoses,4 5 16 41 but previous studies have not found that the length of SA predicts disability retirement differently in SA due to mental and behavioural disorders compared with other diagnoses.5 40 Our finding on the indication that the length of SA due to mental and behavioural disorders was a stronger predictor in upper non-manual employees may partly be explained by work-related factors: upper non-manual employees often have psychologically demanding jobs,35 37 their employers may prefer the employees to remain absent due to sickness until fully recovered because it can be especially difficult to return to mentally complex work with mental health problems, and positions held by higher occupations are not as easily replaceable.42
The average lengths of the SA spells vary between diagnostic groups and occupational classes. We found that the adjustment of the diagnosis largely explained the differential association between the length of SA and the risk of disability retirement in different occupational classes, particularly in women. However, in upper non-manual employee men, the adjustment of the diagnosis did not, to a large extent, attenuate the association between the length of SA and the risk of disability retirement, which can be explained by the fact that in upper non-manual employees, a large proportion of the long-term SAs were due to mental and behavioural disorders. In other occupational classes, the association can be explained by a more equal distribution in the proportions and the average lengths of different diagnostic groups. In all, divergent diagnostic profiles in different occupational classes partly explain the occupational class differences in the association between the length of SA and the risk of disability retirement.
Methodological considerations
A key strength of the study was the 8-year prospective and population-based cohort design, based on a 70% register sample of the total Finnish non-retired working-age population. Data were obtained from national registers, constituting highly reliable sources with objective register-based measures, no self-report bias, practically no loss to follow-up and very little missing information. In addition, we were able to utilise date-specific information on both SA and disability retirement. However, a limitation common to all register-based data is the lack of information on, for example, health status, health behaviours or physical and psychosocial work environment that could explain or mediate the observed associations. Furthermore, due to the observational nature of the data, causal effects cannot be established. Confounding by previous health status or other unmeasured factors may explain some of the observed associations. The use of relatively broad diagnostic groups instead of more exact diagnoses prohibits from drawing too generalised conclusions from the results.
Conclusion
Our results suggest that there are occupational class differences in the pathways from SA to disability retirement. The length of SA predicts disability retirement more strongly than does the diagnosis of SA in all occupational classes, but the diagnostic profiles vary between occupational classes and partly explain the association between the length of SA and the risk of disability retirement. It is crucial to understand the ways in which work disability develops in different occupational classes to provide more efficient preventive measures. Further research should focus on understanding the mechanisms contributing to social inequalities in SA and work disability due to different diagnoses.
Acknowledgments
The authors want to thank participants of the annual conference of the Westermarck Society, RC28 -conference, Nordic Demographic Symposium, WORK2017 conference, the annual Social policy conference and EPH conference for the insightful comments.
References
Footnotes
Contributors LS, JB, ML and MN: contributed to the planning, conducting and reporting of this study. LS: conducted the statistical analyses and wrote the first and successive drafts of the manuscript. JB, ML and MN: advised on the statistical approach and modelling and revised the drafts of manuscripts. LS, JB and ML: interpreted the results. All authors approved the final submitted version.
Funding This work is supported by the Strategic Research Council of the Academy of Finland (decision numbers: 293103 and 314250).
Competing interests None declared.
Patient consent Not required.
Provenance and peer review Not commissioned; externally peer reviewed.
Data sharing statement No additional data available.