Article Text

Abstract
Objectives Originally developed as a paper questionnaire, the electronic Epworth Sleepiness Scale (ESS) is widely used in sleep clinics and sleep population research. Despite potential differences between computer-based and conventional questionnaire delivery, studies have not evaluated the agreement between electronic and paper versions of the ESS. Given the widespread use of the ESS, a bias between results would present considerable data concerns. Thus, the aim of this study was to examine agreement between electronic and paper ESS responses in obstructive sleep apnoea (OSA).
Design We undertook a secondary analysis of baseline data from a randomised controlled trial (ANZCTR: ACTRN12611000847910).
Setting Data were collected in a tertiary sleep research laboratory located in Sydney, Australia.
Participants Data were analysed from 112 adult patients with OSA.
Measurements Patients were given the English version of the ESS as part of a battery of sleep laboratory questionnaires. They completed electronic and subsequently paper ESS questionnaires on the same day.
Results We found no significant difference between electronic and paper ESS questionnaires (mean=0.1, SD=2.1, 95% CI −0.3 to 0.5, P=0.57) or heteroscedasticity. There was no evidence of bias along the range of the measure. 95% limits of agreement at 4.3 and −4.1 were comparable with previous data.
Conclusions We found no evidence of bias between electronic and paper ESS questionnaires in this sample of patients with OSA, as the two formats displayed sufficient agreement to be clinically comparable. Regardless of severity, patients reported the same level of daytime sleepiness with the same level of accuracy across both measures.
Trial registration number ACTRN12611000847910; Pre-results.
- sleepiness
- questionnaire
- computer
- paper-and-pencil
- epworth
- sleep apnoea
This is an Open Access article distributed in accordance with the Creative Commons Attribution Non Commercial (CC BY-NC 4.0) license, which permits others to distribute, remix, adapt, build upon this work non-commercially, and license their derivative works on different terms, provided the original work is properly cited and the use is non-commercial. See: http://creativecommons.org/licenses/by-nc/4.0/
Statistics from Altmetric.com
Strengths and limitations of this study
All of the patients were enrolled in a clinical trial and tested in a well-controlled clinical environment.
This was an unplanned secondary data analysis of baseline data collected from a clinical trial.
We inadvertently asked patients to complete the Epworth Sleepiness Scale twice, once from a routine clinical sleep study and a second from our clinical trial.
The order of questionnaire administration was not randomised and the time interval between questionnaires was not specified in advance. Participants (and researchers) did not however anticipate that they would complete the questionnaire twice.
The time gap of up to 3 hours between electronic and paper questionnaire assessments may have been too short and contributed to a higher agreement than what may have been found if the assessment period was longer.
Introduction
Electronic delivery of self-administered questionnaires has numerous advantages over conventional paper questionnaires. It reduces data entry costs and researcher errors, allows automatic validation of responses and is sometimes preferred by patients, potentially due to perceived confidentiality.1–3 Several studies in other disciplines have compared electronic to paper questionnaires4–8 and evaluated agreement with Bland-Altman plots.9 The Bland-Altman approach is the most appropriate method to quantify the level of agreement between two measurement techniques.9 10
The Epworth Sleepiness Scale (ESS)11 is widely used in sleep medicine, particularly in the setting of obstructive sleep apnoea (OSA) and was originally validated as a self-administered paper questionnaire. The reliability of the ESS has been tested for interlanguage translations,12–15 a novel pictorial ESS16 and a nurse-administered ESS,17 as well as in the original validation studies.18 19 Although the potential difference between questionnaire formats has been explored in non-sleep disciplines, the reliability of electronic delivery against the conventional paper ESS has not been assessed. Given the widespread use of the ESS, any bias between results would pose a concern to the interpretation of clinical and sleep research data. Conversely, a high level of agreement would assuage any doubts about the reliability of electronic ESS questionnaires.
Using secondary analysis of baseline data from a randomised controlled trial (RCT), we aimed to evaluate the agreement between electronic (desktop or laptop computer) and paper ESS scores. We hypothesised that results would be similar enough for electronic ESS administration to be clinically interchangeable with the conventional paper ESS.
Methods
Study design and patients
This was an unplanned secondary analysis of baseline data collected from a recently completed RCT of 113 patients with OSA (ANZCTR: ACTRN12611000847910). We inadvertently asked patients to complete the ESS twice, once from a routine clinical sleep study and a second from our clinical trial. The patient population was moderate-to-severe patients with OSA who were overweight or obese and could not tolerate standard therapy for sleep apnoea. Suitable patients were identified from sleep clinics and the general community through advertising for screening if they reported troubling daytime sleepiness to a clinician. Inclusion criteria were: 18 to 70 years of age, apnoea–hypopnoea index (AHI) ≥15/hour,20 27≤body mass index (BMI) ≤40 and/or waist circumference ≥80 cm (female) or 94 cm (male) and rejection of mechanical treatment within the past 2 years. All data were collected from July 2012 until October 2014 at a specialised tertiary care clinic—The Woolcock Institute of Medical Research, Australia. Ethical approval was granted by the Sydney Local Health District Ethics Review Committee (protocol number X11-0088). Written informed consent was obtained from all patients included in this study.
Questionnaires
The ESS asks patients to rate their levels of daytime sleepiness across eight common situations11 (see online supplementary figure S1 and S2 in supporting information). Responses vary from 0 to 3, with 0 representing no perceived risk of falling asleep in that situation (‘would never doze’) and three representing a high chance of falling asleep (‘high chance of dozing’). Total (summed) scores range from 0 to 24, with scores over 10 interpreted clinically as excessive daytime sleepiness21 and scores of 16 or more as being extremely sleepy.11
Assessment, data management and statistical analysis
After consent, patients completed the English version of the ESS as part of a battery of sleep laboratory questionnaires before an overnight polysomnography study. Patients initially answered the electronic ESS (eESS) (18:00-19:00) and subsequently the paper ESS (pESS) (19:30-21:00) on the same day without visibility of their previous eESS responses. Patients were not specifically instructed that they would complete the same questionnaire twice. The eESS was presented on a web-based platform. It was delivered on either a desktop or laptop computer with a colour display and mouse. It was presented as a single web page allowing revision before submission. To submit, patients had to answer all eight questions and could only select one response to each question. For scoring, each response corresponded to a whole number from 0 to 3. The pESS asked patients to write a number from 0 to 3, explicitly corresponding to the same options as the eESS (online supplementary figure S1 and S2 in supporting information). For data management, eESS data transferred automatically into a database. pESS data were manually double entered without rounding responses by the analyst (LC), who had no interaction with patients and was blinded to the eESS scores. Data were then analysed using IBM SPSS Software V.22.0.0.0. The Bland-Altman plot was made using GraphPad Prism V.6.04 (GraphPad Software).
For analysis, we calculated the difference between eESS and pESS scores for each patient. Positive values indicate a higher eESS score. We used histograms and Q-Q plots to assess normality and Spearman’s correlations to evaluate the association between the difference and patient characteristics (such as age). A Bland-Altman plot is a method of checking agreement between distinct measures of the same variable by mapping the difference between the measures against their average.9 Using this methodology, we analysed three major features: (1) estimated bias: the mean difference between the eESS and pESS, assessed by a paired-samples t-test; (2) 95% limits of agreement defined by mean difference ±1.96 SDs: we sought to compare these against the maximum difference that still allows two measures to be clinically interchangeable; (3) heteroscedasticity and proportional bias: from the distribution of data across the range of the measure. We visually inspected the difference for asymmetry (heteroscedasticity) or a slant (proportional bias), which would suggest variability with score magnitude and imply bias or error. Intraclass correlation coefficient (ICC) was calculated for test–retest reliability using a single measurement, absolute agreement, two-way mixed-effects model.22
Results
Patients
A total of 113 patients underwent a baseline visit as part of the clinical trial and 112 patients (women=24 (21.4%)) were analysed (one patient was excluded due to a missing pESS) with mean (SD): age=51.7 (11.1); AHI=42.0 (24.1); BMI (kg/m2)=33.9 (4.6). There were no incomplete eESS data. One patient provided 10 pESS responses (instead of eight). One other patient included half scores to two pESS items (0.5 and 1.5). Both patients wrote total (summed) pESS scores which were included in the analysis. The proportion of obese patients (BMI ≥30) was 78% (87/112). Thirty per cent (33/112) of patients had moderate OSA (≥15, but <30) and 64% (72/112) had severe OSA (AHI ≥30 per hour).
Agreement
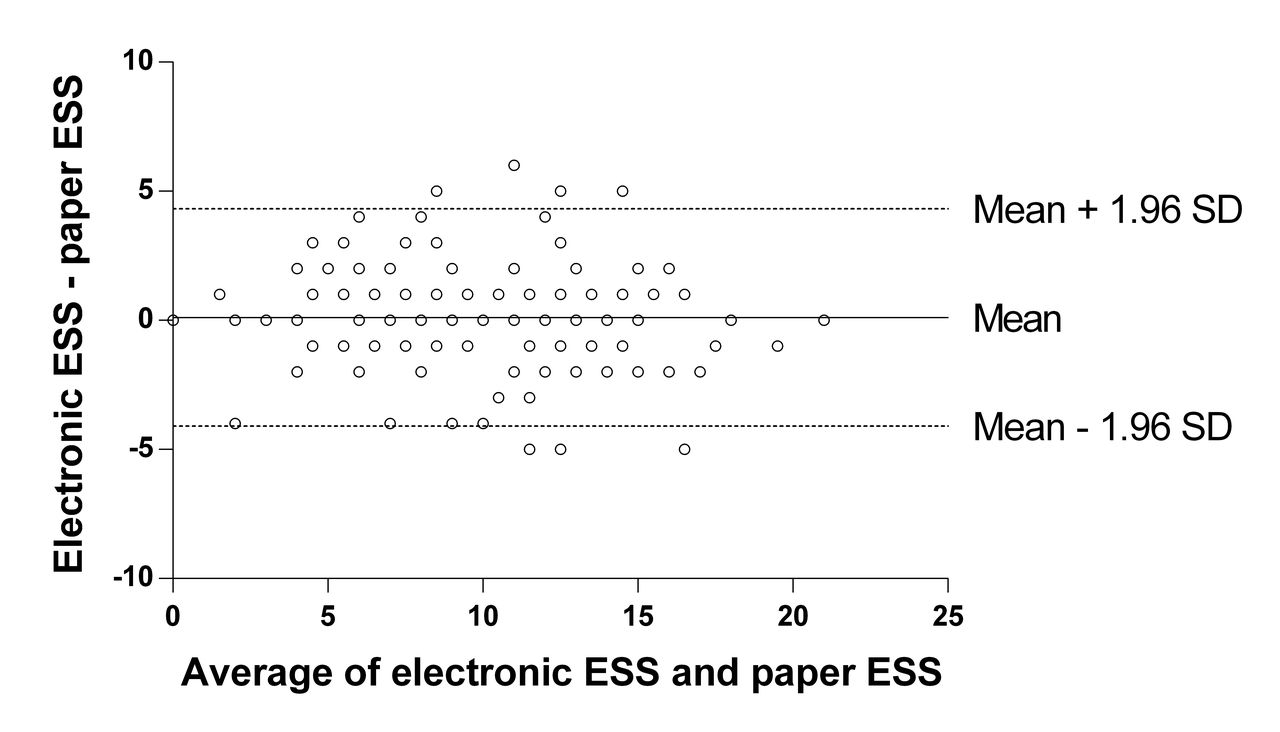
(1) Estimated bias: there was no significant difference between eESS=9.8 (4.4) and pESS=9.7 (4.5) scores (mean=0.1, SD=2.1, 95% CI −0.3 to 0.5, t(111)=0.57, P=0.57). The difference between eESS and pESS scores followed a normal distribution and did not significantly correlate with patient characteristics: age (rs=0.03, n=112, P=0.73); BMI (rs=−0.04, n=112, P=0.65); AHI (rs=0.03, n=112, P=0.79). (2) Ninety-five per cent limits of agreement: were at 4.3 and −4.1 (figure 1).
Bland-Altman plot comparing electronic ESS scores and paper ESS scores. ESS, Epworth Sleepiness Scale.
The paired scores differed by no more than 1 in 56.3% of patients, by no more than 2 in 80.3% and by no more than 4 in 93.8% of patients.18 (3) Heteroscedasticity and proportional bias: from visual inspection of the Bland-Altman plot, the data appeared symmetrical above and below the horizontal mean difference line and did not suggest variability along the ESS score range. We observed no slant in the axis of the data, as the mean difference line appeared to provide a suitable line of fit. Thus, heteroscedasticity and proportional bias were not apparent here. The ICC included all data points and was 0.88 (95% CI 0.84 to 0.92).
Figure 1 compares the average of the eESS score and corresponding pESS score for a patient (x-axis, n=112) against the difference between the eESS score and the pESS score (y-axis, n=112). The solid horizontal line indicates the mean difference of 0.1. The dotted horizontal lines indicate the 95% limits of agreement (mean difference ±1.96 SDs) at 4.3 and −4.1. The figure shows that eESS scores are 0.1 higher on average than pESS scores (mean=0.1, SD=2.1, 95% CI −0.3 to 0.5, P=0.57).
Discussion
On both electronic and paper ESS questionnaires, patients reported the same level of daytime sleepiness with the same level of accuracy, regardless of the severity of their sleepiness. The 95% limits of agreement indicate that patients’ ESS scores are accurate to within approximately ±4, which is comparable to the test–retest reliability found in a previous study.18 It appears that an eESS delivered on a desktop or laptop computer can be used interchangeably with the conventional pESS questionnaire in patients with OSA.
A useful result is when the 95% limits of agreement are narrower than the limits of what is clinically acceptable.9 23 To our knowledge, there is currently no established consensus on clinically acceptable limits that allow two ESS measures to still be interchangeable. Adopting the next most effective alternative, we examined the percentage of patients with a difference within ±1, ±2 and ±4 (inclusive) and compared this with previous data.18 Our results (56.3%, 80.3% and 93.8%, respectively) were strongly comparable with Johns’ (1992) findings (51.7%, 81.6% and 96.6%, respectively). We note that Johns’ (1992) data came from university students who answered pESS questionnaires twice, with a larger gap of 5 months.18 A smaller interval between administrations would have been preferable for our comparison, in line with the same-day intervals used in other disciplines.4 6–8 A larger time interval between measures may have revealed more variation in the online measure compared with the paper measure. The shorter time gap of a few hours here should be compared with the 5 months in Johns’ (1992) data. Our numerically comparable variability over a much shorter time gap may therefore imply additional variability exists between computer-to-paper retests than paper-to-paper retests.18
Our patients’ eESS and pESS scores both ranged from 0 to 21 (out of a possible maximum of 24), providing a wide clinical range for this investigation. We found no measurement biases or inaccuracies anywhere along this range or attributable to any patient characteristics. The ICC was 0.88 (95% CI 0.84 to 0.92), indicating good test–retest reliability22 between pESS and eESS scores, similar to Johns’ initial observation (1992).18 Overall, results suggest sufficient agreement between eESS and pESS delivery for them to be clinically interchangeable. Future studies should evaluate whether these findings are applicable across other countries and in other sleep disorder populations, should use a longer time interval between questionnaire assessments and should randomise the questionnaire administration order. Further, commonly used questionnaires in sleep medicine should now be assessed for agreement between electronic and paper versions.
Study limitations
This is the first study to investigate the agreement between electronic and paper versions of the ESS. This was a secondary analysis of baseline RCT data from untreated patients with OSA with daytime sleepiness. While we analysed a specific demographic of moderate-to-severe patients with OSA, our sample was clinically relevant. Without randomisation in the order of questionnaire administration, a learning effect may have occurred. However, patients did not anticipate that they would complete the ESS twice, were asked to complete other questionnaires during the assessment period and did not have access to their overall ESS scores from the first electronic assessment. The questionnaires were also completed up to several hours apart on the same day, consistent with similar studies in other disciplines.4 6–8 This time gap between measures may however have been too short, and it is possible that some participants may have had an assessment interval of only 30 min between electronic and paper questionnaires. It may have been possible for participants to remember their responses and therefore results should now be replicated further in this population with a longer time interval between assessments. As with any clinical questionnaire, data were not collected anonymously, which may have caused some patients to adjust answers to appear more socially acceptable. Our eESS differed slightly from the conventional pESS due to electronic validation of responses which, unlike the paper version, enabled complete capture of responses for all patients. Importantly, we consider this to be one of the advantages justifying the current widespread use of eESS questionnaires in both research and clinical settings. We used a desktop or laptop computer to deliver the ESS electronically, and further studies will be required to evaluate if findings are similar with delivery by smart phone and tablet applications.
Conclusions
We found no evidence of bias between electronic (desktop or laptop computer) and paper ESS questionnaires in this sample of patients with OSA enrolled in a clinical trial. Data suggest that electronic and paper ESS questionnaires agree to a clinically acceptable margin of accuracy and therefore appear clinically interchangeable. This provides some assurance that clinical interchangeability between electronic and paper ESS questionnaires does not introduce additional data bias to the ESS. Given the widespread acceptance of the ESS in either paper or electronic format, we encourage future studies to extend our research to other patient populations with a longer time between questionnaire assessments and with randomisation of the administration order.
Supplementary file 1
![[bmjopen-2017-019255-SP1.jpg]](https://bmjopen.bmj.com/content/bmjopen/8/3/e019255/DC1/embed/inline-supplementary-material-1.jpg?download=true)
Supplementary file 2
![[bmjopen-2017-019255-SP2.jpg]](https://bmjopen.bmj.com/content/bmjopen/8/3/e019255/DC2/embed/inline-supplementary-material-2.jpg?download=true)
References
Footnotes
Contributors Study design: NSM, JLC, BJY, RRG. Data collection: JLC, BJY. Data analysis: LC, NSM, JLC, CBM. Interpretation of results: LC, NSM, JLC, BJY, KKHW, RRG, CBM. Preparation of the manuscript: LC, NSM, JLC, BJY, KKHW, RRG, CBM.
Funding This research was supported by the National Health and Medical Research Council (NHMRC, Australia) Centre for Research Excellence, NeuroSleep, 1060992 (to CBM, KKHW, NSM and RRG); NHMRC Project Grant, 1004528 (to BJY, KKHW, NSM and RRG); NHMRC Postgraduate Scholarship, 1038709 (to JLC) and a Sydney University Medical School Summer Research Scholarship (to CBM and LC).
Competing interests None declared.
Patient consent Obtained.
Ethics approval The Sydney Local Health District Ethics Review Committee.
Provenance and peer review Not commissioned; externally peer reviewed.
Data sharing statement Extra data can be accessed via the Dryad data repository at http://datadryad.org/ with the doi:10.5061/dryad.st1bs