Article Text

Abstract
Objective There has been concern that an increase in billing for high-intensity emergency care is due to changes in coding practices facilitated by electronic health records. We sought to characterise the trends in billing for high-intensity emergency care among Medicare beneficiaries and to examine the degree to which trends in high-intensity billing are explained by changes in patient characteristics and services provided in the emergency department (ED).
Design, setting and participants Observational study using traditional Medicare claims to identify ED visits at non-federal acute care hospitals for elderly beneficiaries in 2006, 2009 and 2012.
Outcomes measures Billing intensity was defined by emergency physician evaluation and management (E&M) codes. We tested for overall trends in high-intensity billing (E&M codes 99285, 99291 and 99292) and in services provided over time using linear regression models, adjusting for patient characteristics. Additionally, we tested for time trends in rates of admission to the hospital and to the intensive care unit (ICU). Next, we classified outpatient visits into 39 diagnosis categories and analysed the change in proportion of high-intensity visits versus the change in number of services. Finally, we quantified the extent to which trends in high-intensity billing are explained by changes in patient demographics and services provided in the ED using multivariable modelling.
Results High-intensity visits grew from 45.8% of 671 103 visits in 2006 to 57.8% of 629 010 visits in 2012 (2.0% absolute increase per year; 95% CI 1.97% to 2.03%) as did the mean number of services provided for admitted (1.28 to 1.41; +0.02 increase in procedures per year; 95% CI 0.018 to 0.021) and discharged ED patients (7.1 to 8.6; +0.25 increase in services per year; 95% CI 0.245 to 0.255). There was a reduction in hospital admission rate from 40.1% to 35.9% (−0.68% per year; 95% CI −0.71% to −0.65%; P<0.001), while the ICU rate of admission rose from 11.7% to 12.3% (+0.11% per year; 95% CI 0.09% to 0.12%; P<0.001). When we stratified by diagnosis category, there was a moderate correlation between change in visits billed as high intensity and the change in mean number of services provided per visit (r=0.38; 95% CI 0.07 to 0.63). Trends in patient characteristics and services provided accounted moderately for the trend in practice intensity for outpatient visits (pseudo R2 of 0.47) but very little for inpatient visits (0.051) and visits overall (0.148).
Conclusions Increases in services provided in the ED moderately account for the trends in billing for high-intensity emergency care for outpatient visits.
- quality in health care
- health policy
This is an Open Access article distributed in accordance with the Creative Commons Attribution Non Commercial (CC BY-NC 4.0) license, which permits others to distribute, remix, adapt, build upon this work non-commercially, and license their derivative works on different terms, provided the original work is properly cited and the use is non-commercial. See: http://creativecommons.org/licenses/by-nc/4.0/
Statistics from Altmetric.com
Strengths and limitations of this study
Examined 1.9 million emergency department (ED) visits by Medicare beneficiaries in the USA in 2006, 2009 and 2012.
Employed multivariable modelling to examine the extent to which trends in practice intensity are explained by changes in patient characteristics and services provided.
Lacks some clinical information such as vital signs, laboratory results and total time spent in the ED undergoing treatment and observation, as is inherent to the use of claims data.
There is less detail regarding work performed in the ED for admitted patients compared with those who were discharged.
The analysis is limited to elderly fee-for-service Medicare beneficiaries and may not be generalisable to other populations.
Introduction
The rising cost of healthcare in the USA has received increasing attention1 as it has strained state and federal budgets2 3 and directly impacted individuals via lost income and higher out-of-pocket costs.4 Emergency care has often been portrayed as an expensive and inefficient contributor to the healthcare crisis.5–7 Concerns about the cost of emergency care have led to a variety of initiatives seeking to steer patients away from the emergency department (ED) to lower cost settings during an acute illness.8 9 Despite these concerns, the number of ED visits in the USA has continued to rise,10 11 as have the numbers of visits billed at the highest level of intensity.12 As billing for high-intensity emergency care has risen, some have questioned whether the growth of electronic health records (EHRs) has exacerbated the problem by allowing providers to more easily ‘upcode’ or bill for services without changing the work performed.13 While prior work has suggested that EHRs have not led to upcoding for inpatient care,14 relatively little is known about this phenomenon for emergency care.
Research has demonstrated that the average number of diagnostic and treatment services provided during an ED visit has also risen over time,15 16 suggesting that upcoding alone is unlikely to explain the growth in billing for high-intensity emergency care. Such an increase in the intensity of care provided may reflect efforts to improve quality and reduce costs of care by avoiding a more expensive hospital admission, or to reserve limited availability of inpatient space for the highest acuity patients.15 To our knowledge, no studies have used multivariable modelling at the visit level to examine the relative contribution of patient characteristics and clinical practice patterns to trends in billing for high-intensity emergency care or whether the trend in high-intensity billing has been uniform across various conditions treated in the ED.
Thus, we sought to evaluate the trends in billing for high-intensity emergency care and the underlying mechanism for these trends by addressing three questions. First, what are the trends in billing for high-intensity care in the Medicare fee-for-service population, and to what extent are these trends accompanied by changes in patient characteristics and practice patterns? Second, do particular diagnoses or conditions have greater changes in intensity over time, and, if so, are these variations associated with trends in services? Finally, how much of the trend in high-intensity billing is explained by trends in services provided and patient characteristics when using multivariable modelling?
Methods
Study design and setting
We used a 5% sample of national Medicare fee-for-service claims to identify ED visits in 2006, 2009 and 2012. We examined ED visits by beneficiaries aged 65 years and older who were continuously enrolled in traditional Medicare and presented to non-federal acute care hospitals. The billing intensity level was obtained by identifying all emergency physician professional claims in the Carrier file for Current Procedural Terminology (CPT) Healthcare Common Procedure Coding System (HCPCS) evaluation and management codes 99281–99285, 99291 and 99292. Patient characteristics (age, sex, race and Medicaid eligibility) were obtained from the Master Beneficiary Summary file. Patient chronic conditions were assigned using software from the Centres for Medicare and Medicaid Services that allows for the creation of Hierarchical Condition Categories (HCCs)17 based on conditions coded in claims for that year. Information such as visit diagnosis and services provided were obtained from the inpatient file for admitted patients and the outpatient file for visits resulting in discharge or observation status. Procedures were denoted by International Classification of Diseases, Ninth Revision procedure codes for inpatient visits and CPT/HCPCS codes for outpatient visits and physician professional claims. Since claims for substance-abuse-related visits were no longer available in Medicare data in 2012,18 we dropped substance abuse claims from the prior years. We used the American Hospital Association survey from 2012 to obtain data on hospital characteristics (region, rural vs urban location, size, as well as trauma centre, profit and teaching status) and linked this to ED claims using Medicare provider identification numbers.
Outcomes
High-intensity billing
Our primary outcome was the ED visit level of billing intensity, defined by CPT codes as selected by the treating emergency physician or designee. CPT codes 99281 and 99282 represent low complexity, 99283 and 99284 represent moderate complexity, 99285 represents high complexity, while codes 99291 and 99292 are used to denote that critical care services were provided. While prior studies have used 99285 alone to define high-intensity ED visits,19 20 we chose to also define ED visits with critical care billing as high intensity as these were available in our dataset and have been evaluated in prior research on ED visit acuity.21 Thus, we created a binary intensity outcome variable, categorising visits with codes 99281–99284 as low intensity and those with codes 99285, 99291 and 99 292 as high intensity.
Clinical services provided
If a rise in high-intensity billing was due to upcoding alone rather than trends in actual practice, we might expect relatively little change in the frequency and type of services provided in the ED. As such, we determined the mean number of services provided per visit according to the ED facility claims. For discharged patients, we identified all services on outpatient ED facility claims (outpatient services) such as laboratory and radiology tests and clinical procedures that occurred in the ED. For admitted patients, services from inpatient facility claims (inpatient services) may have been provided at any time during that hospitalisation, including during treatment in the ED, as we could not readily distinguish the location of services provided for admitted patients in this dataset. We also determined the mean number of physician professional claims for services other than evaluation and management for all visits (physician services).
Hospital and intensive care unit admission rate
We also evaluated the trends in rates of admission to the hospital and to the intensive care unit (ICU) as additional indicators or clinical practice and patient acuity. Hospital utilisation rates in the USA have fallen22 as the number of inpatient beds per capita has declined. Thus, temporal trends in hospital admission may reflect changing practice patterns in response to a variety of incentives to admit fewer patients rather than patient acuity alone. More intensive ED evaluation and treatment may allow emergency physicians to safely discharge a greater number of patients of moderate acuity or complexity. ICU admission, however, is generally reserved for the most seriously ill patients and is less likely to be avoided by an intensive ED work-up. Thus, we hypothesised that any increase in high-intensity billing would be accompanied by a reduction in hospital admission and stable or increasing rates of ICU admission.23
Analysis
Trend in high-intensity billing
Changes in billing for high-intensity emergency care were estimated by regressing a binary outcome (high or low intensity) against time while controlling for patient characteristics. Patient age, race, sex and Medicaid coverage were used for the patient characteristics. Analysis occurred at the visit level with each visit coded as high or low intensity. The models accounted for patient clustering at the level of the ED. The adjusted estimates of the proportion of high-intensity visits were graphed over time, and rates of change over the study period were tested for statistical significance. A logistic regression model using generalised estimating equations and time as a categorical predictor was used for the adjusted estimates, while, for interpretability, linear regression with time as a continuous predictor was used for rates of change. In addition to examining the binary high-intensity outcome variable, we examined the time trends for each of the seven intensity categories individually.
Visit rate
We next examined how the rate of high-intensity visits and overall ED visits changed. An increase in the relative proportion of high-intensity visits could potentially reflect a reduction in low-acuity visits over time rather than an increase in population rates of high-acuity visits.5 24 Thus, we calculated a per-beneficiary rate of overall high-intensity and low-intensity visits for each year and tested for a time trend using negative binomial regression.
Secondary outcomes
We used the Clinical Classifications Software developed by the Agency for Healthcare Research and Quality Healthcare Cost and Utilization Project (HCUP-CCS) to classify procedure codes for inpatient, outpatient and physician services into clinically meaningful categories and determined the frequency of each procedure type. We tested for time trends in mean number and type of services per visit for admitted and discharged patients using linear regression adjusting for age, sex, race and Medicaid eligibility. The yearly estimates for rates of procedures were obtained using negative binomial regression using generalised estimating equations to account for patient clustering at the level of the ED and with time as a categorical predictor. We tested for time trends in the overall hospital admission rate (percentage of ED visits leading to a hospital admission) and the ICU admission rate (percentage of ED visits leading to an ICU admission), again using linear regression, adjusting for age, race, sex and Medicaid coverage. The yearly estimates for these outcomes were obtained from binomial regression using generalised estimating equations to account for patient clustering at the level of the ED.
Trends in practice intensity by diagnosis category
Next, we evaluated if trends in billing for high-intensity emergency care varied by condition treated and if those conditions with the greatest changes in high-intensity emergency care also saw the greatest changes in services over time. We categorised the principal diagnosis for each outpatient visit into one of 39 diagnosis categories, previously described in the emergency medicine literature (online supplementary appendix 1),25 and used the analogous adjusted longitudinal linear regression model for each diagnosis to estimate the percentage of total visits in each year categorised as high-intensity, as well as the absolute change in proportion of high-intensity visits. We limited this analysis to outpatient visits because of the limited detail regarding ED services for admitted patients. For each diagnostic category, we calculated the change in high-intensity visit rate and the change in ED services between 2006 and 2012. The changes were graphed against each other, and a correlation coefficient was calculated to capture the degree to which the two were associated with each other. Additionally, for each diagnosis category, we graphed the change in proportion of high-intensity visits against the baseline proportion of high-intensity visits in 2006. We did this in order to determine if high-complexity or low-complexity conditions saw greater changes over time.
Supplementary file 1
Multivariable modelling
We used generalised logistic regression modelling, controlling for repeated hospital measures, to investigate the extent to which trends in practice intensity are explained by concomitant changes in patient characteristics, chronic conditions and services provided in the ED. We specified four models with the initial model having the binary variable intensity as the outcome and time as the predictor. The second model incorporated beneficiary characteristics. The third model incorporated number of chronic conditions. The fourth model further incorporated inpatient, outpatient and physician-billed services (CPT codes) for all visits. We calculated a pseudo R2 for each model26 27 as a measure of the proportion of total variation explained by the model. We ran these models for all visits and for inpatient and outpatient visits separately.
As a complementary analysis examining the degree to which trends in coding are explained by the variables in our model, we ran two logistic regression models separately for 2009 and 2012 and obtained the coefficients for each variable in the model for those years. We then applied those coefficients to ED visits in 2006 to obtain an expected number of visits in 2006. The difference between the observed and predicted number of visits billed as high intensity in 2006 using coefficients from the later years represents the degree to which high-intensity billing has changed in ways that cannot be explained by the variables in our model. We performed this analysis for outpatient and inpatient visits separately.
Sensitivity analysis
There has been a growth in use of observation services for Medicare beneficiaries28 29 both in the ED and the inpatient setting.30 There has been some concern that the concomitant growth in observation status and decline in hospital admissions may represent substitution in response to Medicare payment policies.28 To evaluate if our results were sensitive to inclusion of observation visits in our sample, we recalculated the admission rate and mean number of inpatient and outpatient services and repeated our mediation analysis after reclassifying all observation claims as admissions.
Analyses were conducted using SAS V.9.3 (SAS institute).
Results
Characteristics of study sample
We examined 1 883 650 ED total visits. Patient and hospital characteristics are summarised for all ED visits in table 1. There was a decrease in the proportion of ED visits by women (66.1% to 60.6%; −0.94% absolute decrease per year (95% CI −0.97% to −0.91%); P<0.001) and whites (85.9% to 84.1%; −0.29% absolute decrease per year (95% CI −0.31% to −0.27%); P<0.001) while all other racial groups saw a slight increase. The proportion of visits by Medicaid beneficiaries rose from 22.4% in 2006 to 23.1% in 2012 (+0.12% absolute increase per year (95% CI 0.09% to 0.14%); P<0.001). The average number of chronic conditions per beneficiary increased slightly from 4.61 in 2006 to 4.91 in 2012 (+0.05 conditions/per year (95% CI 0.049 to 0.054); P<0.001). When we stratified by high-intensity and low-intensity ED visits, the number of chronic conditions (HCCs) was higher for beneficiaries with a high-intensity visit than for those with a low-intensity visit (5.66 HCCs vs 3.93 HCCs, respectively, in 2012; table 1). Over the study period, there was an increase in the proportion of visits to urban (71.5% in 2006 to 73.1% in 2012; +0.26% absolute increase per year (95% CI 0.24% to 0.29%); P<0.001), large (23.6% to 26.4%; +0.48% per year (95% CI 0.46% to 0.50%); P<0.001), minor teaching (26.4% to 30.8%; +0.74% per year (95% CI 0.72% to 0.77%); P<0.001) and for-profit hospitals (12.9% to 14.9%; +0.33% per year (95% CI 0.31% to 0.35%); P<0.001), as well as trauma centres (38.2% to 43.7%; +0.91% per year (95% CI 0.88% to 0.93%); P<0.001).
Beneficiary and hospital characteristics as a percentage of total emergency department visits by year
Trends in practice intensity
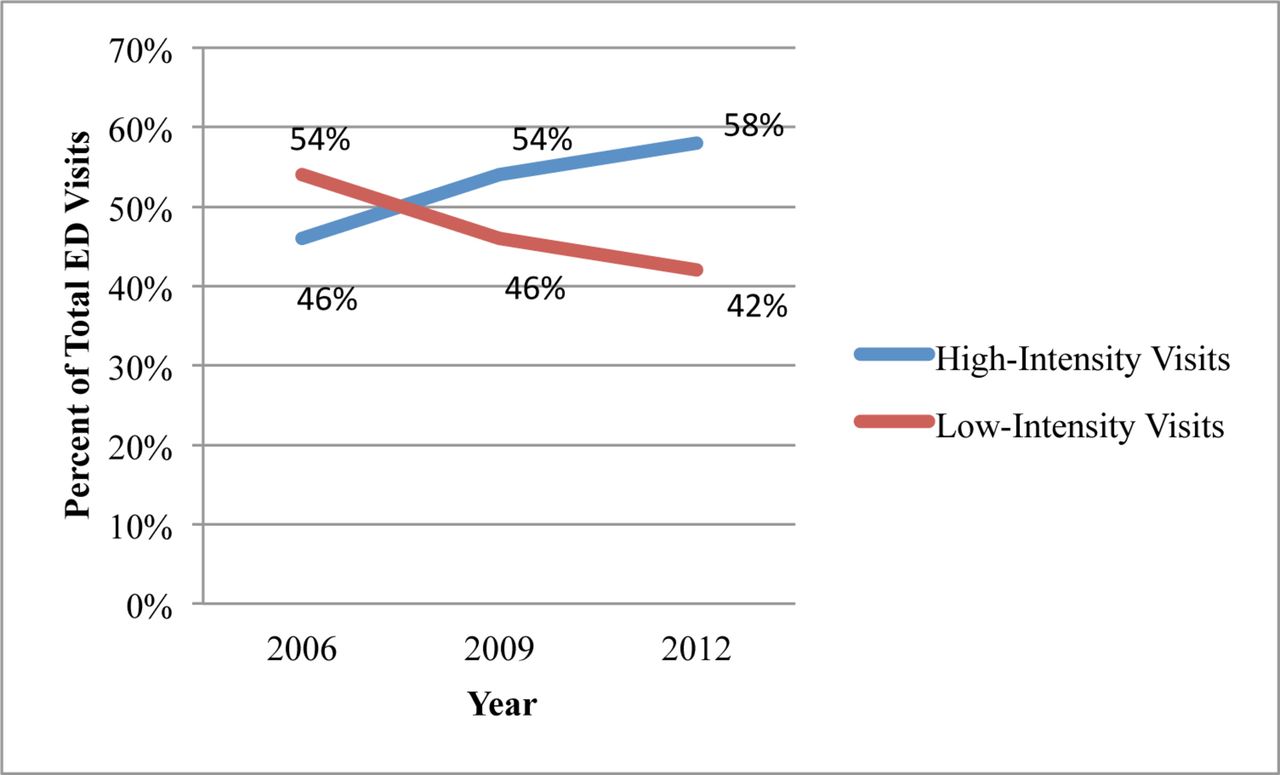
High-intensity visits overall rose from 45.8% in 2006 to 57.8% in 2012 (+2.0% per year (95% CI 1.97% to 2.03%); P<0.001; figure 1).The most frequent intensity code in all 3 years was 99285, also known as a level-5 visit (online supplementary appendix 2). Level-5 visits represented 39.7% of all ED visits in 2006 and 49.4% in 2012 (+1.6% per year (95% CI 1.57% to 1.63%); P<0.001). There was also an increase in visits that were billed at a critical care level (CPT 99291) from 5.0% of all visits in 2006 to 7.6% in 2012 (+0.4% increase per year (95% CI 0.39% to 0.41%); P<0.001). CPT 99292 comprised less than 1% of all visits in both years and showed a small increase that was not statistically significant (+0.004% increase per year (95% CI −0.0003% to +0.009%); P=0.07). We observed a concomitant decrease over time in each of the four CPT codes categorised as low intensity (online supplementary appendix 2).

Adjusted time trends in billing for high-intensity and low-intensity emergency care. Longitudinal linear regression was used to estimate the time trend, adjusting for patient age, race, sex and Medicaid coverage. The yearly estimates were based on binomial regression using generalised estimating equations to adjust for clustering at the level of the emergency department. High-intensity visits are coded as 99285 or critical care (99291, 99292). Low-intensity visits are defined by emergency physician billed CPT/HCPCS codes 99281–99284. CPT, Current Procedural Terminology; ED, emergency department; HCPCS, Healthcare Common Procedure Coding System.
Trends in visit rates per beneficiary
We found an increase from 535 to 565 ED visits per 1000 beneficiaries that was not statistically significant (0.9% increase per 1000 beneficiaries per year (95% CI −1.1% to 2.9%); P=0.37, online supplementary appendix 3). There was a significant increase in the high-intensity visit rate from 241 to 322 per 1000 beneficiaries (4.8% increase in high-intensity visits per 1000 beneficiaries per year (95% CI 2.0% to 7.5%); P<0.001), while the rate of low-intensity visits per beneficiary decreased (294 to 243 visits per 1000 beneficiaries; −3.2% decrease in low-intensity visits per 1000 beneficiaries per year (95% CI −6.1% to −0.4%); P=0.03).
Trends in patient acuity and treatment intensity
When we looked at inpatient services for patients admitted from the ED, we found an increase in the mean number of total services (1.28 to 1.41 per admission; +0.02 procedures per year (95% CI 0.018 to 0.021); P<0.001), which persisted even after reclassifying observation claims as admissions (1.23 to 1.29; +0.011 procedures per year (95% CI 0.009 to 0.012); P<0.001). High-intensity admissions had a greater number of services in each year, and both groups saw an increase over time in the mean number of services (table 2). The most frequent inpatient services by year are presented in online supplementary appendix 4. Several critical care procedures and services saw an increase over time, including respiratory intubation and mechanical ventilation (9.9% of all admissions from the ED in 2006 compared with 12.6% in 2012; +0.45% per year (95% CI 0.41% to 0.49%); P<0.001), blood transfusion (12.4% to 15.4%; +0.52% per year (95% CI 0.48% to 0.56%); P<0.001) and other vascular catheterisation, not heart (7.6% to 10.0%; +0.41% per year (95% CI, 0.38% to 0.44%); P<0.001).
Trends* in selected markers of acuity or complexity for ED visits
Outpatient ED visits saw a significant increase in total average number of services per visit from a mean of 7.1 in 2006 to 8.6 in 2012 (+0.25 increase in mean services per year (95% CI 0.25 to 0.26); P<0.001). High-intensity visits, relative to low-intensity visits, had a greater number of services in each year. High-intensity visits saw a significant increase in services (12.9 to 13.7; +0.14 services per year (95% CI 0.13 to 0.15); P<0.001), whereas low-intensity visits saw a slight decrease (5.3 to 5.2; −0.008 services per year (95% CI −0.121 to −0.003); P<0.001; table 2). After reclassifying observation claims as admissions, the mean number of outpatient services still saw an increase from 6.7 to 8.1 services per visit (+0.23 increase per year (95% CI 0.22 to 0.23); P<0.001). The most frequent services provided during an outpatient ED visit are presented in online supplementary appendix 5. There were very few physician professional claims for services other than evaluation and management in all 3 years, but the mean number of procedures per visit increased slightly from 0.31 in 2006 to 0.34 in 2012 (P<0.001), the most frequent of which were for ECG interpretation (online supplementary appendix 6).
When examining trends in hospital admission, we observed a reduction in admission rate from the ED over time, with 35.9% of visits leading to admission in 2012 compared with 40.1% in 2006 (−0.68% per year (95% CI −0.71% to −0.65%); P<0.001; table 2). The number of visits with an associated observation claim rose from 15 914 visits (3.9% of total) in 2006 to 22 226 visits (5.4% of total) in 2012. However, even after reclassifying observation claims as admissions, there was still a statistically significant decrease in admission rate from 42.1% in 2006 to 39.1% in 2012 (−0.48% per year (95% CI −0.51% to −0.45%); P<0.001). In contrast, the proportion of all ED visits resulting in an ICU admission increased (11.7% to 12.3%; +0.11% per year (95% CI 0.09% to 0.12%); P<0.001).
Trends by diagnosis
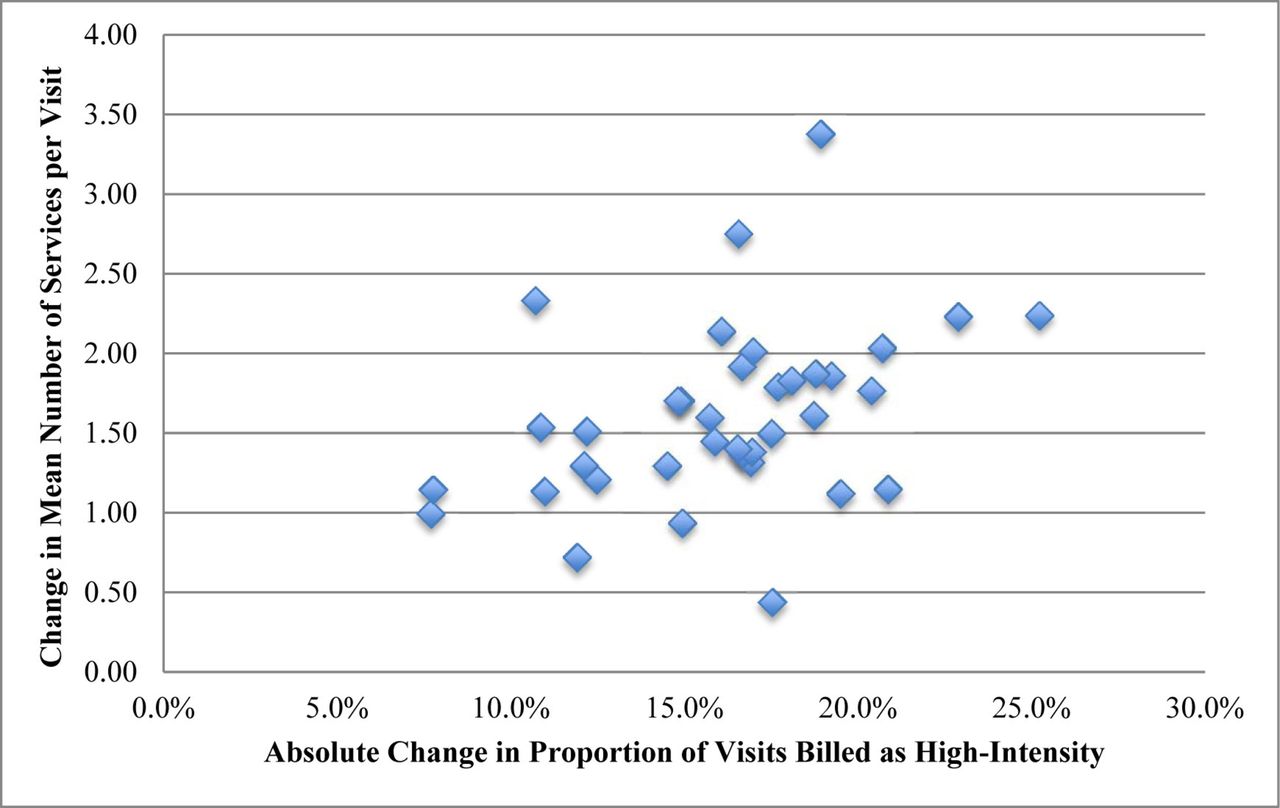
On examining the 39 condition categories individually (online supplementary appendix 1), diagnosis categories with the largest change in the proportion of high-intensity visits tended to have a mid-range baseline intensity (online supplementary appendix 7). Skin and subcutaneous infections had the lowest absolute change (5.9% of visits categorised as high intensity in 2006 to 13.6% in 2012; +7.8% (95% CI 6.4% to 9.3%); P<0.001), and intestinal infections had the greatest (25.2%; from 28.1% in 2006 to 53.3% in 2012; +25.2% (95% CI 20.8% to 29.6%); P<0.001). We found that those diagnoses with greater increases in intensity tended to have an increase in mean number of services (figure 2), with moderate correlation (r=0.38 (95% CI 0.07 to 0.63); P=0.02) between the change in percentage of high-intensity visits and the change in mean number of services provided per visit for each diagnosis category.

Absolute change in visit intensity over time versus absolute change in the mean number of services by diagnosis category* for outpatient emergency department visits†. *Thirty-nine diagnosis categories previously defined in the emergency medicine literature (Gabayan et al 25). †Changes in mean number of procedures and proportion of high-intensity visits adjusted for patient age, sex, race and Medicaid eligibility.
Impact of patient characteristics and services on high-intensity billing
We next used four separate logistic regressions to determine the extent to which the trends in high-intensity billing are explained by trends in patient demographics, chronic conditions and services provided (table 3). Time alone explained between 1.3% of the variation in high-intensity billing for all visits, 3.4% for inpatient visits and 2.7% for outpatient visits. Incorporating patient age, sex, race and Medicaid eligibility again increased the pseudo R2 by less than 1%, regardless of disposition. Incorporating patient comorbidities (HCCs) increased the model’s explanatory power to 9.0% for all visits, 3.6% for inpatient visits and 4.3% for outpatient visits. Incorporating services in the model led to the greatest increase in pseudo R2 and explained 46.5% of the variation in high-intensity billing for outpatient visits. While incorporating services had the greatest impact on model R2 for inpatient visits and visits overall, it still explained only 5.1% of the variation for inpatient visits and 14.8% for visits overall. When we reclassified observation claims as admissions, our results were similar (pseudo R2 of 0.14 for visits overall, 0.05 for inpatient visits and 0.44 for outpatient visits for the final model incorporating time, patient demographics and chronic conditions, and services).
Comparison of pseudo R2* for sequential models† incorporating explanatory variables for the trend in ED practice intensity
Additionally, we calculated the predicted number of high-intensity visits that would have occurred in 2006 using coefficients for the variables in our models from 2009 and 2012. We calculated the difference between the predicted and observed number of high-intensity visits in 2006. For inpatient ED visits, this difference revealed an additional 24 819 visits that would have been classified as high intensity using 2009 coefficients (9.5% of all inpatient visits; online supplementary appendix 8) and 35 504 inpatient visits (13.6%) that would have been classified as high intensity using 2012 coefficients. For outpatient visits, this difference revealed an additional 1101 visits (0.3%) that would have been classified as high intensity using 2009 coefficients, and 16 905 (4.1%) would have been classified as high intensity using 2012 coefficients. These additional visits represent the degree to which billing for high-intensity emergency care has changed in ways that are not explained by the variables in our model and may represent upcoding.
Discussion
In our study of elderly Medicare beneficiaries, we found that ED visits are increasingly billed at the highest levels of intensity, with nearly 60% of ED visits in our sample coded at a level 5 or as critical care in 2012, up from 46% in 2006. We found a concomitant increase in services provided in the ED and during an associated inpatient stay. While overall admission rate decreased over time, a greater fraction of ED visits resulted in admission to intensive care. We found that trends in high-intensity billing varied by clinical condition; diagnoses with the greatest change in high-intensity billing also had the greatest increase in number of services. These findings persisted when we repeated our analyses reclassifying observation claims as admissions. Finally, using multivariable modelling, we found that trends in patient characteristics, as well as in services provided during the visit, moderately accounted for the increase in practice intensity for outpatient ED visits. If the process for determining high-intensity visits in 2012 were applied to visits in 2006, we would have seen an additional 4.1% of outpatient visits and 13.6% of inpatient visits coded as high intensity. In other words, those additional increases were unexplained in our model and could potentially represent secular changes such as upcoding.
Our results are consistent with other work showing a growth in high-intensity emergency care. A study of all ED visits in California20 also demonstrated a growth in physician billing for high-intensity visits, particularly among safety net hospitals. Other studies using national datasets have documented greater use of tests and treatments in the ED such as advanced imaging, blood tests and intravenous fluids.15 16 Exploring the idea that doing more in the ED can prevent hospitalisations, one study found that greater use of CT scans was associated with a reduction in admissions and transfers.31 Our study adds to this literature by linking physician billing for high-intensity emergency care to services provided during the ED visit for a national sample of Medicare beneficiaries. Our findings suggest that the growth in high-intensity billing has been accompanied by an observable increase in diagnostic and treatment intensity while admission rates have fallen.
While prior studies have suggested that the fears of upcoding due to EHRs may not be fully warranted,14 there has been concern that the trend in billing for high-intensity emergency care may represent trends in coding rather than actual changes in practice. Using multivariable modelling, we found that observable factors such as patient characteristics and numbers of services and procedures moderately explained, but did not fully account for, the trends in high-intensity billing for outpatient visits. It is possible that part of the residual trend could be attributed to upcoding; our study, however, is unable to identify conclusively whether this is the case.
ED visits in the USA have continued to rise10 32–34 despite health insurance expansion and cost-control efforts that were predicted to reduce ED utilisation. The role of emergency medicine in the acute care landscape has also expanded,35 with EDs assuming greater responsibility for managing complex problems while reserving limited and costly hospital capacity for those truly requiring inpatient care. With the growth of alternative payment models, reducing admissions for ED patients with moderate-severity problems have been proposed as a strategy to reduce costs.36 Our findings are consistent with this new model of emergency care. We found an increase in services while admission rates fell, even after accounting for the growth in observation stays. We found the greatest increases in high-intensity billing and services among conditions with moderate baseline intensity such as pneumonia and intestinal infections, for which the decision to admit likely involves greater provider discretion relative to higher acuity conditions. While our study was not designed to assess the relationship between intensity of emergency care and admission rate, it is possible that doing more for patients in the ED may have allowed a greater number to be safely discharged. The rise in number of services, including critical care procedures, provided during hospital admission suggests that the average acuity of patients who ultimately are admitted may be increasing over time.
Our study has a number of limitations. Given the use of administrative data, clinical markers of acuity, such as vital signs and laboratory data that may have been helpful in further detailing any trends in patient acuity over time, were not available. Also, time spent observing and treating patients is another key component of practice intensity that we could not measure with our dataset and could potentially account for some of the remaining time trend in practice intensity. Additionally, our modelling explained relatively little of the variation for inpatient visits and ED visits overall. This is likely due to the fact that, unlike for outpatient visits, there is substantially less detail in the dataset regarding services provided in the ED for visits resulting in admission. Also, while national in scope, our analysis is limited to elderly fee-for-service Medicare beneficiaries and may not be generalisable to other populations.
In summary, the rise in billing for high-intensity emergency care has been portrayed as an unintended consequence of the growth of health information technology rather than reflecting a change in practice. However, this trend has been accompanied by an increase in the provision of services in the hospital and in the ED. Multivariable modelling incorporating patient characteristics, comorbidities and services provided moderately explained the trends in high-intensity billing. It is unclear the degree to which changes in coding practices explain the remaining variation. This rise in high-intensity emergency care has occurred while rates of admission from the ED have fallen, raising the possibility that a greater amount of work performed in the ED may have allowed more patients to avoid inpatient treatment during an acute episode. Further study may be useful in determining what impact the trend in high-intensity emergency care has had on total costs of care and patient outcomes.
References
Footnotes
Contributors LGB had full access to all of the data in the study and takes responsibility for the integrity of the data and the accuracy of the data analysis. LGB and RYH developed the study concept and LGB, RCW, EJO and RYH all substantially contributed to the study design. LGB, RCW and EJO performed the statistical analyses, and all authors interpreted the data. LGB and RYH drafted the manuscript. LGB, RCW, EJO and RYH revised the manuscript for important intellectual content. All authors approved the final version of the manuscript.
Funding This research received no specific grant from any funding agency in the public, commercial or not-for-profit sectors.
Competing interests None declared.
Patient consent Not required.
Ethics approval The Office of Human Research Administration approved this study.
Provenance and peer review Not commissioned; externally peer reviewed.
Data sharing statement No additional data available.